Resources
About Us
Microalgae Market Size & Forecast
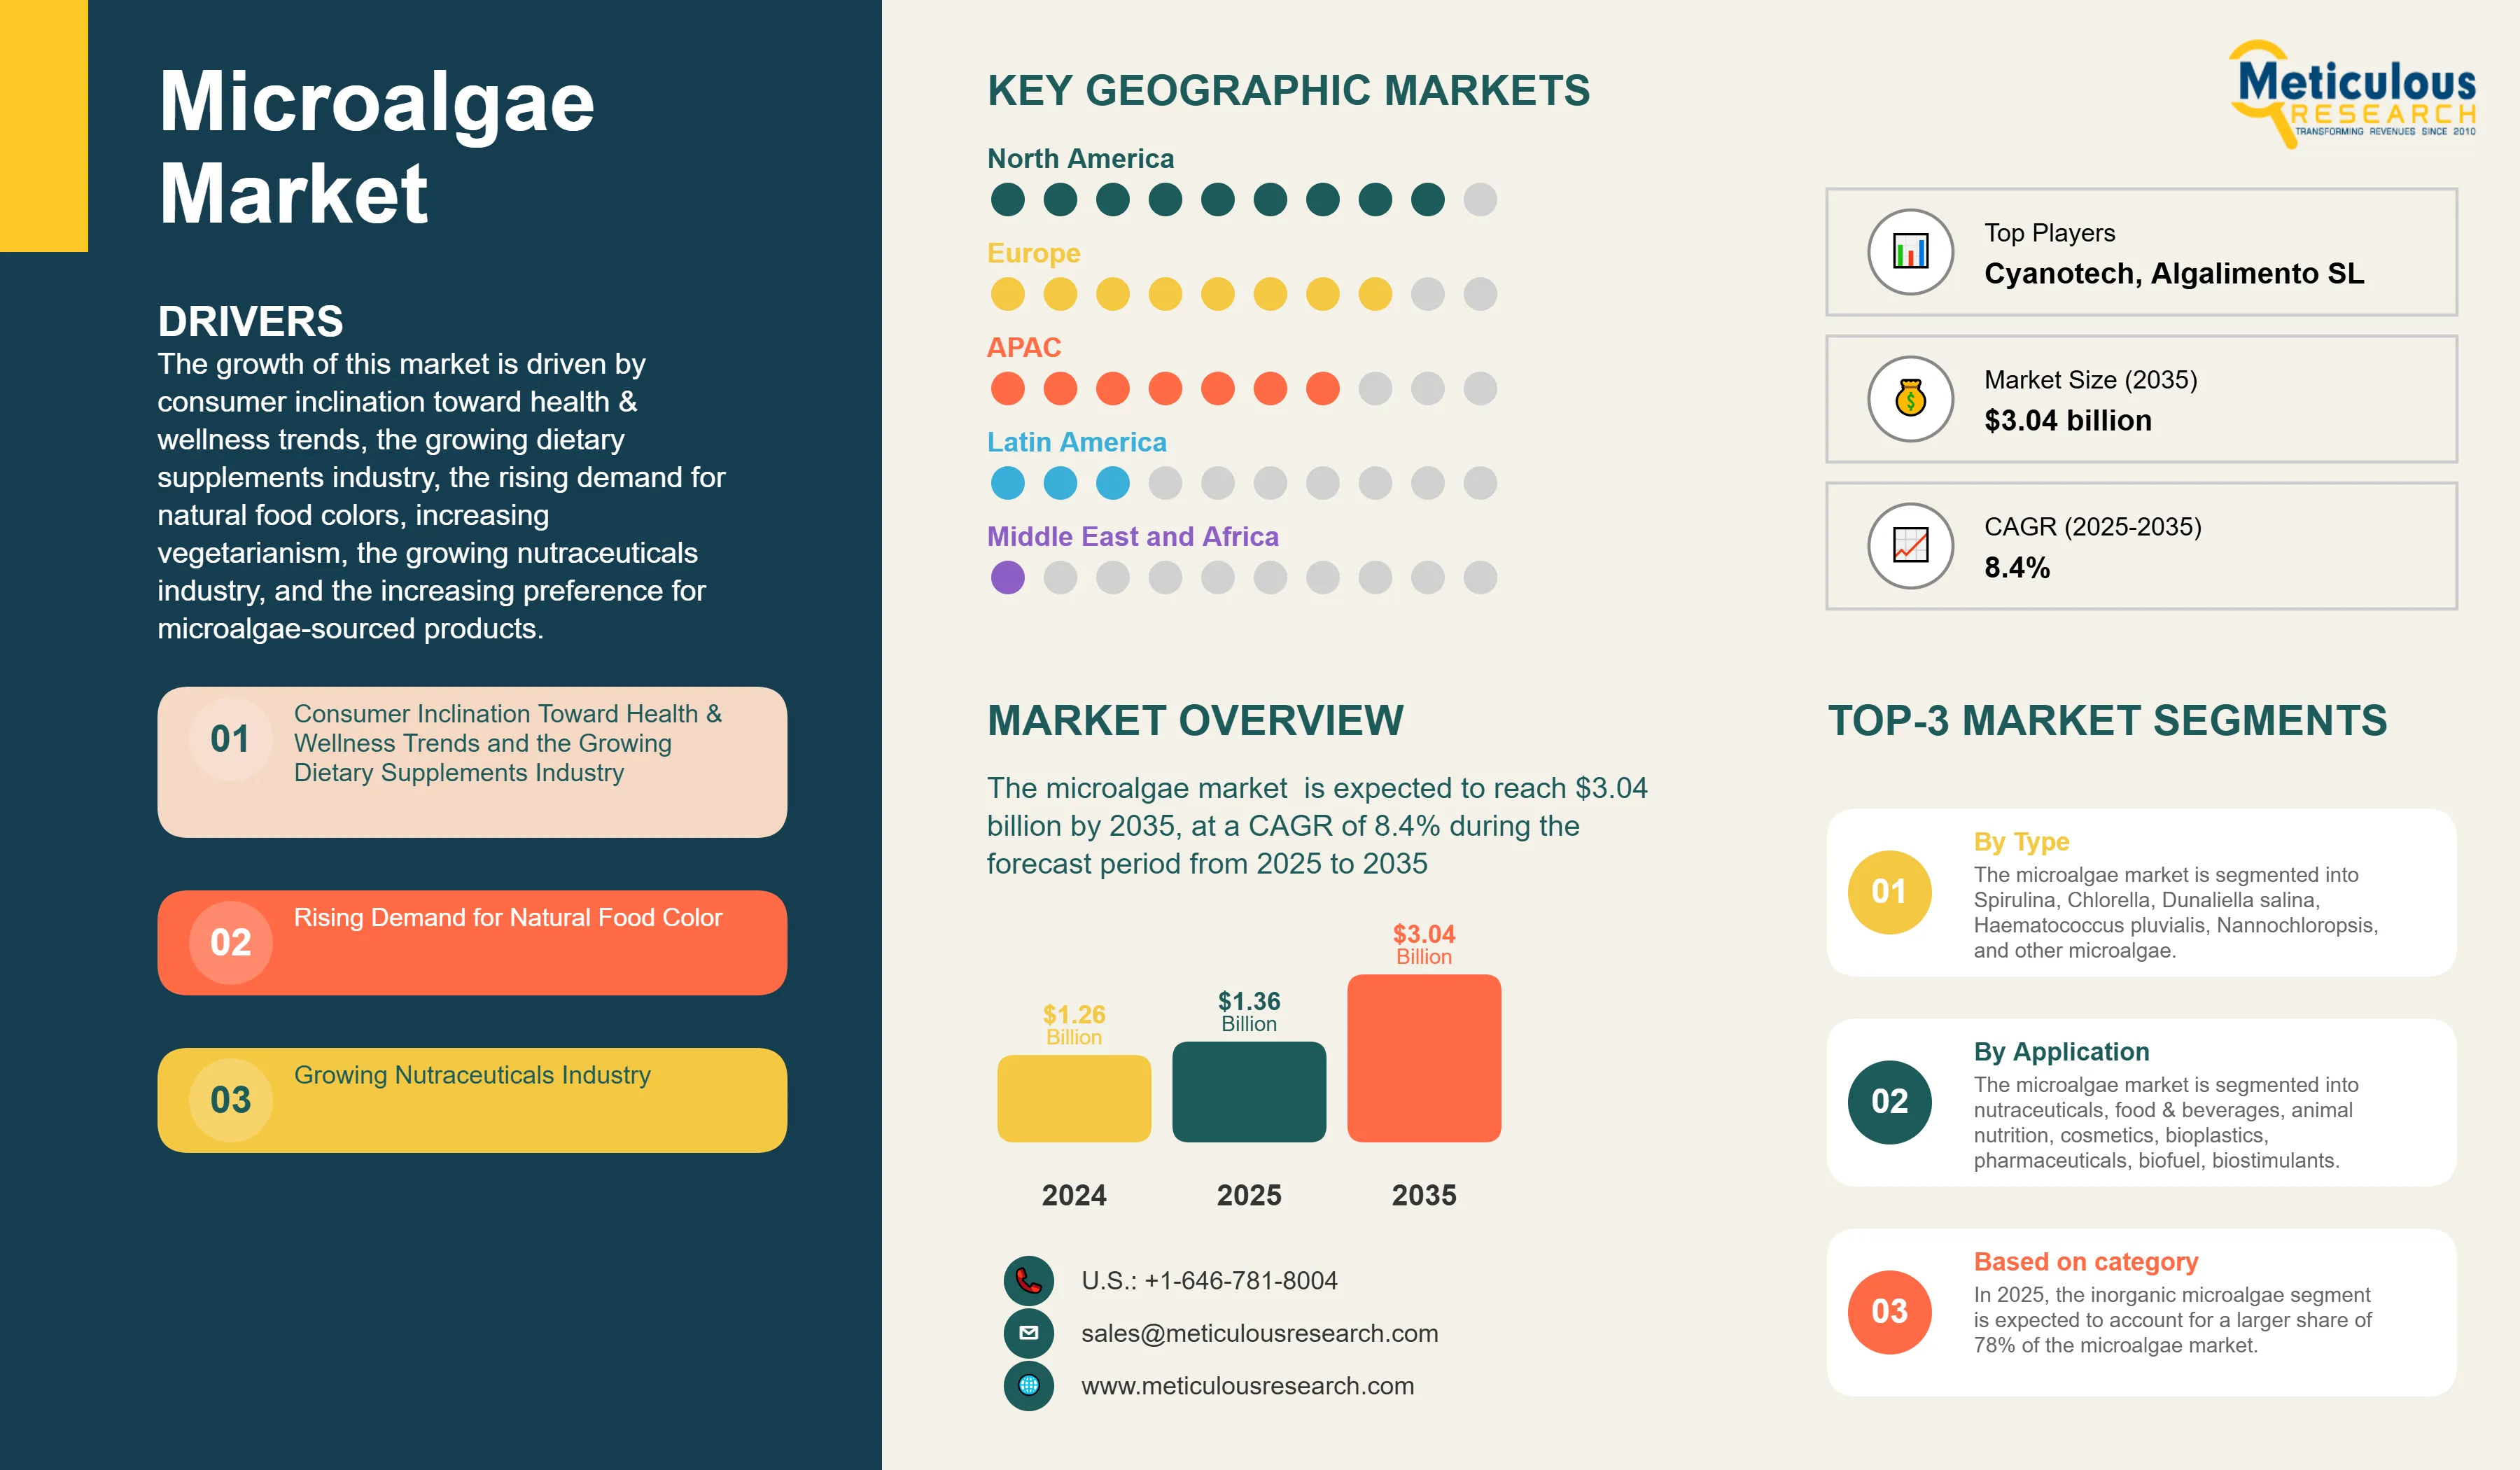
The microalgae market was valued at $1.26 billion in 2024. This market is expected to reach $3.04 billion by 2035 from an estimated $1.36 billion in 2025, at a CAGR of 8.4% during the forecast period from 2025 to 2035
The growth of this market is driven by consumer inclination toward health & wellness trends, the growing dietary supplements industry, the rising demand for natural food colors, increasing vegetarianism, the growing nutraceuticals industry, and the increasing preference for microalgae-sourced products. However, low awareness regarding the benefits of microalgae and the complexities in the production of algae products are expected to restrain the growth of this market.
The rising demand for phycocyanin and the growing demand for microalgae among biorefineries are expected to create market growth opportunities. However, contamination risks are a major challenge for the players operating in this market. Moreover, the growing adoption of new production technologies (photobioreactors) is a prominent trend in the microalgae market.
Click here to: Get Free Sample Pages of this Report
Rising Demand for Natural Food Colors
Nowadays, consumers have become more aware of health and environmental issues. As a result, they increasingly prefer naturally sourced colorants and dyes over synthetic alternatives. Microalgae are microscopic unicellular organisms that are major photosynthesizers that efficiently convert available solar energy into chemical energy. Due to their distinct advantages over terrestrial plants, such as faster growth rates, ability to grow on nonarable land, and diversity in the production of various natural bioactive compounds (e.g., lipids, proteins, carbohydrates, and pigments), microalgae are gradually being recognized as a sustainable source for the production of natural food-grade colorants.
Furthermore, consumers' rising health consciousness and inclination toward environment-friendly products are driving the demand for naturally grown food products across the globe. As a result, food manufacturers widely use natural food colors to restore the attractiveness of food & beverage products after processing. Also, in the U.S., the FDA has banned the use of any artificial color additives linked to cancer in either animal or human applications. All these factors are driving the adoption of natural food colors.
Spirulina has a blue-green color, provides bright, vivid blue and green shades, and hence, can be used in various types of confectionery and chewing gums. The USFDA has approved the use of phycocyanin as a natural colorant in food & beverage products. Hence, the demand for phycocyanin has risen dramatically, particularly in the Americas and Europe. The demand for spirulina, as a natural food color source, is high in the North American food processing industry. It is used in various applications, including beverages, dairy, confectionery, and other food segments such as frosting, ice cream, dry beverage mixes, yogurt, and gelatin.
Moreover, there are concerns about the safety of using synthetic astaxanthin for direct human consumption due to its different stereochemistry and the potential carryover of synthesis intermediates. These concerns make natural astaxanthin derived from the haematococcus pluvialis microalgae a preferred choice for high-end markets. Haematococcus pluvialis has already been approved as a color additive in salmon feeds and as a dietary supplement ingredient for human consumption in the U.S., Japan, and several European countries. However, it is not yet approved by the EFSA (European Food Safety Authority) for use in therapeutic applications.
Supercritical CO2 extracts from haematococcus pluvialis have been granted novel food status by the U.K. Food Standards Agency (FSA), while the FDA has granted astaxanthin from haematococcus pluvialis the GRAS (Generally Recognized as Safe) status. Thus, astaxanthin is a high-value product in the carotenoid marketplace and is also used as a pigmentation source for salmon, shrimp, trout, and poultry applications.
Thus, the rising demand for natural food colors drives the growth of the microalgae market.
Growing Nutraceuticals Industry
Consistent growth in the aging population, increased consumer awareness regarding preventative healthcare, the rising number of self-directed consumers (preferring self-diagnosis over health practitioner diagnosis), channel proliferation (variety of marketing techniques and eCommerce platforms), and the shift from ingredient-focused messaging to broader brand positioning (grouping of supplements together to form a healthy benefits package) are the key factors driving the growth of the supplements industry. The sales of vitamins, minerals, and nutritional & herbal supplements (VMHS) are growing globally.
According to recent market analysis, the global nutraceuticals market was valued at approximately USD 591 billion in 2024 and is projected to reach USD 919 billion by 2030, growing at a CAGR of 7.6%. This growth is mainly attributed to the increasing popularity of natural nutraceuticals. Also, natural nutraceuticals are cheaper compared to prescription drugs and more easily available.
Moreover, according to recent industry reports (2024-2025), the nutritional supplements industry continues to experience strong growth, driven by consumers' increasing preference for natural alternatives to nutraceuticals and functional foods and drinks. According to the International Trade Administration, India's nutraceutical industry is expected to hold at least 3.5% of the global market share in 2025. Therefore, the nutraceuticals market in India is expected to continue its robust growth trajectory through 2030. Thus, the growing nutraceuticals industry and the rising demand for natural supplements are expected to drive the microalgae market.
Furthermore, chlorella is one of the most scientifically researched algae, with many publications from medical & research institutions and universities. It is the best-selling health food supplement in Japan, with over 30% of the population consuming it as a principal health supplement. Chlorella has also been found to boost the immune system, reduce the intensity of many chronic health problems, and reduce the side effects of medications. Its detoxifying, nourishing, and revitalizing properties enable the body's natural defenses and repair systems to function more efficiently. Thus, the growing nutraceuticals industry is expected to boost the demand for microalgae, driving the growth of this market.
Microalgae Market Opportunity
Growing Demand for Microalgae Among Biorefineries
Microalgae biorefinery systems have been extensively studied regarding resources, energy expenditure, biofuel production potential, and high-value products. Among these, the genus Spirulina stands out for its commercial importance, representing over 30% of the global microalgae biomass production due to its high protein content and significant levels of carotenoids and phycocyanin. Additionally, Spirulina cultivation contributes to environmental benefits, such as reducing greenhouse gases and assisting in effluent treatment.
Biorefining is a process that sustainably converts biomass into value-added products and energy. The effectiveness of a biorefinery depends significantly on the choice of raw materials and the technologies used to produce these value-added products. Microalgae are considered a cost-effective raw material for this process due to their unique properties. Unlike terrestrial plants, microalgae do not have highly resistant cell walls, stems, or roots, which facilitates easier degradation.
The interest in using microalgae as a biofuel feedstock has increased in response to the energy crisis, climate change, and the depletion of natural resources. To enhance the economic viability of microalgae biofuels, it is crucial to maximize algal biomass production while reducing operational and maintenance costs. Achieving economically viable algal fuels will require at least another decade of research and development.
ExxonMobil partnered with Synthetic Genomics, Inc., with the goal of producing 10,000 barrels of algae-based fuels per day by 2025. While algal biofuels are not yet commercially feasible, several companies in the U.S., Europe, and other regions are already producing algal fuels on a commercial scale. In addition, Earthrise is engaged in research collaborations with major algae biofuel and bioproduct companies worldwide. The development of microalgal biofuels from microalgae is not economically feasible, given the overwhelming capital investments and operational costs. Hence, high-value co-products are produced by extracting a fraction of algae to improve the economics of a microalgae biorefinery.
Microalgae are considered living-cell factories with simple growth requirements due to their efficient sunlight utilization. Their potential for the production of energy and value-added products is widely recognized. The versatility and high potential of microalgae can support microalgae biorefineries and microalgae-based bio economies, creating opportunities for the players operating in this market.
Microalgae Market Analysis: Key Findings
The Spirulina Segment to Dominate the Microalgae Market in 2025
Based on type, the microalgae market is segmented into Spirulina, Chlorella, Dunaliella salina, Haematococcus pluvialis, Nannochloropsis, and other microalgae. In 2025, the spirulina segment is expected to account for the largest share of 50% of the microalgae market. The substantial market share of this segment is primarily driven by the escalating health and wellness trends, the expanding dietary supplements sector, and the rising demand for natural food colors. Additionally, the increasing prevalence of vegetarianism, stringent regulations on synthetic colors and flavors, and the growing concern over malnutrition contribute to this segment's growth. The heightened preference for Spirulina-based products, especially those rich in Omega-3 fatty acids, coupled with its growing application in aquaculture and substantial investments from major color companies, further bolster its market position. However, limited awareness of Spirulina's benefits and production challenges may somewhat impede the segment's growth.
However, the Haematococcus pluvialis segment is expected to register the highest CAGR of 13% during the forecast period. This segment's growth is attributed to the increasing demand for natural astaxanthin in nutraceuticals, natural food colorants, and awareness about clean-label products. Furthermore, the growing use of natural astaxanthin in poultry and aquaculture is further expected to support the growth of this market.
The Ponds Segment to Dominate the Microalgae Market in 2025
Based on production technique, the microalgae market is segmented into ponds, photobioreactors (PBR), and fermenters. In 2025, the ponds segment is expected to account for the largest share of the microalgae market. This segment’s large market share is primarily due to the large number of key players involved in the pond cultivation of microalgae. Open ponds, also known as raceway ponds, offer lower investment and operational costs, reduced energy expenses, and the potential for higher biomass production. These advantages are anticipated to further drive market growth.
However, the photobioreactors (PBR) segment is anticipated to register the highest CAGR of 10% during the forecast period due to the increasing demand for algal biomass across various sectors—such as nutraceuticals, pharmaceuticals, cosmetics, food and beverage, and biofuels—contributes to this market segment's growth. Additionally, the benefits of photobioreactor microalgae cultivation, including reduced susceptibility to species contamination, enhanced productivity, lower harvesting costs, decreased water and carbon dioxide losses, and improved control over cultivation conditions like temperature and pH, are expected to further support the growth of this segment.
The Inorganic Microalgae Segment to Witness High Demand During the Forecast Period
Based on category, the microalgae market is segmented into inorganic and organic. In 2025, the inorganic microalgae segment is expected to account for a larger share of 78% of the microalgae market. This segment’s large market share is primarily attributed to the cost-effective production and high availability of microalgae grown through traditional methods.
However, the organic microalgae segment is expected to record a higher CAGR during the forecast period. This segment's high growth is driven by the increasing demand for certified organic products in the food industry and the growing demand for natural food colorants. Furthermore, the increasing demand for organic growth media among microalgae manufacturers is expected to support its growth.
The Business Channel (B2B) Segment to Dominate the Microalgae Market in 2025
Based on distribution channel, the microalgae market is segmented into consumer channel (B2C) and business channel (B2B). In 2025, the business channel (B2B) segment is expected to account for a larger share of the microalgae market. The large market share of this segment is mainly attributed to the direct bulk purchasing of microalgae by manufacturers from various industries, such as nutraceuticals, food & beverage, and animal feed, for further product development.
The Nutraceuticals Segment to Dominate the Microalgae Market in 2025
Based on application, the microalgae market is segmented into nutraceuticals, food & beverages, animal nutrition, cosmetics, bioplastics, pharmaceuticals, biofuel, biostimulants. In 2025, the nutraceuticals segment is expected to account for the largest share of 54% of the microalgae market. The large market share of this segment is primarily attributed to the booming nutraceuticals sector, growing health concerns of the aging population worldwide, the rising need for natural alternatives for traditional pharmaceutical products, and increasing consumer awareness regarding the link between nutrition and health.
However, bioplastics is expected to be the fastest growing segment in the microalgae market, driven by stringent global regulations on fossil-based plastics and the rapid push toward sustainable, biodegradable alternatives. Microalgae-derived biopolymers, particularly PHA and PLA blends, are gaining strong traction as they offer lower environmental impact, reduced carbon emissions, and the potential to replace petroleum-based materials in packaging and consumer goods. While still relatively nascent in terms of commercial capacity, the segment is witnessing accelerated R&D investment, pilot-plant scale-ups, and collaborations between algae biomass producers and packaging manufacturers. As technological advancements reduce production costs and improve polymer yield, adoption is projected to rise rapidly, giving the bioplastics segment one of the highest growth rates within the overall microalgae application landscape.
Geographical Analysis
North America Dominates the Microalgae Market
Based on geography, the microalgae market is majorly segmented into five regions: North America, Europe, Asia-Pacific, Latin America, and the Middle East & Africa. In 2025, North America is expected to account for the largest share of 43% of the microalgae market, followed by Asia-Pacific and Europe. The North American microalgae market is estimated to be worth USD 584 million in 2025. North America's significant market share can be attributed to several key factors, such as huge consumption of health supplements, stringent regulations against the use of synthetic colors, growth of subsidiary industries like cosmetics and biofertilizers, increasing preference for natural protein sources, and presence of key algae biomass manufacturers with huge production capacities, especially in the U.S.
However, Europe is expected to record the highest CAGR during the forecast period due to the increased adoption of microalgae, especially Spirulina and Chlorella, in the manufacturing of therapeutic & nutritional products, growing reluctance towards the usage of synthetic colors, rising demand for natural blue colorants, and investments from leading color stakeholders in the phycocyanin space.
Microalgae Market: Key Companies
The report offers a competitive analysis based on an extensive assessment of the leading players’ product portfolios, geographic presence, and key growth strategies adopted in the last three to four years. Some of the key players operating in the microalgae market are Fuqing King Dnarmsa Spirulina Co., Ltd. (China), Earthrise Nutritionals, LLC, (U.S.), E.I.D. - PARRY (INDIA) LIMITED (a subsidiary of M/s. Ambadi Investments Limited) (India), Cyanotech Corporation (U.S.), C.B.N. Bio-engineering Co., Ltd (China), YUNNAN GREEN A BIOLOGICAL PROJECT CO., LTD. (Yunnan Spirin Biotechnology Co. Ltd) (China), Jiangshan COMP SPIRULINA CO., LTD. (China), Inner Mongolia Rejuve Biotech Co., Ltd. (China), Zhejiang Binmei Biotechnology Co., Ltd. (China), Bluetec Naturals CO., LTD. (China), Taiwan Chlorella Manufacturing Company(TCMC) (Taiwan), Sun Chlorella corporation (Japan), Roquette Klötze GmbH & Co. KG (Germany), Gong Bih Enterprise Co., Ltd. (Taiwan), Yaeyama Shokusan Co., Ltd. (Euglena Co Ltd) (Japan), Vedan Biotechnology Corporation (Taiwan), AlgoSource (France), Tianjin Norland Biotech CO., LTD (China), Phycom BV (Netherlands), Allmicroalgae Natural Products S.A. (Portugal), Aliga Microalgae (Denmark), Taiwan Wilson Enterprise Inc. (Taiwan), Daesang Corporation (Korea), Algalimento SL (Spain), Seagrass Tech Private Limited (India), Plankton Australia Pty Limited (Australia), Hangzhou Ouqi Food Co., Ltd. (China), and Shaanxi Rebecca Bio-Tech Co., Ltd (China).
Microalgae Industry Overview: Latest Developments from Key Industry Players
Microalgae Market Research Summary
|
Particulars |
Details |
|
Number of Pages |
258 |
|
Format |
|
|
Forecast Period |
2025–2035 |
|
Base Year |
2025 |
|
CAGR (Value) |
8.4% |
|
Market Size (Value), 2025 |
USD 1.36 Billion |
|
Market Size (Value), 2035 |
USD 3.04 Billion |
|
CAGR (Volume) |
8.5% |
|
Market (Volume) |
1,61,503.7 tons by 2035 |
|
Segments Covered |
By Type
By Production Technique
By Category
By Distribution Channel
By Application
|
|
Countries Covered |
North America (U.S., Canada), Europe (Germany, France, U.K., Italy, Spain, Netherlands, Denmark, Sweden, and Rest of Europe), Asia-Pacific (China, India, Japan, Australia, and Rest of Asia-Pacific), Latin America (Brazil, Mexico, Argentina, and Rest of Latin America), and the Middle East & Africa (Egypt, Saudi Arabia, South Africa, UAE, and Rest of Middle East & Africa) |
|
Key Companies |
Fuqing King Dnarmsa Spirulina Co., Ltd. (China), Earthrise Nutritionals, LLC, (U.S.), E.I.D. - PARRY (INDIA) LIMITED (a subsidiary of M/s. Ambadi Investments Limited) (India), Cyanotech Corporation (U.S.), C.B.N. Bio-engineering Co., Ltd (China), YUNNAN GREEN A BIOLOGICAL PROJECT CO., LTD. (Yunnan Spirin Biotechnology Co. Ltd) (China), Jiangshan COMP SPIRULINA CO., LTD. (China), Zhejiang Binmei Biotechnology Co., Ltd. (China), Bluetec Naturals CO., LTD. (China), Taiwan Chlorella Manufacturing Company(TCMC) (Taiwan), Sun Chlorella corporation (Japan), Roquette Klötze GmbH & Co. KG (Germany), Gong Bih Enterprise Co., Ltd. (Taiwan), Yaeyama Shokusan Co., Ltd. (Euglena Co Ltd) (Japan), Vedan Biotechnology Corporation (Taiwan), AlgoSource (France), Tianjin Norland Biotech CO., LTD (China), Phycom BV (Netherlands), Allmicroalgae Natural Products S.A. (Portugal), Aliga Microalgae (Denmark), Taiwan Wilson Enterprise Inc. (Taiwan), Daesang Corporation (Korea), Algalimento SL (Spain), Seagrass Tech Private Limited (India), Plankton Australia Pty Limited (Australia), Hangzhou Ouqi Food Co., Ltd. (China), and Shaanxi Rebecca Bio-Tech Co., Ltd (China) |
Microalgae, also known as microphytes, are microscopic algae found in marine systems and freshwater. They vary in shape and size, ranging from micrometers to hundred micrometers. Microalgae convert sunlight, carbon dioxide, and water into algal biomass. They impart high nutrition and comprise high-value compounds, including pigments, fatty acids, and antioxidants and are gaining popularity as a promising nutrient source.
The microalgae market study provides valuable insights, market sizes, and forecasts in terms of value and volume by type, and geography. However, the study provides insights, market sizes, and forecasts only in terms of value based on production technique, category, distribution channel, and application.
The microalgae market is projected to reach $3.04 billion by 2035, at a CAGR of 8.4% during the forecast period.
In 2025, the spirulina segment is expected to hold a major share of the microalgae market.
The bioplastic segment is expected to witness the fastest growth during the forecast period of 2025–2035.
The consumer inclination toward health & wellness trends and the growing dietary supplements industry, the rising demand for natural food colors, increasing vegetarianism, the growing nutraceuticals industry, and the increasing preference for microalgae-sourced products are the key factors supporting the growth of this market. Moreover, the rising demand for phycocyanin and the growing demand for microalgae among biorefineries create opportunities for players operating in this market.
The key players operating in the microalgae market are Fuqing King Dnarmsa Spirulina Co., Ltd. (China), Earthrise Nutritionals, LLC, (U.S.), E.I.D. - PARRY (INDIA) LIMITED (a subsidiary of M/s. Ambadi Investments Limited) (India), Cyanotech Corporation (U.S.), C.B.N. Bio-engineering Co., Ltd (China), YUNNAN GREEN A BIOLOGICAL PROJECT CO., LTD. (Yunnan Spirin Biotechnology Co. Ltd) (China), Jiangshan COMP SPIRULINA CO., LTD. (China), Zhejiang Binmei Biotechnology Co., Ltd. (China), Bluetec Naturals CO., LTD. (China), Taiwan Chlorella Manufacturing Company(TCMC) (Taiwan), Sun Chlorella corporation (Japan), Roquette Klötze GmbH & Co. KG (Germany), Gong Bih Enterprise Co., Ltd. (Taiwan), Yaeyama Shokusan Co., Ltd. (Euglena Co Ltd) (Japan), Vedan Biotechnology Corporation (Taiwan), AlgoSource (France), Tianjin Norland Biotech CO., LTD (China), Phycom BV (Netherlands), Allmicroalgae Natural Products S.A. (Portugal), Aliga Microalgae (Denmark), Taiwan Wilson Enterprise Inc. (Taiwan), Daesang Corporation (Korea), Algalimento SL (Spain), Seagrass Tech Private Limited (India), Plankton Australia Pty Limited (Australia), Hangzhou Ouqi Food Co., Ltd. (China), and Shaanxi Rebecca Bio-Tech Co., Ltd (China).
Europe is expected to witness significant growth during the forecast period, mainly due to the increased adoption of microalgae, especially spirulina and Chlorella, in the manufacturing of therapeutic & nutritional products, growing reluctance towards the usage of synthetic colors, rising demand for natural blue colorants, and investments from leading color stakeholders in the phycocyanin space.
1. Introduction
1.1. Market Definition
1.2. Market Ecosystem
1.3. Currency
1.4. Key Stakeholders
2. Research Methodology
2.1. Research Process
2.2. Data Collection & Validation
2.2.1. Secondary Research
2.2.2. Primary Research
2.3. Market Assessment
2.3.1. Market Size Estimation
2.3.1.1. Bottom-Up Approach
2.3.1.2. Top-Down Approach
2.3.1.3. Growth Forecast
2.4. Assumptions for the Study
2.5. Limitations for the Study
3. Executive Summary
3.1. Introduction
3.2. Segment Analysis
3.2.1. Microalgae Market, by Type
3.2.2. Microalgae Market, by Production Technique
3.2.3. Microalgae Market, by Distribution Channel
3.2.4. Microalgae Market, by Application
3.3. Regional Analysis
3.4. Competitive Landscape & Market Competitors
4. Market Insights
4.1. Introduction
4.2. Drivers
4.2.1. Consumer Inclination Toward Health & Wellness Trends and the Growing Dietary Supplements Industry
4.2.2. Rising Demand for Natural Food Color
4.2.3. Increasing Vegetarianism
4.2.4. Growing Nutraceuticals Industry
4.2.5. Increasing Preference for Microalgae-Sourced Products
4.3. Restraints
4.3.1. Global Microalgae Market: Impact Analysis of Market Restraints (2025–2035)
4.3.2. Low Awareness Regarding the Benefits of Microalgae
4.3.3. Complexities c the Production of Algae Products
4.4. Opportunities
4.4.1. Rising Demand for Phycocyanin
4.4.2. Growing Demand for Microalgae Among Biorefineries
4.5. Challenges
4.5.1. Contamination Risks
4.6. Trends
4.6.1. Growing Adoption of New Production Technologies (Photobioreactors)
4.7. Pricing Analysis
4.7.1. Microalgae Biomass Prices
4.7.1.1. Spirulina
4.7.1.2. Chlorella
4.7.1.3. Dunaliella Salina
4.7.1.4. Haematococcus Pluvialis
4.7.1.5. Nannochloropsis
4.7.1.6. Other Microalgae
4.7.2. High Value Microalgae Extract Prices
4.7.2.1. Phycocyanin
4.7.2.2. Chlorella Extracts
4.7.2.3. Astaxanthin Oleoresin
4.7.2.4. Omega-3 Fatty Acids
4.8. Microalgae Biomass Production Analysis
5. Global Microalgae Market, by Type
5.1. Introduction
5.2. Spirulina
5.3. Chlorella
5.4. Dunaliella Salina
5.5. Haematococcus Pluvialis
5.6. Nannochloropsis
5.7. Other Microalgae
6. Global Microalgae Market, by Production Technique
6.1. Introduction
6.2. Ponds
6.3. Fermenters
6.4. Photobioreactors (PBR)
6.4.1. Tubular Photobioreactors
6.4.2. Flat-Panel Photobioreactors
6.4.3. Vertical Column Photobioreactors
6.4.4. Other Photobioreactor Types (Airlift, Flat-Bag / Plastic Film PBRs)
7. Global Microalgae Market, by Distribution Channel
7.1. Introduction
7.2. Business Channel (B2B)
7.3. Consumer Channel (B2C)
8. Global Microalgae Market, by Application
8.1. Introduction
8.2. Nutraceuticals
8.3. Food & Beverage
8.4. Animal Nutrition
8.4.1. Dry Aquafeed
8.4.2. Live Aquaculture
8.4.3. Dry Animal Feed
8.4.4. Dry Pet Feed
8.5. Cosmetics
8.6. Bioplastics
8.7. Pharmaceuticals
8.8. Biofuel
8.9. Biostimulants
9. Global Microalgae Market, by Geography
9.1. Introduction
9.2. North America
9.2.1. U.S.
9.2.2. Canada
9.3. Europe
9.3.1. Germany
9.3.2. France
9.3.3. U.K.
9.3.4. Italy
9.3.5. Spain
9.3.6. Rest of Europe (RoE)
9.4. Asia-Pacific
9.4.1. China
9.4.2. India
9.4.3. Japan
9.4.4. Australia
9.4.5. Rest of Asia-Pacific (RoAPAC)
9.5. Latin America
9.5.1. Brazil
9.5.2. Mexico
9.5.3. Rest of Latin America (RoLATAM)
9.6. Middle East & Africa
9.6.1. Egypt
9.6.2. Saudi Arabia
9.6.3. South Africa
9.6.4. UAE
9.6.5. Rest of Middle East & Africa
10. Competitive Landscape
10.1. Introduction
10.2. Key Growth Strategies
10.3. Competitive Benchmarking
11. Company Profiles
11.1. Fuqing King Dnarmsa Spirulina Co., Ltd.
11.1.1. Business Overview
11.1.2. Product Portfolio
11.2. Earthrise Nutritionals, LLC
11.2.1. Business Overview
11.2.2. Product Portfolio
11.3. E.I.D. - Parry (India) Limited (A Subsidiary of M/S. Ambadi Investments Limited)
11.3.1. Business Overview
11.3.2. Financial Overview
11.3.3. Product Portfolio
11.4. Cyanotech Corporation
11.4.1. Business Overview
11.4.2. Financial Overview
11.4.3. Product Portfolio
11.5. C.B.N. Bio-Engineering Co., Ltd
11.5.1. Business Overview
11.5.2. Product Portfolio
11.6. Yunnan Green A Biological Project Co., Ltd. (Subsidiary of Yunnan Spirin Biotechnology Co. Ltd)
11.6.1. Business Overview
11.6.2. Product Portfolio
11.7. Jiangshan Comp Spirulina Co., Ltd
11.7.1. Business Overview
11.7.2. Product Portfolio
11.8. Zhejiang Binmei Biotechnology Co., Ltd.
11.8.1. Business Overview
11.8.2. Product Portfolio
11.9. Bluetec Naturals Co., Ltd.
11.9.1. Business Overview
11.9.2. Product Portfolio
11.10. Taiwan Chlorella Manufacturing Company (TCMC)
11.10.1. Business Overview
11.10.2. Product Portfolio
11.11. Sun Chlorella Corporation
11.11.1. Business Overview
11.11.2. Product Portfolio
11.12. Roquette Klötze GmbH & Co. KG
11.12.1. Business Overview
11.12.2. Product Portfolio
11.13. Gong Bih Enterprise Co., Ltd.
11.13.1. Business Overview
11.13.2. Product Portfolio
11.14. Yaeyama Shokusan Co., Ltd. (Euglena Co Ltd)
11.14.1. Business Overview
11.14.2. Product Portfolio
11.15. Vedan Biotechnology Corporation
11.15.1. Business Overview
11.15.2. Product Portfolio
11.16. Algosource
11.16.1. Business Overview
11.16.2. Product Portfolio
11.17. Tianjin Norland Biotech Co., Ltd
11.17.1. Business Overview
11.17.2. Product Portfolio
11.18. Phycom BV
11.18.1. Business Overview
11.18.2. Product Portfolio
11.19. Allmicroalgae Natural Products S.A.
11.19.1. Business Overview
11.19.2. Product Portfolio
11.19.3. Strategic Developments
11.20. Aliga Microalgae
11.20.1. Business Overview
11.20.2. Product Portfolio
11.20.3. Strategic Developments
11.21. Taiwan Wilson Enterprise Inc.
11.21.1. Business Overview
11.21.2. Product Portfolio
11.22. Daesang Corporation
11.22.1. Business Overview
11.22.2. Financial Overview
11.22.3. Product Portfolio
11.23. Algalimento SL
11.23.1. Business Overview
11.23.2. Product Portfolio
11.24. Seagrass Tech Private Limited
11.24.1. Business Overview
11.24.2. Product Portfolio
11.25. Plankton Australia Pty Limited
11.25.1. Business Overview
11.25.2. Product Portfolio
11.26. Hangzhou Ouqi Food Co., Ltd.
11.26.1. Business Overview
11.26.2. Product Portfolio
11.27. Shaanxi Rebecca Bio-Tech Co., Ltd
11.27.1. Business Overview
11.27.2. Product Portfolio
12. Appendix
12.1. Available Customization
List of Tables
Table 1 Global Microalgae Market: Impact Analysis of Market Drivers (2025–2035)
Table 2 Global Microalgae Market: Impact Analysis of Market Opportunities (2023–2030)
Table 3 Global Microalgae Market: Impact Analysis of Market Challenges (2023–2030)
Table 4 Limitations of Open Cultivation Systems
Table 5 A Comparative of Microalgae Cultivation Approaches
Table 6 Characteristics of the Four Promising Pbrs
Table 7 Production Cost and Specific Energy Consumption for Spirulina Cultivation in Open Ponds and Photobioreactors
Table 8 Average Selling Price of Spirulina, by Country/Region, 2023–2035 (USD/Ton)
Table 9 Average Selling Price of Chlorella, by Country/Region, 2023–2035 (USD/Ton)
Table 10 Average Selling Price of Dunaliella Salina, by Country/Region, 2023–2035 (USD/Ton)
Table 11 Average Selling Price of Haematococcus Pluvialis, by Country/Region, 2023–2035 (USD/Ton)
Table 12 Average Selling Price of Nannochloropsis, by Country/Region, 2023–2035 (USD/Ton)
Table 13 Average Selling Price of Other Microalgae, by Country/Region, 2023–2035 (USD/Ton)
Table 14 Average Selling Price of Food Grade Phycocyanin, by Country/Region, 2023–2035 (USD/Ton)
Table 15 Average Selling Price of Cosmetics Grade Phycocyanin, by Country/Region, 2023–2035 (USD/Ton)
Table 16 Average Selling Price of Analytical Grade Phycocyanin, by Country/Region, 2023–2035 (USD/Ton)
Table 17 Average Selling Price of Chlorella Extracts, by Country/Region, 2023–2035 (USD/Ton)
Table 18 Average Selling Price of Astaxanthin Oleoresin, by Country/Region, 2023–2035 (USD/Ton)
Table 19 Average Selling Price of Omega-3 Fatty Acids, by Country/Region, 2023–2035 (USD/Ton)
Table 20 Global Microalgae Biomass Production, by Species, 2023–2035 (Tons)
Table 21 Spirulina Production, by Region, 2023–2035 (Tons)
Table 22 Chlorella Production, by Region, 2023–2035 (Tons)
Table 23 Dunaliella Salina Production, by Region, 2023–2035 (Tons)
Table 24 Haematococcus Pluvilais Production, by Region, 2023–2035 (Tons)
Table 25 Nannochloropsis Production, by Region, 2023–2035 (Tons)
Table 26 Global Microalgae Market Size, by Type, 2023–2035 (USD Million)
Table 27 Global Microalgae Market Volume, by Type, 2023–2035 (Tons)
Table 28 Global Spirulina Market Size, by Country/Region, 2023–2035 (USD Million)
Table 29 Global Spirulina Market Volume, by Country/Region, 2023–2035 (Tons)
Table 30 Global Chlorella Market Size, by Country/Region, 2023–2035 (USD Million)
Table 31 Global Chlorella Market Volume, by Country/Region, 2023–2035 (Tons)
Table 32 Global Dunaliella Salina Market Size, by Country/Region, 2023–2035 (USD Million)
Table 33 Global Dunaliella Salina Market Volume, by Country/Region, 2023–2035 (Tons)
Table 34 Global Haematococcus Pluvialis Market Value, by Country/Region, 2023–2035 (USD Million)
Table 35 Global Haematococcus Pluvialis Market Volume, by Country/Region, 2023–2035 (Tons)
Table 36 Global Nannochloropsis Market Value, by Country/Region, 2023–2035 (USD Million)
Table 37 Global Nannochloropsis Market Volume, by Country/Region, 2023–2035 (Tons)
Table 38 Global Other Microalgae Market Value, by Country/Region, 2023–2035 (USD Million)
Table 39 Global Other Microalgae Market Volume, by Country/Region, 2023–2035 (Tons)
Table 40 Global Microalgae Market Size, by Production Technique, 2023–2035 (USD Million)
Table 41 Global Open Ponds-Produced Microalgae Market Size, by Country, 2023–2035 (USD Million)
Table 42 Global Fermenters-Produced Microalgae Market Size, by Country, 2023–2035 (USD Million)
Table 43 Global Photobioreactors-Produced Microalgae Market Size, by Country, 2023–2035 (USD Million)
Table 44 Global Tubular Photobioreactors Microalgae Market Size, by Country, 2023–2035 (USD Million)
Table 45 Global Flat-Panel Photobioreactors Microalgae Market Size, by Country, 2023–2035 (USD Million)
Table 46 Global Vertical Column Photobioreactors Microalgae Market Size, by Country, 2023–2035 (USD Million)
Table 47 Global Other Photobioreactor Types (Airlift, Flat-Bag / Plastic Film Pbrs) Microalgae Market Size, by Country, 2023–2035 (USD Million)
Table 48 Global Microalgae Market Size, by Distribution Channel, 2023–2035 (USD Million)
Table 49 Global Microalgae Market Size for Business Channel (B2b), by Country, 2023–2035 (USD Million)
Table 50 Global Microalgae Market Size for Consumer Channel (B2c), by Country, 2023–2035 (USD Million)
Table 51 Global Microalgae Market Size, by Application, 2023–2035 (USD Million)
Table 52 Protein Contains in Different Microalgae Species
Table 53 Global Microalgae Market Size for Nutraceuticals, by Country, 2023–2035 (USD Million)
Table 54 Global Microalgae Market Size for Food & Beverage, by Country, 2023–2035 (USD Million)
Table 55 Global Microalgae Market Size for Animal Feed, by Country, 2023–2035 (USD Million)
Table 56 Global Microalgae Market Size for Dry Aquafeed, by Country, 2023–2035 (USD Million)
Table 57 Global Microalgae Market Size for Live Aquaculture, by Country, 2023–2035 (USD Million)
Table 58 Global Microalgae Market Size for Dry Animal Feed, by Country, 2023–2035 (USD Million)
Table 59 Global Microalgae Market Size for Dry Pet Feed, by Country, 2023–2035 (USD Million)
Table 60 Global Microalgae Market Size for Cosmetics, by Country, 2023–2035 (USD Million)
Table 61 Global Microalgae Market Size for Bioplastics, by Country, 2023–2035 (USD Million)
Table 62 Global Microalgae Market Size for Pharmaceuticals, by Country, 2023–2035 (USD Million)
Table 63 Global Microalgae Market Size for Biofuel, by Country, 2023–2035 (USD Million)
Table 64 Global Microalgae Market Size for Biostimulants, by Country, 2023–2035 (USD Million)
Table 65 Microalgae Market Size, by Region, 2023–2035 (USD Million)
Table 66 Microalgae Market Volume, by Region, 2023–2035 (Tons)
Table 67 Some of the Key Customers of Spirulina in North America
Table 68 North America: Microalgae Market Size, by Country, 2023–2035 (USD Million)
Table 69 North America: Microalgae Market Volume, by Country, 2023–2035 (Tons)
Table 70 North America: Microalgae Market Size, by Type, 2023–2035 (USD Million)
Table 71 North America: Microalgae Market Volume, by Type, 2023–2035 (Tons)
Table 72 North America: Microalgae Market Size, by Production Technique, 2023–2035 (USD Million)
Table 73 North America: Photobioreactors Market Size, by Type, 2023–2035 (USD Million)
Table 74 North America: Microalgae Market Size, by Distribution Channel, 2023–2035 (USD Million)
Table 75 North America: Microalgae Market Size, by Application, 2023–2035 (USD Million)
Table 76 North America: Microalgae Market Size for Animal Nutrition, by Type, 2023–2035 (USD Million)
Table 77 U.S.: Microalgae Market Size, by Type, 2023–2035 (USD Million)
Table 78 U.S.: Microalgae Market Volume, by Type, 2023–2035 (Tons)
Table 79 U.S.: Microalgae Market Size, by Production Technique, 2023–2035 (USD Million)
Table 80 U.S.: Photobioreactors Market Size, by Type, 2023–2035 (USD Million)
Table 81 U.S.: Microalgae Market Size, by Distribution Channel, 2023–2035 (USD Million)
Table 82 U.S.: Microalgae Market Size, by Application, 2023–2035 (USD Million)
Table 83 U.S.: Microalgae Market Size for Animal Nutrition, by Type, 2023–2035 (USD Million)
Table 84 Canada: Microalgae Market Size, by Type, 2023–2035 (USD Million)
Table 85 Canada: Microalgae Market Volume, by Type, 2023–2035 (Tons)
Table 86 Canada: Microalgae Market Size, by Production Technique, 2023–2035 (USD Million)
Table 87 Canada: Photobioreactors Market Size, by Type, 2023–2035 (USD Million)
Table 88 Canada: Microalgae Market Size, by Distribution Channel, 2023–2035 (USD Million)
Table 89 Canada: Microalgae Market Size, by Application, 2023–2035 (USD Million)
Table 90 Canada: Microalgae Market Size for Animal Nutrition, by Type, 2023–2035 (USD Million)
Table 91 Key Buyers of Spirulina in Europe
Table 92 Europe: Microalgae Market Size, by Country/Region, 2023–2035 (USD Million)
Table 93 Europe: Microalgae Market Volume, by Country/Region, 2023–2035 (Tons)
Table 94 Europe: Microalgae Market Size, by Type, 2023–2035 (USD Million)
Table 95 Europe: Microalgae Market Volume, by Type, 2023–2035 (Tons)
Table 96 Europe: Microalgae Market Size, by Production Technique, 2023–2035 (USD Million)
Table 97 Europe: Photobioreactors Market Size, by Type, 2023–2035 (USD Million)
Table 98 Europe: Microalgae Market Size, by Distribution Channel, 2023–2035 (USD Million)
Table 99 Europe: Microalgae Market Size, by Application, 2023–2035 (USD Million)
Table 100 Europe: Microalgae Market Size for Animal Nutrition, by Type, 2023–2035 (USD Million)
Table 101 Germany: Microalgae Market Size, by Type, 2023–2035 (USD Million)
Table 102 Germany: Microalgae Market Volume, by Type, 2023–2035 (Tons)
Table 103 Germany: Microalgae Market Size, by Production Technique, 2023–2035 (USD Million)
Table 104 Germany: Photobioreactors Market Size, by Type, 2023–2035 (USD Million)
Table 105 Germany: Microalgae Market Size, by Distribution Channel, 2023–2035 (USD Million)
Table 106 Germany: Microalgae Market Size, by Application, 2023–2035 (USD Million)
Table 107 Germany: Microalgae Market Size for Animal Nutrition, by Type, 2023–2035 (USD Million)
Table 108 France: Microalgae Market Size, by Type, 2023–2035 (USD Million)
Table 109 France: Microalgae Market Volume, by Type, 2023–2035 (Tons)
Table 110 France: Microalgae Market Size, by Production Technique, 2023–2035 (USD Million)
Table 111 France: Photobioreactors Market Size, by Type, 2023–2035 (USD Million)
Table 112 France: Microalgae Market Size, by Distribution Channel, 2023–2035 (USD Million)
Table 113 France: Microalgae Market Size, by Application, 2023–2035 (USD Million)
Table 114 France: Microalgae Market Size for Animal Nutrition, by Type, 2023–2035 (USD Million)
Table 115 U.K.: Microalgae Market Size, by Type, 2023–2035 (USD Million)
Table 116 U.K.: Microalgae Market Volume, by Type, 2023–2035 (Tons)
Table 117 U.K.: Microalgae Market Size, by Production Technique, 2023–2035 (USD Million)
Table 118 U.K.: Photobioreactors Market Size, by Type, 2023–2035 (USD Million)
Table 119 U.K.: Microalgae Market Size, by Distribution Channel, 2023–2035 (USD Million)
Table 120 U.K.: Microalgae Market Size, by Application, 2023–2035 (USD Million)
Table 121 U.K.: Microalgae Market Size for Animal Nutrition, by Type, 2023–2035 (USD Million)
Table 122 Italy: Microalgae Market Size, by Type, 2023–2035 (USD Million)
Table 123 Italy: Microalgae Market Volume, by Type, 2023–2035 (Tons)
Table 124 Italy: Microalgae Market Size, by Production Technique, 2023–2035 (USD Million)
Table 125 Italy: Photobioreactors Market Size, by Type, 2023–2035 (USD Million)
Table 126 Italy: Microalgae Market Size, by Distribution Channel, 2023–2035 (USD Million)
Table 127 Italy: Microalgae Market Size, by Application, 2023–2035 (USD Million)
Table 128 Italy: Microalgae Market Size for Animal Nutrition, by Type, 2023–2035 (USD Million)
Table 129 Spain: Microalgae Market Size, by Type, 2023–2035 (USD Million)
Table 130 Spain: Microalgae Market Volume, by Type, 2023–2035 (Tons)
Table 131 Spain: Microalgae Market Size, by Production Technique, 2023–2035 (USD Million)
Table 132 Spain: Photobioreactors Market Size, by Type, 2023–2035 (USD Million)
Table 133 Spain: Microalgae Market Size, by Distribution Channel, 2023–2035 (USD Million)
Table 134 Spain: Microalgae Market Size, by Application, 2023–2035 (USD Million)
Table 135 Spain: Microalgae Market Size for Animal Nutrition, by Type, 2023–2035 (USD Million)
Table 136 Roe: Microalgae Market Size, by Type, 2023–2035 (USD Million)
Table 137 Roe: Microalgae Market Volume, by Type, 2023–2035 (Tons)
Table 138 Roe: Microalgae Market Size, by Production Technique, 2023–2035 (USD Million)
Table 139 Roe: Photobioreactors Market Size, by Type, 2023–2035 (USD Million)
Table 140 Roe: Microalgae Market Size, by Distribution Channel, 2023–2035 | (USD Million)
Table 141 Roe: Microalgae Market Size, by Application, 2023–2035 (USD Million)
Table 142 Roe: Microalgae Market Size for Animal Nutrition, by Type, 2023–2035 (USD Million)
Table 143 Some of the Key Buyers of Spirulina in Asia-Pacific
Table 144 Asia-Pacific: Microalgae Market Size, by Country/Region, 2023–2035 (USD Million)
Table 145 Asia-Pacific: Microalgae Market Volume, by Country/Region, 2023–2035 (Tons)
Table 146 Asia-Pacific: Microalgae Market Size, by Type, 2023–2035 (USD Million)
Table 147 Asia-Pacific: Microalgae Market Volume, by Type, 2023–2035 (Tons)
Table 148 Asia-Pacific: Microalgae Market Size, by Production Technique, 2023–2035 (USD Million)
Table 149 Asia-Pacific: Photobioreactors Market Size, by Type, 2023–2035 (USD Million)
Table 150 Asia-Pacific: Microalgae Market Size, by Distribution Channel, 2023–2035 (USD Million)
Table 151 Asia-Pacific: Microalgae Market Size, by Application, 2023–2035 (USD Million)
Table 152 Asia-Pacific: Microalgae Market Size for Animal Nutrition, by Type, 2023–2035 (USD Million)
Table 153 China: Microalgae Market Size, by Type, 2023–2035 (USD Million)
Table 154 China: Microalgae Market Volume, by Type, 2023–2035 (Tons)
Table 155 China: Microalgae Market Size, by Production Technique, 2023–2035 (USD Million)
Table 156 China: Photobioreactors Market Size, by Type, 2023–2035 (USD Million)
Table 157 China: Microalgae Market Size, by Distribution Channel, 2023–2035 (USD Million)
Table 158 China: Microalgae Market Size, by Application, 2023–2035 (USD Million)
Table 159 China: Microalgae Market Size for Animal Nutrition, by Type, 2023–2035 (USD Million)
Table 160 India: Microalgae Market Size, by Type, 2023–2035 (USD Million)
Table 161 India: Microalgae Market Volume, by Type, 2023–2035 (Tons)
Table 162 India: Microalgae Market Size, by Production Technique, 2023–2035 (USD Million)
Table 163 India: Photobioreactors Market Size, by Type, 2023–2035 (USD Million)
Table 164 India: Microalgae Market Size, by Distribution Channel, 2023–2035 (USD Million)
Table 165 India: Microalgae Market Size, by Application, 2023–2035 (USD Million)
Table 166 India: Microalgae Market Size for Animal Nutrition, by Type, 2023–2035 (USD Million)
Table 167 Japan: Microalgae Market Size, by Type, 2023–2035 (USD Million)
Table 168 Japan: Microalgae Market Volume, by Type, 2023–2035 (Tons)
Table 169 Japan: Microalgae Market Size, by Production Technique, 2023–2035 (USD Million)
Table 170 Japan: Photobioreactors Market Size, by Type, 2023–2035 (USD Million)
Table 171 Japan: Microalgae Market Size, by Distribution Channel, 2023–2035 (USD Million)
Table 172 Japan: Microalgae Market Size, by Application, 2023–2035 (USD Million)
Table 173 Japan: Microalgae Market Size for Animal Nutrition, by Type, 2023–2035 (USD Million)
Table 174 Australia: Microalgae Market Size, by Type, 2023–2035 (USD Million)
Table 175 Australia: Microalgae Market Volume, by Type, 2023–2035 (Tons)
Table 176 Australia: Microalgae Market Size, by Production Technique, 2023–2035 (USD Million)
Table 177 Australia: Photobioreactors Market Size, by Type, 2023–2035 (USD Million)
Table 178 Australia: Microalgae Market Size, by Distribution Channel, 2023–2035 (USD Million)
Table 179 Australia: Microalgae Market Size, by Application, 2023–2035 (USD Million)
Table 180 Australia: Microalgae Market Size for Animal Nutrition, by Type, 2023–2035 (USD Million)
Table 181 RoAPAC: Microalgae Market Size, by Type, 2023–2035 (USD Million)
Table 182 RoAPAC: Microalgae Market Volume, by Type, 2023–2035 (Tons)
Table 183 RoAPAC: Microalgae Market Size, by Production Technique, 2023–2035 (USD Million)
Table 184 RoAPAC: Photobioreactors Market Size, by Type, 2023–2035 (USD Million)
Table 185 RoAPAC: Microalgae Market Size, by Distribution Channel, 2023–2035 (USD Million)
Table 186 RoAPAC: Microalgae Market Size, by Application, 2023–2035 (USD Million)
Table 187 RoAPAC: Microalgae Market Size for Animal Nutrition, by Type, 2023–2035 (USD Million)
Table 188 Latin America: Microalgae Market Size, by Country/Region, 2023–2035 (USD Million)
Table 189 Latin America: Microalgae Market Volume, by Country/Region, 2023–2035 (Tons)
Table 190 Latin America: Microalgae Market Size, by Type, 2023–2035 (USD Million)
Table 191 Latin America: Microalgae Market Volume, by Type, 2023–2035 (Tons)
Table 192 Latin America: Microalgae Market Size, by Production Technique, 2023–2035 (USD Million)
Table 193 Latin America: Photobioreactors Market Size, by Type, 2023–2035 (USD Million)
Table 194 Latin America: Microalgae Market Size, by Distribution Channel, 2023–2035 (USD Million)
Table 195 Latin America: Microalgae Market Size, by Application, 2023–2035 (USD Million)
Table 196 Latin America: Microalgae Market Size for Animal Nutrition, by Type, 2023–2035 (USD Million)
Table 197 Brazil: Microalgae Market Size, by Type, 2023–2035 (USD Million)
Table 198 Brazil: Microalgae Market Volume, by Type, 2023–2035 (Tons)
Table 199 Brazil: Microalgae Market Size, by Production Technique, 2023–2035 (USD Million)
Table 200 Brazil: Photobioreactors Market Size, by Type, 2023–2035 (USD Million)
Table 201 Brazil: Microalgae Market Size, by Distribution Channel, 2023–2035 (USD Million)
Table 202 Brazil: Microalgae Market Size, by Application, 2023–2035 (USD Million)
Table 203 Brazil: Microalgae Market Size for Animal Nutrition, by Type, 2023–2035 (USD Million)
Table 204 Mexico: Microalgae Market Size, by Type, 2023–2035 (USD Million)
Table 205 Mexico: Microalgae Market Volume, by Type, 2023–2035 (Tons)
Table 206 Mexico: Microalgae Market Size, by Production Technique, 2023–2035 (USD Million)
Table 207 Mexico: Photobioreactors Market Size, by Type, 2023–2035 (USD Million)
Table 208 Mexico: Microalgae Market Size, by Distribution Channel, 2023–2035 (USD Million)
Table 209 Mexico: Microalgae Market Size, by Application, 2023–2035 (USD Million)
Table 210 Mexico: Microalgae Market Size for Animal Nutrition, by Type, 2023–2035 (USD Million)
Table 211 RoLATAM: Microalgae Market Size, by Type, 2023–2035 (USD Million)
Table 212 RoLATAM: Microalgae Market Volume, by Type, 2023–2035 (Tons)
Table 213 RoLATAM: Microalgae Market Size, by Production Technique, 2023–2035 (USD Million)
Table 214 RoLATAM: Photobioreactors Market Size, by Type, 2023–2035 (USD Million)
Table 215 RoLATAM: Microalgae Market Size, by Distribution Channel, 2023–2035 (USD Million)
Table 216 RoLATAM: Microalgae Market Size, by Application, 2023–2035 (USD Million)
Table 217 RoLATAM: Microalgae Market Size for Animal Nutrition, by Type, 2023–2035 (USD Million)
Table 218 Middle East & Africa: Microalgae Market Size, by Country/Region, 2023–2035 (USD Million)
Table 219 Middle East & Africa: Microalgae Market Volume, by Country/Region, 2023–2035 (Tons)
Table 220 Middle East & Africa: Microalgae Market Size, by Type, 2023–2035 (USD Million)
Table 221 Middle East & Africa: Microalgae Market Volume, by Type, 2023–2035 (Tons)
Table 222 Middle East & Africa: Microalgae Market Size, by Production Technique, 2023–2035 (USD Million)
Table 223 Middle East & Africa: Photobioreactors Market Size, by Type, 2023–2035 (USD Million)
Table 224 Middle East & Africa: Microalgae Market Size, by Distribution Channel, 2023–2035 (USD Million)
Table 225 Middle East & Africa: Microalgae Market Size, by Application, 2023–2035 (USD Million)
Table 226 Middle East & Africa: Microalgae Market Size for Animal Nutrition, by Type, 2023–2035 (USD Million)
Table 227 Egypt: Microalgae Market Size, by Type, 2023–2035 (USD Million)
Table 228 Egypt: Microalgae Market Volume, by Type, 2023–2035 (Tons)
Table 229 Egypt: Microalgae Market Size, by Production Technique, 2023–2035 (USD Million)
Table 230 Egypt: Photobioreactors Market Size, by Type, 2023–2035 (USD Million)
Table 231 Egypt: Microalgae Market Size, by Distribution Channel, 2023–2035 (USD Million)
Table 232 Egypt: Microalgae Market Size, by Application, 2023–2035 (USD Million)
Table 233 Egypt: Microalgae Market Size for Animal Nutrition, by Type, 2023–2035 (USD Million)
Table 234 Saudi Arabia: Microalgae Market Size, by Type, 2023–2035 (USD Million)
Table 235 Saudi Arabia: Microalgae Market Volume, by Type, 2023–2035 (Tons)
Table 236 Saudi Arabia: Microalgae Market Size, by Production Technique, 2023–2035 (USD Million)
Table 237 Saudi Arabia: Photobioreactors Market Size, by Type, 2023–2035 (USD Million)
Table 238 Saudi Arabia: Microalgae Market Size, by Distribution Channel, 2023–2035 (USD Million)
Table 239 Saudi Arabia: Microalgae Market Size, by Application, 2023–2035 (USD Million)
Table 240 Saudi Arabia: Microalgae Market Size for Animal Nutrition, by Type, 2023–2035 (USD Million)
Table 241 South Africa: Microalgae Market Size, by Type, 2023–2035 (USD Million)
Table 242 South Africa: Microalgae Market Volume, by Type, 2023–2035 (Tons)
Table 243 South Africa: Microalgae Market Size, by Production Technique, 2023–2035 (USD Million)
Table 244 South Africa: Photobioreactors Market Size, by Type, 2023–2035 (USD Million)
Table 245 South Africa: Microalgae Market Size, by Distribution Channel, 2023–2035 (USD Million)
Table 246 South Africa: Microalgae Market Size, by Application, 2023–2035 (USD Million)
Table 247 South Africa: Microalgae Market Size for Animal Nutrition, by Type, 2023–2035 (USD Million)
Table 248 UAE: Microalgae Market Size, by Type, 2023–2035 (USD Million)
Table 249 UAE: Microalgae Market Volume, by Type, 2023–2035 (Tons)
Table 250 UAE: Microalgae Market Size, by Production Technique, 2023–2035 (USD Million)
Table 251 UAE: Photobioreactors Market Size, by Type, 2023–2035 (USD Million)
Table 252 UAE: Microalgae Market Size, by Distribution Channel, 2023–2035 (USD Million)
Table 253 UAE: Microalgae Market Size, by Application, 2023–2035 (USD Million)
Table 254 UAE: Microalgae Market Size for Animal Nutrition, by Type, 2023–2035 (USD Million)
Table 255 RoMEA: Microalgae Market Size, by Type, 2023–2035 (USD Million)
Table 256 RoMEA: Microalgae Market Volume, by Type, 2023–2035 (Tons)
Table 257 RoMEA: Microalgae Market Size, by Production Technique, 2023–2035 (USD Million)
Table 258 RoMEA: Photobioreactors Market Size, by Type, 2023–2035 (USD Million)
Table 259 RoMEA: Microalgae Market Size, by Distribution Channel, 2023–2035 (USD Million)
Table 260 RoMEA: Microalgae Market Size, by Application, 2023–2035 (USD Million)
Table 261 RoMEA: Microalgae Market Size for Animal Nutrition, by Type, 2023–2035 (USD Million)
Table 262 Number of Developments from Major Players During 2020–2025
Table 263 Key Strategic Developments, by Company, 2022-2025
List of Figures
Figure 1 Research Process
Figure 2 Key Secondary Sources
Figure 3 Primary Research Techniques
Figure 4 Key Executives Interviewed
Figure 5 Breakdown of Primary Interviews (Supply-Side & Demand-Side)
Figure 6 Market Size Estimation
Figure 7 Spirulina Segment to Dominate the Global Microalgae Market by 2035
Figure 8 Ponds Segment to Dominate the Global Microalgae Market by 2035
Figure 9 Business Channel (B2b) to Dominate the Microalgae Market by 2035
Figure 10 Nutraceuticals Segment to Dominate the Microalgae Market by 2035
Figure 11 North America Dominates the Overall Microalgae Market, While Europe & Apac Leads in Growth
Figure 12 Market Dynamics
Figure 13 the Nutrient Profile of Spirulina Vs. Other Foods
Figure 14 Global Microalgae Market Size, by Type, 2025 Vs. 2035 (USD Million)
Figure 15 Global Microalgae Market Volume, by Type, 2025 Vs. 2035 (Tons)
Figure 16 Global Microalgae Market Size, by Production Technique, 2025 Vs. 2035 (USD Million)
Figure 17 Global Microalgae Market Size, by Distribution Channel, 2025 Vs. 2035 (USD Million)
Figure 18 Business Channel for Microalgae
Figure 19 Consumer Channel for Microalgae
Figure 20 Global Microalgae Market Size, by Application, 2025 Vs. 2035 (USD Million)
Figure 21 Nutraceutical Consumption Patterns Across the Globe
Figure 22 Microalgae Market Size, by Region, 2025 Vs. 2035 (USD Million)
Figure 23 Key Growth Strategies Adopted by Leading Players (2022–2025)
Figure 24 Microalgae Market: Competitive Benchmarking of Key Players, by Type
Figure 25 E.I.D. - Parry (India) Limited: Financial Overview (2024)
Figure 26 Cyanotech Corporation: Financial Overview (2024)
Figure 27 Daesang Corporation: Financial Overview (2024)


Published Date: Jan-2025
Published Date: Apr-2023
Published Date: Jan-2024
Published Date: Feb-2025
Subscribe to get the latest industry updates