Resources
About Us
Spirulina Market Size, Share, Forecast, & Trends Analysis by Product Type (Powder, Tablets, Capsules, Flakes, Phycocyanin, Frozen Spirulina, Spirulina Paste), Production Technique (Ponds), Category, Distribution Channel (B2B, B2C), Application (Nutraceuticals, Food & Beverages, Animal Feed, Cosmetics, Agriculture) - Global Forecast to 2036
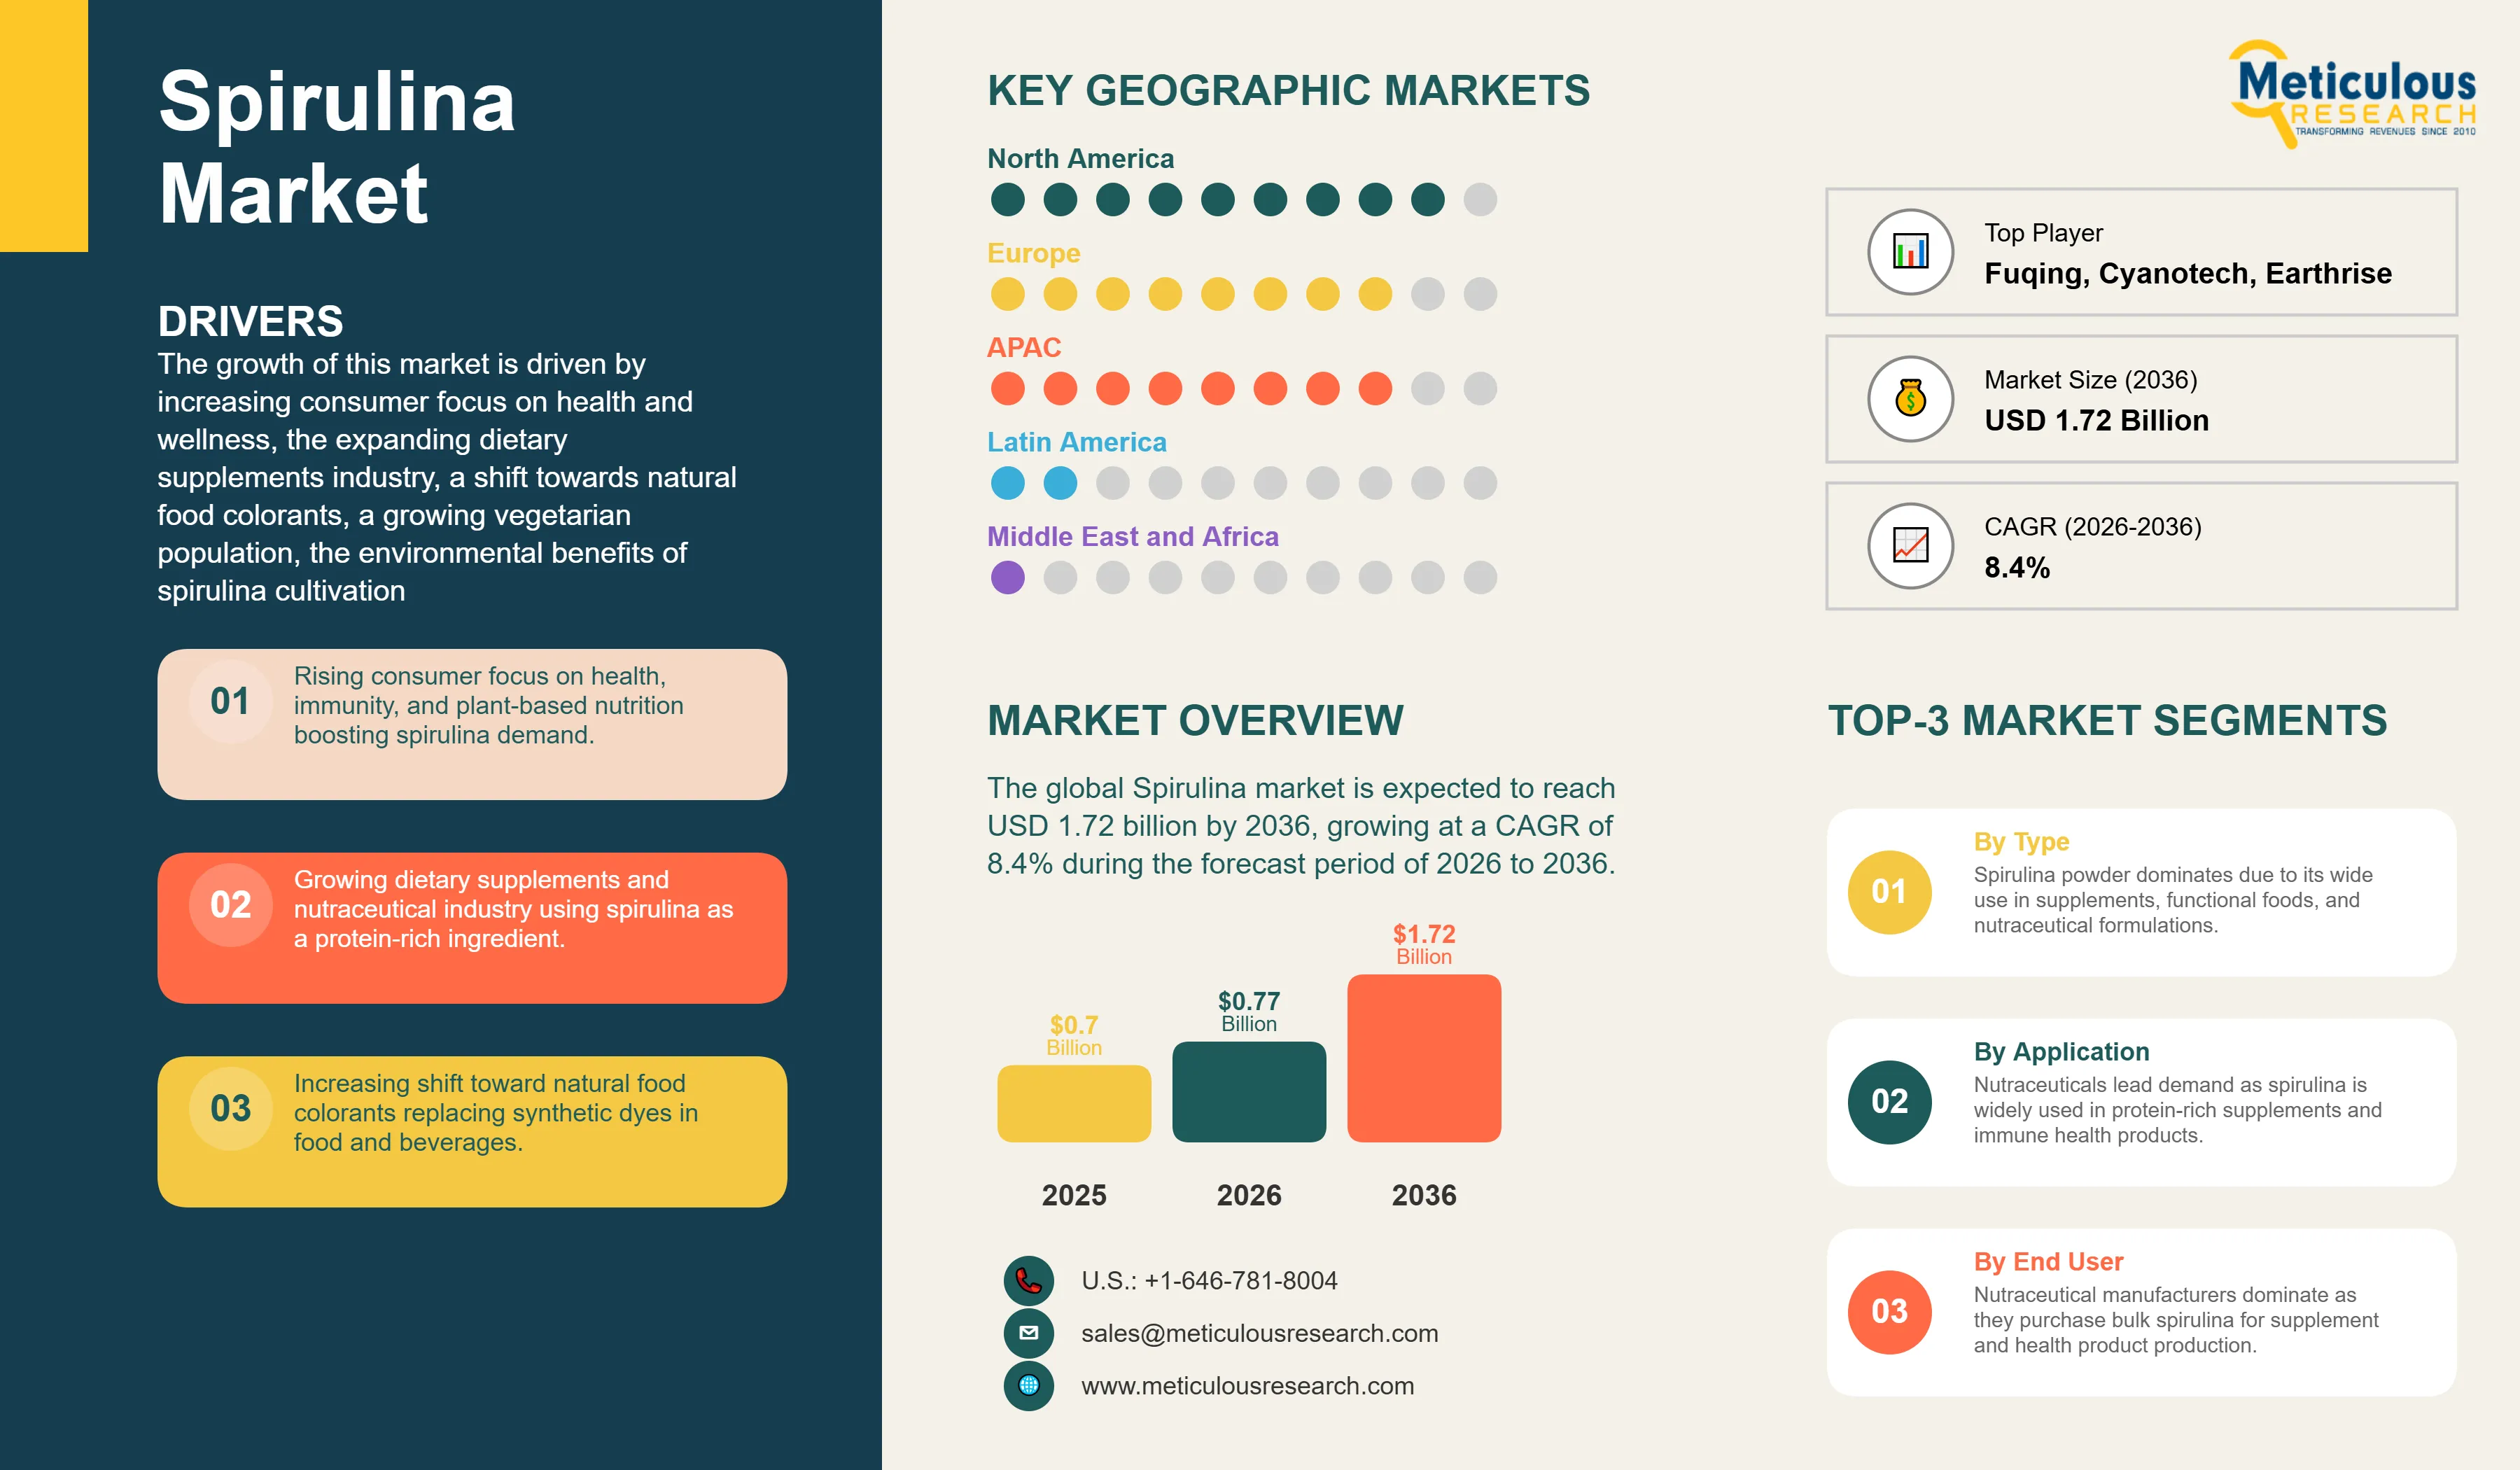
Report ID: MRFB - 104371 Pages: 293 Mar-2026 Formats*: PDF Category: Food and Beverages Delivery: 24 to 48 Hours Download Free Sample ReportThe global Spirulina market was valued at USD 0.70 billion in 2025. This market is expected to reach USD 1.72 billion by 2036 from an estimated USD 0.77 billion in 2026, growing at a CAGR of 8.4% during the forecast period of 2026 to 2036. By volume, this market is expected to reach 1,60,205 tons by 2036 from an estimated 75,455 tons in 2026, growing at a CAGR of 7.8% during the forecast period of 2026 to 2036.
The growth of this market is driven by increasing consumer focus on health and wellness, the expanding dietary supplements industry, a shift towards natural food colorants, a growing vegetarian population, the environmental benefits of spirulina cultivation, strict regulations on the use of synthetic additives, and rising investments by natural color manufacturers in spirulina production. However, this growth is restrained by limited awareness of the benefits of spirulina, production complexities, and contamination risks.
Click here to: Get Free Sample Pages of this Report
Spirulina is a filamentous blue-green microalga (cyanobacterium) belonging to the genus Arthrospira. The two species most widely cultivated commercially are Arthrospira platensis and Arthrospira maxima. Spirulina is recognized for its high nutritional density, containing approximately 55–70% protein on a dry weight basis, making it one of the most protein-rich naturally occurring food ingredients. The protein in spirulina contains all nine essential amino acids and exhibits relatively high digestibility compared to many plant-based protein sources. In addition to protein, spirulina contains significant amounts of beta-carotene (provitamin A), iron, vitamin E, B-complex vitamins, essential fatty acids such as gamma-linolenic acid (GLA), and phycocyanin, a distinctive blue pigment-protein complex that typically accounts for around 10–20% of spirulina dry weight and represents the most commercially valuable component extracted from spirulina.
Spirulina is primarily marketed in powder, tablet, capsule, and flake forms, which are widely used in dietary supplements, functional foods, beverages, animal feed formulations, and cosmetics. In addition, phycocyanin extracts derived from spirulina are increasingly used as natural blue colorants in food and beverage formulations. From a production perspective, open pond (raceway pond) cultivation remains the dominant method globally due to its lower capital cost and suitability for large-scale biomass production. However, closed photobioreactor systems are gaining adoption, particularly for pharmaceutical, nutraceutical, and high-purity food ingredient applications that require stricter contamination control and standardized biochemical composition.
From a regulatory standpoint, spirulina is widely recognized as safe for consumption and has received Generally Recognized as Safe (GRAS) status from the U.S. Food and Drug Administration (FDA) for use in foods and dietary supplements. Spirulina extract and phycocyanin are approved for use as natural colorants in a variety of food and beverage applications in the U.S., while regulatory approvals for spirulina-derived colorants have expanded across several international markets. Spirulina-derived phycocyanin is particularly significant because it provides one of the few commercially scalable sources of natural blue color for food products, a functionality that is increasingly valuable as food manufacturers seek alternatives to synthetic colorants amid growing consumer demand for clean-label ingredients.
FDA Synthetic Dye Phase-Out Creating Unprecedented Demand for Phycocyanin
The April 2025 FDA/HHS announcement to phase out all petroleum-based synthetic food dyes in the U.S. by end-2026 represents the most significant single regulatory catalyst in the history of the spirulina market and is expected to structurally reshape demand for spirulina-derived phycocyanin. Spirulina phycocyanin is the only commercially scalable, naturally derived source of a true vivid blue color approved for food use by both the U.S. FDA and, from 2024, the European Union. The reformulation pressure facing thousands of food and beverage SKUs across confectionery, dairy, beverages, sports nutrition, ice cream, and baked goods markets is driving urgent procurement activity from major food manufacturers seeking phycocyanin as a synthetic blue dye substitute. Sun Chemical's (DIC Group) LINABLUE spirulina extract, which features over 99% solubility and improved heat stability, is among the key commercial formulations being evaluated across this accelerated reformulation wave. The EU's 2024 authorization of phycocyanin as a food colorant further harmonizes global regulatory access to spirulina extract. These converging regulatory developments make phycocyanin the highest-CAGR segment at 27.5% and are a fundamental structural driver of the European spirulina market's 13.7% CAGR throughout the forecast period.
Growing Adoption of Photobioreactor Production Technology
The adoption of advanced photobioreactor (PBR) cultivation technology for spirulina production is an emerging structural trend enabling producers to supply higher-purity, more compositionally consistent, and contaminant-minimized spirulina products suited to the growing premium food-grade, pharmaceutical, and cosmetics markets. Conventional open raceway pond cultivation, while dominant in volume terms, presents challenges including contamination risk, weather-dependent productivity variability, inconsistent phycocyanin content, and climate-dependent production location limitations. Photobioreactor-based production addresses these limitations through enclosed cultivation environments that provide precise control over light, temperature, CO2, pH, and nutrients. Zinzino's November 2025 acquisition of a 35% stake in Xion International Group, emphasizing photobioreactor-grown spirulina for omega-3 and protein supplements, illustrates the growing investor valuation premium for PBR-produced spirulina with controlled nutritional profiles.
The global Spirulina market was valued at USD 0.70 billion in 2025. This market is expected to reach USD 1.72 billion by 2036 from an estimated USD 0.77 billion in 2026, growing at a CAGR of 8.4% during the forecast period of 2026 to 2036. By volume, this market is expected to reach 1,60,205 tons by 2036 from an estimated 75,455 tons in 2026, growing at a CAGR of 7.8% during the forecast period of 2026 to 2036.
|
Report Coverage |
Details |
|
Market Size (Value) by 2036 |
USD 1.72 Billion |
|
Market Size (Volume) by 2036 |
~160,205 Tons |
|
Market Size (Value) in 2025 (Estimated) |
USD 0.70 Billion |
|
Market Size (Value) in 2026 |
USD 0.77 Billion |
|
Market Growth Rate (Value, 2026-2036) |
CAGR of 8.4% |
|
Market Growth Rate (Volume, 2026-2036) |
CAGR of 7.8% |
|
Base Year |
2025 |
|
Forecast Period |
2026 to 2036 |
|
Dominating Region |
North America |
|
Fastest Growing Region |
Europe |
|
Dominating Product Type Segment |
Powder |
|
Fastest Growing Product Type Segment |
Phycocyanin |
|
Dominating Application Segment |
Nutraceuticals |
|
Fastest Growing Application Segment |
Food & Beverages |
|
Dominating Distribution Channel |
Business Channel/B2B |
|
Dominating Production Technique |
Ponds |
|
Dominating Category |
Non-organic |
|
Fastest Growing Category |
Organic |
|
Segments Covered |
By Product Type: Powder; Tablets; Capsules; Flakes; Phycocyanin; Frozen Spirulina; Spirulina Paste | By Production Technique: Ponds; Other Production Techniques | By Category: Non-organic; Organic | By Distribution Channel: Business Channel (B2B); Consumer Channel (B2C) | By Application: Nutraceuticals; Food & Beverages; Animal Feed; Cosmetics; Agriculture |
|
Countries Covered |
North America (U.S., Canada); Europe (France, Germany, U.K., Italy, Spain, Netherlands, Denmark, Sweden, Rest of Europe); Asia-Pacific (China, India, Japan, Australia, Thailand, Rest of Asia-Pacific); Latin America (Brazil, Mexico, Rest of Latin America); Middle East & Africa (Egypt, Saudi Arabia, South Africa, UAE, Rest of Middle East & Africa) |
Powder Dominates; Phycocyanin Registers the Fastest CAGR
Based on product type, the powder segment is poised to dominate the global spirulina market in 2026. The large share of this segment is primarily due to its versatility and suitability as the primary bulk ingredient form for downstream processing by nutraceutical manufacturers, food and beverage producers, animal feed blenders, and cosmetics formulators. Growing demand for spirulina powder among nutraceutical producers, increasing use in food and beverages, the rising trend of veganism, and increasing incorporation of algal ingredients in cosmetic products contribute to the dominance of this product segment.
However, the phycocyanin market is expected to grow at the fastest CAGR of 18.7% during the forecast period 2026-2036. This growth is driven by rising incorporation of phycocyanin into medicinal formulations and functional food products, increasing consumer preference for natural over artificial colorants, heightened demand for natural blue dyes from food and beverage manufacturers, the EU’s 2024 regulatory authorization of phycocyanin as a food colorant, the FDA’s April 2025 phased plan to eliminate synthetic food dyes, and substantial investments from major global color companies including Givaudan and DIC Group in phycocyanin development and commercialization.
Based on production technique, the ponds segment is anticipated to dominate the global spirulina market in 2026. The widespread adoption of pond-based spirulina cultivation is attributed to its operational simplicity, cost-efficiency, low capital investment requirements, minimal energy consumption, and high absolute biomass production volumes. Open raceway ponds enable cultivation at the scale required to meet bulk industrial demand at commercially competitive price points. However, adoption of advanced photobioreactor technology is an emerging trend, enabling controlled production of premium-grade spirulina with consistent composition for high-value food-grade, pharmaceutical, and cosmetics applications.
Based on category, the non-organic spirulina segment is expected to dominate the global spirulina market in 2026, attributed to the lower production costs associated with conventional cultivation methods that generally achieve higher yields and broader geographic availability. The organic spirulina segment, however, will register the fastest CAGR through 2036, driven by expanding demand from food & beverage and cosmetics sectors, growing consumer preference for clean-label organic products, growth in vegetarian/vegan populations, and strategic market access gains like Parry Nutraceuticals' October 2024 EU organic import license.
Based on distribution channel, the business channel (B2B) segment is poised to dominate the global spirulina market in 2026. This is primarily attributed to the large-scale direct procurement of spirulina biomass by downstream industrial manufacturers in nutraceuticals, food & beverages, and animal feed, who purchase bulk spirulina powder, paste, or liquid concentrates for further processing into finished consumer products. The B2B segment is also expected to grow at the fastest CAGR during the forecast period, driven by rising industrial demand from food reformulation (particularly phycocyanin colorant procurement driven by synthetic dye phase-out), expanding animal feed applications, and continuous R&D investment in new biofuel and biorefinery applications.
Nutraceuticals Dominates; Food & Beverages Registers the Fastest CAGR
Based on application, the nutraceuticals segment is projected to dominate the global spirulina market in 2026. Growing consumer awareness of the connection between nutrition and health outcomes, rising health concerns among the aging global population, an increasing preference for natural alternatives to traditional pharmaceutical products, and the well-established global supplement retail market infrastructure are factors contributing to the largest share of this application segment.
The food & beverages segment is poised to grow at the fastest CAGR during the forecast period 2026-2036. This growth is driven by the increasing use of spirulina extract (phycocyanin) as a natural colorant across a broad range of food and beverage product categories, the FDA's April 2025 synthetic dye phase-out plan accelerating product reformulation timelines, the EU's 2024 phycocyanin food colorant authorization, and spirulina's growing appeal as a multi-functional dietary ingredient for functional beverages, fortified foods, and nutritionally enhanced processed products.
North America: Largest Regional Market for Spirulina
North America is poised to account for the largest share of the global spirulina market in 2026, with the U.S. representing by far the largest national market. The largest share of North America is mainly due to its highest per-capita spending on dietary supplements globally, strong consumer awareness of spirulina's health benefits, a mature nutraceutical industry, and growing demand for natural food colorants. According to the Council for Responsible Nutrition (CRN), around 75–77% of U.S. adults use dietary supplements, driving significant demand for algae-based nutrition ingredients such as spirulina. This market is also driven by the presence of the established spirulina producers such as Cyanotech Corporation and DIC Corporation's U.S.-based Earthrise Nutritionals facility, one of the largest commercial spirulina production sites outside Asia. Increasing demand for clean-label ingredients and plant-based nutrition products further continues to drive the adoption of spirulina across the food, beverage, and dietary supplement industries in North America.
Europe: Fastest Growing Region for Spirulina
Europe is expected to grow at the fastest CAGR during the forecast period 2026–2036. The rapid growth of this region is driven by the shift toward natural colorants, increasing emphasis on preventive health and functional food consumption, growing demand for environmentally sustainable food ingredients, and increasing utilization of phycocyanin in health and nutrition applications. According to the European Commission and EFSA regulatory framework, consumer demand for natural additives and clean-label products has significantly increased the adoption of algae-derived ingredients in the food industry. Additionally, the European algae sector has been expanding rapidly, supported by EU initiatives such as the European Commission’s Algae Initiative (2022) aimed at scaling sustainable algae production and strengthening algae-based value chains across the region. Significant investments from major European ingredient companies such as Givaudan SA and other natural color manufacturers are further driving the commercialization of spirulina-derived pigments and functional ingredients.
Asia-Pacific Spirulina Market
Asia-Pacific is anticipated to represent the second-largest regional market for spirulina after North America. The growth pf spirulina market in this region is driven by increasing health and wellness trends, expanding dietary supplement industries, rising demand for natural food colors, and growing preference for spirulina-sourced products. Asia-Pacific also serves as the global production hub for spirulina, with large-scale cultivation facilities benefiting from favorable climatic conditions and lower production costs. China is the world's largest spirulina producer, accounting for a substantial share of global production, with major cultivation clusters in Inner Mongolia, Yunnan, and Fujian provinces. The country hosts numerous large-scale producers such as Jiangshan Comp Spirulina, Yunnan Green A Biological Project, Inner Mongolia Rejuve Biotech, and Zhejiang Binmei Biotechnology. India and Japan are also significant markets within the Asia-Pacific region, driven by growing nutraceutical industries and increasing consumer adoption of functional foods and dietary supplements.
The report provides a competitive analysis based on an assessment of the product portfolios, geographic presence, and key growth strategies adopted by leading players in the spirulina market over the past few years.
The key companies operating in the global spirulina market include DIC Corporation (Japan) and its subsidiary Earthrise Nutritionals LLC (U.S.), E.I.D. – Parry (India) Limited (India), Cyanotech Corporation (U.S.), Far East Bio-Tec Co., Ltd. (Taiwan), Fuqing King Dnarmsa Spirulina Co., Ltd. (China), Zhejiang Binmei Biotechnology Co., Ltd. (China), Yunnan Green A Biological Project Co., Ltd. (China), Jiangshan Comp Spirulina Co., Ltd. (China), Inner Mongolia Rejuve Biotech Co., Ltd. (China), Tianjin Norland Biotech Co., Ltd. (China), Taiwan Chlorella Manufacturing Company (Taiwan), AlgoSource SA (France), Allmicroalgae Natural Products S.A. (Portugal), Necton S.A. (Portugal), BlueBioTech Group (Germany), Aliga Microalgae (Denmark), Roquette Klötze GmbH & Co. KG (Germany), Vedan Biotechnology Corporation (Taiwan), and C.B.N. Bio-Engineering Co., Ltd. (China).
Spirulina Market Assessment — by Product Type
• Powder
• Tablets
• Capsules
• Flakes
• Phycocyanin (Spirulina Extract)
• Frozen Spirulina
• Spirulina Paste
Spirulina Market Assessment — by Production Technique
• Open Pond Cultivation
• Photobioreactor Cultivation
• Other Production Techniques
Spirulina Market Assessment — by Category
• Conventional (Non-organic)
• Organic
Spirulina Market Assessment — by Distribution Channel
• Business Channel (B2B)
• Consumer Channel (B2C)
Spirulina Market Assessment — by Application
• Nutraceuticals
• Food & Beverages
• Animal Feed
• Cosmetics & Personal Care
• Agriculture
Spirulina Market Assessment — by Geography
North America
• U.S.
• Canada
Europe
• France
• Germany
• U.K.
• Italy
• Spain
• Netherlands
• Denmark
• Sweden
• Rest of Europe
Asia-Pacific
• China
• India
• Japan
• Australia
• Thailand
• Rest of Asia-Pacific
Latin America
• Brazil
• Mexico
• Rest of Latin America
Middle East & Africa
• Egypt
• Saudi Arabia
• South Africa
• UAE
• Rest of Middle East & Africa
This report analyzes the global spirulina market based on product type, production technique, category, distribution channel, application, and geography. It provides value and volume market estimates for product type and geography segments and value-based insights for other segments.
What is the size of the spirulina market, and at what CAGR is it projected to grow during 2026–2036?
The global spirulina market was valued at USD 0.70 billion in 2025 and is estimated to reach USD 0.77 billion in 2026. The market is projected to reach USD 1.72 billion by 2036, growing at a CAGR of 8.4% during the forecast period of 2026–2036.
In terms of volume, the market is projected to reach 160,205 tons by 2036 from 75,455 tons in 2026, growing at a CAGR of 7.8%.
Based on product type, the powder segment is expected to account for the largest share of the spirulina market in 2026 due to its widespread use in dietary supplements, functional foods, and animal feed products.
The food & beverages segment is projected to register the highest growth during the forecast period, driven by the increasing use of spirulina-derived phycocyanin as a natural blue colorant and growing demand for clean-label ingredients.
The growth of this market is driven by the rising demand for natural food colorants, growing consumer focus on health and wellness, expanding dietary supplements industry, increasing plant-based protein consumption, and the environmental benefits of spirulina cultivation.
The key players operating in the spirulina market include DIC Corporation (Japan), E.I.D. – Parry (India) Limited (India), Cyanotech Corporation (U.S.), Far East Bio-Tec Co., Ltd. (Taiwan), Fuqing King Dnarmsa Spirulina Co., Ltd. (China), Zhejiang Binmei Biotechnology Co., Ltd. (China), Yunnan Green A Biological Project Co., Ltd. (China), Inner Mongolia Rejuve Biotech Co., Ltd. (China), AlgoSource SA (France), Allmicroalgae Natural Products S.A. (Portugal), and Necton S.A. (Portugal).
Europe is expected to register strong growth during the forecast period due to increasing demand for natural food colorants and clean-label ingredients. Asia-Pacific, particularly China, India, and Japan, also offers significant growth opportunities driven by expanding nutraceutical and functional food markets.


Published Date: Jun-2025
Published Date: Jan-2025
Published Date: Jan-2025
Published Date: Apr-2023
Published Date: Jan-2024
Please enter your corporate email id here to view sample report.
Subscribe to get the latest industry updates