Resources
About Us
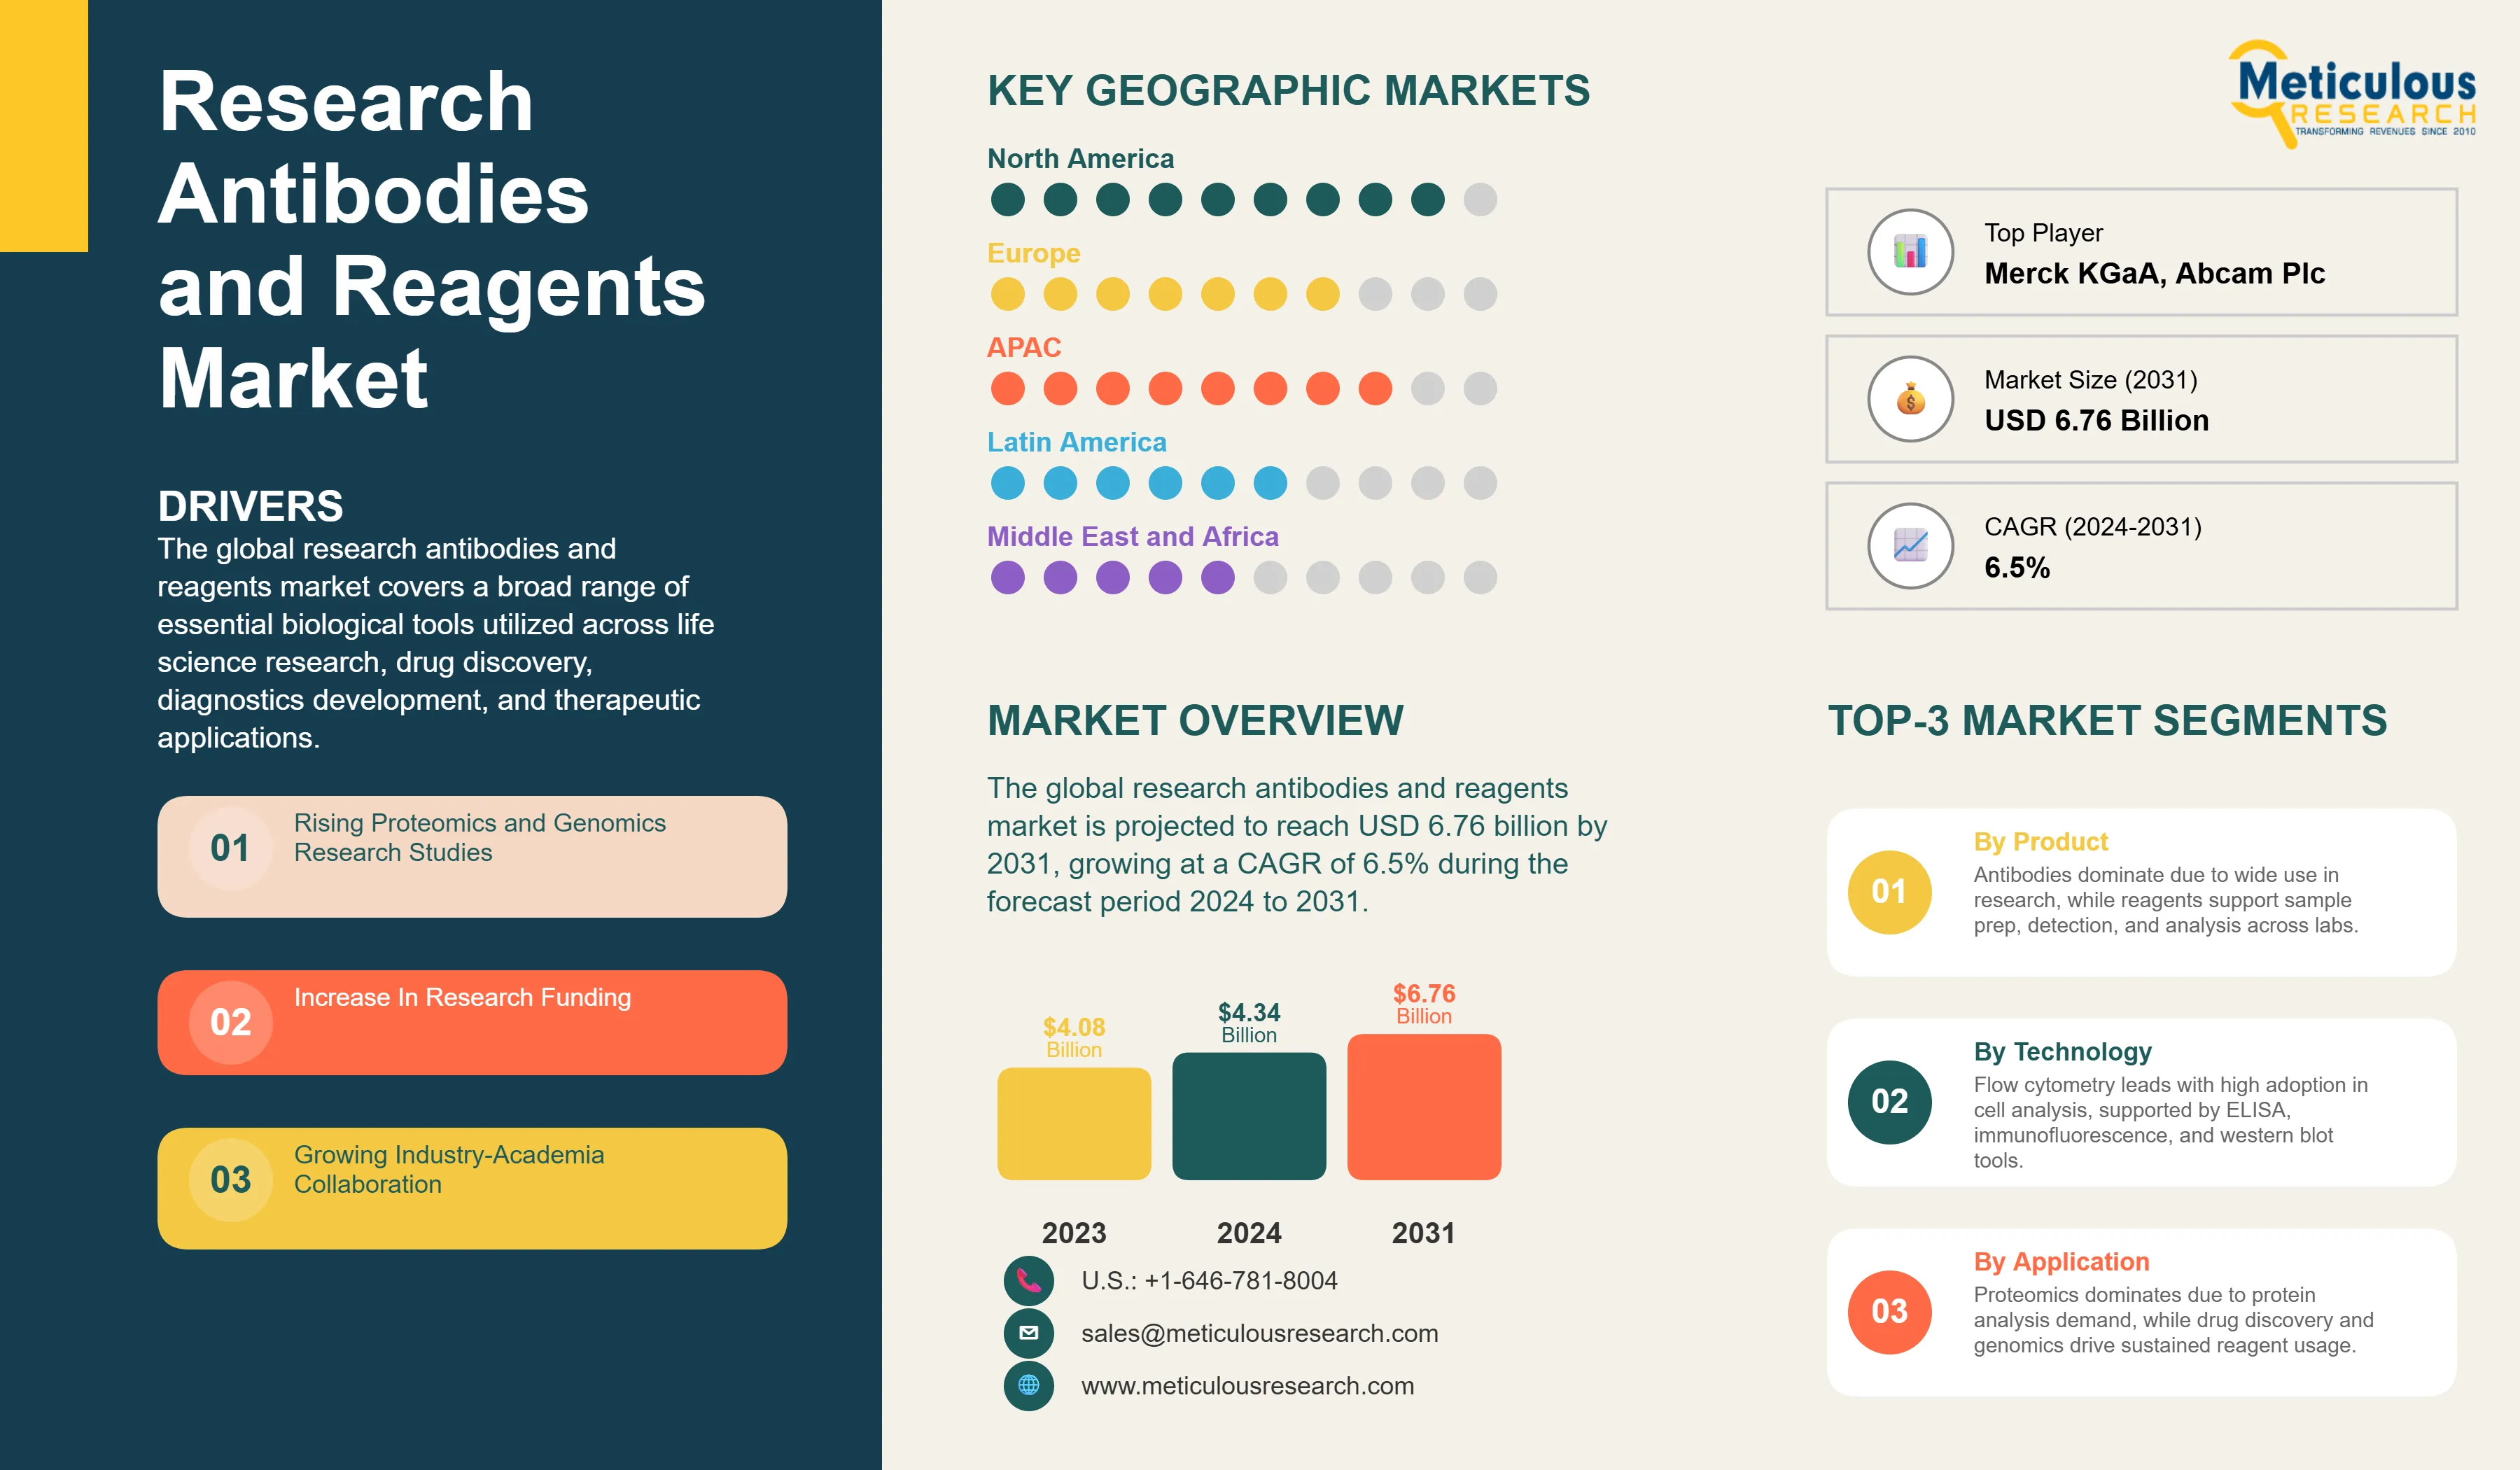
The global research antibodies and reagents market was valued at USD 4.34 billion in 2024 and is projected to reach USD 6.76 billion by 2031, growing at a CAGR of 6.5% during the forecast period 2024 to 2031.
 Click here to: Get Free Sample Pages of this Report
The global research antibodies and reagents market covers a broad range of essential biological tools utilized across life science research, drug discovery, diagnostics development, and therapeutic applications. The product portfolio includes primary and secondary antibodies, monoclonal antibodies, polyclonal antibodies, recombinant antibodies, immunoassay reagents, western blotting reagents, flow cytometry reagents, immunohistochemistry reagents, and other specialized biochemical compounds that allow researchers to detect, quantify, and analyze specific proteins, antigens, and biological molecules.
Research antibodies serve as foundational components across a variety of established laboratory techniques including enzyme linked immunosorbent assay, immunofluorescence, immunoprecipitation, and protein purification, and they continue to support fundamental research across genomics, proteomics, cell biology, immunology, and neuroscience. The market spans applications ranging from basic research and translational medicine to biomarker discovery, target validation, and the development of novel diagnostics and therapeutics, collectively making these biological tools indispensable to advancing both scientific knowledge and medical innovation.
The growth of the overall market for research antibodies and reagents is primarily driven by the rapid expansion of proteomics and genomics research, supported by technological advancements such as next generation sequencing and high throughput analytical techniques. These developments have significantly increased the demand for highly specific and reliable antibodies across applications such as biomarker discovery, drug development, and precision medicine. Rising global R&D funding from government bodies as well as pharmaceutical and biotechnology companies has further strengthened research infrastructure and accelerated innovation across this sector.
Increasing industry academia collaborations are also enhancing access to advanced technologies, novel drug targets, and specialized expertise, while improving the commercialization of research outcomes. Additionally, the growing pipeline of biopharmaceuticals, including complex antibody based therapeutics, is increasing the consumption of research reagents across all stages of drug discovery and development.
However, market growth is partially constrained by the high cost and long development timelines associated with antibody discovery and validation, along with persistent challenges related to the quality, reproducibility, and stability of research antibodies. On the other hand, expanding applications of antibodies in clinical research, biomarker identification, and personalized medicine particularly in oncology, immunology, and cell and gene therapy are creating substantial growth opportunities for market participants.
Major trends shaping this industry include the ongoing shift toward recombinant antibodies, the emergence of multiomics workflows, and the adoption of artificial intelligence driven antibody discovery platforms. These trends are expected to improve research efficiency, enhance reliability, and sustain long term growth within the global research antibodies and reagents market.
Shift Toward Recombinant Antibodies Improving Reproducibility and Standardization Across Research Settings
One of the most significant transitions shaping the research antibodies and reagents market is the progressive shift from conventional polyclonal and animal derived monoclonal antibodies toward recombinant antibodies. Recombinant antibodies are prepared using defined genetic sequences, which ensures batch to batch consistency and eliminates the variability that has historically been a major challenge in research reproducibility. This transition is gaining momentum across pharmaceutical companies, contract research organizations, and academic institutes that require high specificity and reliable performance across repeated experimental cycles.
The increasing publication of studies highlighting the reproducibility crisis in life sciences research has further accelerated the adoption of recombinant antibody formats, as research institutions and funding bodies are placing greater emphasis on validated and standardized reagent use. Leading market participants are responding by expanding their recombinant antibody portfolios and investing in platform technologies that enable faster and more scalable production of these products.
This trend is expected to reshape the competitive landscape of the global research antibodies and reagents market over the coming years, with recombinant formats progressively capturing a larger share of both primary and secondary antibody applications.
Artificial Intelligence Driven Antibody Discovery Accelerating Development Timelines and Expanding Target Space
The integration of artificial intelligence and machine learning into antibody discovery workflows is emerging as a transformative trend with the potential to significantly compress development timelines, reduce costs, and expand the range of druggable and researchable protein targets. AI based computational platforms are being applied to predict antibody binding affinities, optimize sequence designs, and identify novel epitopes that would be difficult to target through conventional immunization based approaches.
Pharmaceutical and biotechnology companies are increasingly partnering with AI focused biotechnology firms to integrate these capabilities into their antibody discovery pipelines, creating synergies between computational biology and experimental validation workflows. This convergence is also driving demand for highly specialized research reagents that support the wet laboratory validation of computationally generated antibody candidates, creating downstream opportunities across multiple product segments within the research antibodies and reagents market.
The long term impact of AI integration is expected to extend beyond discovery efficiency, influencing how antibodies are characterized, validated, and deployed in both research and translational medicine contexts.
Multiomics Workflows Driving Demand for Multiplexed and High Parameter Antibody Based Reagents
The growing adoption of multiomics approaches that combine proteomic, genomic, transcriptomic, and metabolomic data is creating new demand for antibody based reagents capable of simultaneously measuring large numbers of analytes from limited biological samples. Technologies such as high parameter spectral flow cytometry, mass cytometry, and multiplexed immunohistochemistry are enabling researchers to generate far richer biological datasets from individual experiments, fundamentally changing how antibodies and associated reagents are used in both discovery and translational research.
This trend is particularly impactful in oncology, immunology, and cell and gene therapy research, where understanding complex biological interactions across multiple molecular layers is essential for advancing therapeutic development. The demand for validated antibody panels, specialized buffers, staining reagents, and detection chemistries compatible with multiplexed workflows is rising substantially, providing a strong commercial growth vector for suppliers operating across the research antibodies and reagents value chain.
|
Parameters |
Details |
|
Market Size by 2031 |
USD 6.76 Billion |
|
Market Size in 2024 |
USD 4.34 Billion |
|
Revenue Growth Rate (2024 to 2031) |
CAGR of 6.5% |
|
Dominating Product |
Antibodies |
|
Fastest Growing Technology |
Flow Cytometry |
|
Dominating Technology |
Flow Cytometry |
|
Dominating Application |
Proteomics |
|
Dominating End User |
Pharmaceutical & Biotechnology Companies |
|
Dominating Geography |
North America |
|
Fastest Growing Geography |
Asia Pacific |
|
Base Year |
2024 |
|
Forecast Period |
2024 to 2031 |
By Product: In 2024, the Antibodies Segment to Dominate the Global Research Antibodies and Reagents Market
Based on product, the global research antibodies and reagents market is segmented into antibodies and reagents. The antibodies segment is further sub-segmented by type into primary antibodies and secondary antibodies; by production into monoclonal antibodies, polyclonal antibodies, and recombinant antibodies; by source into mouse, rabbit, and other sources; and by research area into oncology, infectious diseases, cardiology, immunology, neurology, stem cell research, and other research areas.
In 2024, the antibodies segment accounted for the largest share of the global research antibodies and reagents market. The large share of this segment reflects the growing application of antibodies in medicine and biomedical research for the purposes of diagnosis, drug development, and disease treatment. The increasing volume of proteomics and genomics based research programs, rising R&D funding across the public and private sectors, and the growing need for disease specific biomarkers are collectively expanding the utilization of research antibodies across a broad range of experimental platforms.
The reagents segment, which includes sample preparation reagents such as media and serum, stains and dyes, probes, buffers, and solvents, as well as antibody production reagents including enzymes and proteins, continues to serve as a critical enabling category across virtually all research antibody workflows. Growing laboratory throughput requirements and the expansion of multiomics workflows are expected to support consistent demand growth within the reagents segment throughout the forecast period.
By Technology: In 2024, the Flow Cytometry Segment to Hold the Largest Share
Based on technology, the global research antibodies and reagents market is segmented into flow cytometry, immunofluorescence, enzyme linked immunosorbent assay, multiplex immunosorbent assay, western blot, immunohistochemistry, immunoprecipitation, and other technologies.
In 2024, the flow cytometry segment accounted for the largest share of the global research antibodies and reagents market. The largest share of this segment is primarily attributed to increasing research activities in proteomics and cell based research conducted by universities and by pharmaceutical and biotechnology companies. The availability of a wide range of antibody specific fluorescent tags and the rapid adoption of high parameter spectral flow cytometry platforms are further contributing to the expansion of this segment. As more research institutions invest in next generation cytometry instrumentation, demand for highly specific, validated antibody panels and associated reagents compatible with these platforms continues to grow at an accelerated pace.
By Application: In 2024, the Proteomics Segment to Hold the Largest Share
Based on application, the global research antibodies and reagents market is segmented into proteomics, drug discovery and development, and genomics.
In 2024, the proteomics segment accounted for the largest share of the global research antibodies and reagents market. The large share of this segment is driven by the rising uptake of research antibodies within the significantly expanding global proteomics research landscape. The upsurge in proteomic research activity is attributed to the rising need for designing more effective drugs through protein based disease profiling, growing demand for personalized and protein therapeutics, and increasing public and private sector spending on proteomic research programs.
Drug discovery and development represent another important application segment, driven by the high consumption of research antibodies and reagents across target identification, lead validation, preclinical characterization, and biomarker development workflows. The expanding biopharmaceutical pipeline, particularly for complex antibody based therapies in oncology and immunology, continues to generate substantial and sustained demand for specialized research reagents throughout the development cycle.
Geographical Analysis
Based on geography, the global research antibodies and reagents market is segmented into North America, Europe, Asia Pacific, Latin America, and the Middle East and Africa.
In 2024, North America accounted for the largest share of the global research antibodies and reagents. The leading position of North America is primarily attributed to the well established healthcare system in the region, higher acceptance of advanced research technologies, rising prevalence of non communicable diseases, increasing drug discovery programs and related growth in pharmaceutical research and development, rising focus on proteomics and genomics research, higher research funding from both government and industry sources, and the presence of a large number of key players operating in this market.
However, the Asia Pacific research antibodies and reagents market is projected to grow at the fastest rate during the forecast period. The rapid growth of this region is driven by rapidly developing economies, a large and growing population base, strong investment from government and non government bodies in the life sciences sector, and various technological advancements being implemented across research institutions in the region. China, India, and other emerging Asian markets are increasingly becoming important growth hubs due to rising healthcare investments, expanding research infrastructure, and an increasing burden of chronic and infectious diseases that is stimulating broader biomedical research activity.
The competitive environment within the global research antibodies and reagents market is shaped by continuous product innovation, strategic collaborations, geographic expansion, and the increasing importance of antibody validation and reproducibility standards. Leading companies are actively investing in expanding their antibody portfolios, strengthening their manufacturing capabilities, and pursuing partnerships and acquisitions to broaden their technological and commercial reach.
Thermo Fisher Scientific and Merck KGaA maintain leadership positions through their comprehensive and diversified product portfolios spanning primary and secondary antibodies, immunoassay reagents, and sample preparation chemistries that cater to virtually every research application. F. Hoffmann-La Roche AG, Agilent Technologies, and Becton Dickinson and Company also hold prominent positions, supported by their strong presence across flow cytometry, immunohistochemistry, and proteomics research segments.
Bio-Techne Corporation, Bio-Rad Laboratories, BioLegend, GenScript Biotech Corporation, Abcam (now a Danaher Company), Cell Signaling Technology, Santa Cruz Biotechnology, and OriGene Technologies are among the other key participants driving innovation and competitive activity across specialized product categories and end user segments.
The key strategies followed by most companies in the research antibodies and reagents market include partnerships, agreements and collaborations; product launches and enhancements; geographic expansions; and mergers and acquisitions, all aimed at strengthening market presence and accelerating the delivery of validated, high performance biological tools to the global research community.
Some of the key players operating in the global research antibodies and reagents market include Thermo Fisher Scientific Inc. (U.S.), Merck KGaA (Germany), F. Hoffmann-La Roche AG (Switzerland), Agilent Technologies, Inc. (U.S.), Becton Dickinson and Company (U.S.), PerkinElmer, Inc. (U.S.), GenScript Biotech Corporation (China), Bio-Techne Corporation (U.S.), Bio-Rad Laboratories, Inc. (U.S.), Santa Cruz Biotechnology, Inc. (U.S.), BioLegend, Inc. (U.S.), Abcam Plc (U.K.), OriGene Technologies, Inc. (U.S.), and Cell Signaling Technology, Inc. (U.S.), among others.
The global research antibodies and reagents market is expected to reach USD 6.76 billion by 2031 from USD 4.34 billion in 2024, growing at a CAGR of 6.5% during the forecast period 2024 to 2031.
In 2024, the antibodies segment is expected to hold the largest share of the global research antibodies and reagents market, driven by widespread application across biomedical research, drug discovery, diagnostics, and disease treatment programs.
In 2024, the flow cytometry segment is expected to hold the largest share of the global research antibodies and reagents market, supported by rising proteomics and cell based research and rapid adoption of high parameter spectral flow cytometry platforms.
In 2024, the proteomics segment is expected to hold the largest share of the global research antibodies and reagents market, driven by growing demand for protein based disease profiling and rising investment in proteomic research programs.
What are the major factors driving the growth of the global research antibodies and reagents market?
The growth of this market is primarily driven by the rapid expansion of proteomics and genomics research, rising R&D investments from pharmaceutical and biotechnology companies, increasing industry academia collaborations, and a growing biopharmaceutical pipeline that requires high volumes of research antibodies and reagents across all stages of drug discovery and development.
Key players operating in the research antibodies and reagents market include Thermo Fisher Scientific Inc. (U.S.), Merck KGaA (Germany), F. Hoffmann-La Roche AG (Switzerland), Agilent Technologies, Inc. (U.S.), Becton Dickinson and Company (U.S.), PerkinElmer, Inc. (U.S.), GenScript Biotech Corporation (China), Bio-Techne Corporation (U.S.), Bio-Rad Laboratories, Inc. (U.S.), Santa Cruz Biotechnology, Inc. (U.S.), BioLegend, Inc. (U.S.), Abcam Plc (U.K.), OriGene Technologies, Inc. (U.S.), and Cell Signaling Technology, Inc. (U.S.).
Asia Pacific is expected to register the highest growth rate in the global research antibodies and reagents market during the forecast period 2024 to 2031.
1. Introduction
1.1. Market Definition & Scope
1.2. Currency & Limitations
2. Research Methodology
2.1. Research Approach
2.2. Data Collection & Validation
2.2.1. Secondary Research
2.2.2. Primary Research
2.3. Market Assessment
2.3.1. Market Size Estimation
2.3.2. Bottom-Up Approach
2.3.3. Top-Down Approach
2.3.4. Growth Forecast
2.4. Assumptions For The Study
3. Executive Summary
4. Market Insights
4.1. Overview
4.2. Drivers
4.2.1. Rising Proteomics and Genomics Research Studies
4.2.2. Increase In Research Funding
4.2.3. Growing Industry-Academia Collaboration
4.2.4. Increasing R&D Investments By Pharmaceutical & Biotechnology Companies
4.3. Restraints
4.3.1. High Cost And Time for Identification And Development of Potential Antibodies
4.4. Opportunities
4.4.1. Growing Application Of Antibodies in Clinical Trials And Medical Research
4.4.2. Growing Research Activities in Developing Countries
4.4.3. Growing Need for New Biomarker Identification
4.4.4. Rising Preference for Protein Therapeutics And Personalized Medicine
4.5. Challenges
4.5.1. Issues Related to Quality and Stability of Research Antibodies
4.6. Trends
4.7. Regulatory Analysis
4.8. Porter's Five Forces Analysis
4.9. Pricing Analysis
5. Global Research Antibodies and Reagents Market, By Product
5.1. Overview
5.2. Antibodies
5.2.1. Antibodies Market, By Type
5.2.1.1. Primary Antibodies
5.2.1.2. Secondary Antibodies
5.2.2. Antibodies Market, By Clonality
5.2.2.1. Monoclonal Antibodies
5.2.2.2. Polyclonal Antibodies
5.2.2.3. Recombinant Antibodies
5.2.3. Antibodies Market, By Source
5.2.3.1. Mouse
5.2.3.2. Rabbit
5.2.3.3. Other Sources
5.2.4. Antibodies Market, By Research Area
5.2.4.1. Oncology
5.2.4.2. Infectious Diseases
5.2.4.3. Cardiology
5.2.4.4. Immunology
5.2.4.5. Neurology
5.2.4.6. Stem Cell Research
5.2.4.7. Other Research Areas
5.3. Reagents
5.3.1. Sample Preparation Reagents
5.3.1.1. Media And Serum
5.3.1.2. Stains And Dyes
5.3.1.3. Probes
5.3.1.4. Buffers
5.3.1.5. Solvents
5.3.2. Antibody Production Reagents
5.3.2.1. Enzymes
5.3.2.2. Proteins
5.3.3. Other Research Reagents
6. Global Research Antibodies and Reagents Market, By Technology
6.1. Overview
6.2. Flow Cytometry
6.3. Immunofluorescence
6.4. Enzyme-Linked Immunosorbent Assay
6.5. Multiplex Immunosorbent Assay
6.6. Western Blot
6.7. Immunohistochemistry
6.8. Immunoprecipitation (Ip)
6.9. Other Technologies
7. Global Research Antibodies and Reagents Market, By Application
7.1. Overview
7.2. Proteomics
7.3. Drug Discovery & Development
7.4. Genomics
8. Global Research Antibodies and Reagents Market, By End User
8.1. Overview
8.2. Pharmaceutical & Biotechnology Companies
8.3. Academic & Research Institutes
8.4. Contract Research Organizations
9. Research Antibodies and Reagents Market Assessment, By Geography
9.1. Overview
9.2. North America
9.2.1. U.S.
9.2.2. Canada
9.3. Europe
9.3.1. Germany
9.3.2. France
9.3.3. U.K.
9.3.4. Italy
9.3.5. Spain
9.3.6. Switzerland
9.3.7. Rest of Europe
9.4. Asia-Pacific
9.4.1. Japan
9.4.2. China
9.4.3. India
9.4.4. South Korea
9.4.5. Australia
9.4.6. Singapore
9.4.7. Rest of Asia-Pacific
9.5. Latin America
9.5.1. Brazil
9.5.2. Mexico
9.5.3. Rest of Latin America
9.6. Middle East & Africa
10. Competitive Landscape
10.1. Introduction
10.2. Competitive Benchmarking
10.3. Competitive Dashboard
10.3.1. Industry Leaders
10.3.2. Market Differentiators
10.3.3. Vanguards
10.3.4. Emerging Companies
10.4. Market Share/Position Analysis
11. Company Profiles
11.1. Merck Kgaa
11.1.1. Company Overview
11.1.2. Financial Overview
11.1.3. Product Portfolio
11.1.4. Swot Analysis
11.2. Thermo Fisher Scientific Inc.
11.2.1. Company Overview
11.2.2. Financial Overview
11.2.3. Product Portfolio
11.2.4. Strategic Developments
11.2.5. Swot Analysis
11.3. F. Hoffmann-La Roche Ltd
11.3.1. Company Overview
11.3.2. Financial Overview
11.3.3. Product Portfolio
11.3.4. Strategic Developments
11.3.5. Swot Analysis
11.4. Agilent Technologies, Inc.
11.4.1. Company Overview
11.4.2. Financial Overview
11.4.3. Product Portfolio
11.4.4. Strategic Developments
11.4.5. Swot Analysis
11.5. Becton, Dickinson And Company
11.5.1. Company Overview
11.5.2. Financial Overview
11.5.3. Product Portfolio
11.5.4. Swot Analysis
11.6. Perkinelmer, Inc.
11.6.1. Company Overview
11.6.2. Product Portfolio
11.6.3. Swot Analysis
11.7. Genscript Biotech Corporation
11.7.1. Company Overview
11.7.2. Financial Overview
11.7.3. Product Portfolio
11.7.4. Strategic Developments
11.7.5. Swot Analysis
11.8. Bio-Techne Corporation
11.8.1. Company Overview
11.8.2. Financial Overview
11.8.3. Product Portfolio
11.8.4. Strategic Developments
11.8.5. Swot Analysis
11.9. Bio-Rad Laboratories, Inc.
11.9.1. Company Overview
11.9.2. Financial Overview
11.9.3. Product Portfolio
11.9.4. Swot Analysis
11.10. Santa Cruz Biotechnology, Inc.
11.10.1. Company Overview
11.10.2. Product Portfolio
11.10.3. Swot Analysis
11.11. Biolegend, Inc.
11.11.1. Company Overview
11.11.2. Product Portfolio
11.11.3. Swot Analysis
11.12. Abcam Plc
11.12.1. Company Overview
11.12.2. Product Portfolio
11.12.3. Swot Analysis
11.13. Origene Technologies, Inc.
11.13.1. Company Overview
11.13.2. Product Portfolio
11.13.3. Swot Analysis
11.14. Cell Signaling Technology, Inc.
11.14.1. Company Overview
11.14.2. Product Portfolio
11.14.3. Swot Analysis
12. Appendix
12.1. Available Customization
12.2. Related Reports
LIST OF TABLES
Table 1. Global Research Antibodies and Reagents Market Drivers: Impact Analysis (2023–2026)
Table 2. Global Research Antibodies and Reagents Market Restraint: Impact Analysis (2023–2026)
Table 3. Global Research Antibodies and Reagents Market Size, By Product, 2023–2031 ($Million)
Table 4. Global Research Antibodies Market Size, By Country/Region, 2023–2031 ($Million)
Table 5. Global Research Antibodies Market Size, By Type, 2023–2031 ($Million)
Table 6. Global Primary Antibodies Market Size, By Country/Region, 2023–2031 ($Million)
Table 7. Global Secondary Antibodies Market Size, By Country/Region, 2023–2031 ($Million)
Table 8. Global Research Antibodies Market Size, By Production Type, 2023–2031 ($Million)
Table 9. Global Monoclonal Antibodies Market Size, By Country/Region, 2023–2031 ($Million)
Table 10. Global Polyclonal Antibodies Market Size, By Country/Region, 2023–2031 ($Million)
Table 11. Global Antibody Fragments Market Size, By Country/Region, 2023–2031 ($Million)
Table 12. Global Research Antibodies Market Size, By Source, 2023–2031 ($Million)
Table 13. Global Mouse Derived Antibodies Market Size, By Country/Region, 2023–2031 ($Million)
Table 14. Global Rabbit Derived Antibodies Market Size, By Country/Region, 2023–2031 ($Million)
Table 15. Global Other Sources Derived Antibodies Market Size, By Country/Region, 2023–2031 ($Million)
Table 16. Global Research Antibodies Market Size, By Research Area, 2023–2031 ($Million)
Table 17. Global Research Antibodies Market Size for Oncology, By Country/Region, 2023–2031 ($Million)
Table 18. Global Research Antibodies Market Size for Infectious Diseases, By Country/Region, 2023–2031 ($Million)
Table 19. Global Research Antibodies Market Size for Cardiovascular Diseases, By Country/Region, 2023–2031 ($Million)
Table 20. Global Research Antibodies Market Size for Immunology, By Country/Region, 2023–2031 ($Million)
Table 21. Global Research Antibodies Market Size for Neurology, By Country/Region, 2023–2031 ($Million)
Table 22. Global Research Antibodies Market Size for Stem Cell Research, By Country/Region, 2023–2031 ($Million)
Table 23. Global Research Antibodies Market Size for Other Research Areas, By Country/Region, 2023–2031 ($Million)
Table 24. Global Research Reagents Market Size, By Type, 2023–2031 ($Million)
Table 25. Global Research Reagents Market Size, By Country/Region, 2023–2031 ($Million)
Table 26. Global Sample Preparation Reagents Market Size, By Type, 2023–2031 ($Million)
Table 27. Global Sample Preparation Reagents Market Size, By Country/Region, 2023–2031 ($Million)
Table 28. Global Media and Serum Market Size, By Country/Region, 2023–2031 ($Million)
Table 29. Global Stains and Dyes Market Size, By Country/Region, 2023–2031 ($Million)
Table 30. Global Probes Market Size, By Country/Region, 2023–2031 ($Million)
Table 31. Global Buffers Market Size, By Country/Region, 2023–2031 ($Million)
Table 32. Global Solvents Market Size, By Country/Region, 2023–2031 ($Million)
Table 33. Global Antibody Production Reagents Market Size, By Type, 2023–2031 ($Million)
Table 34. Global Antibody Production Reagents Market Size, By Country/Region, 2023–2031 ($Million)
Table 35. Global Enzymes Market Size, By Country/Region, 2023–2031 ($Million)
Table 36. Global Proteins Market Size, By Country/Region, 2023–2031 ($Million)
Table 37. Global Other Research Reagents Market Size, By Country/Region, 2023–2031 ($Million)
Table 38. Global Research Antibodies and Reagents Market Size, By Technology, 2023–2031 ($Million)
Table 39. Global Research Antibodies and Reagents Market Size for Flow Cytometry, By Country/Region, 2023–2031 ($Million)
Table 40. Global Research Antibodies and Reagents Market Size for Immunofluorescence, By Country/Region, 2023–2031 ($Million)
Table 41. Global Research Antibodies and Reagents Market Size for Enzyme-Linked Immunosorbent Assay, By Country/Region, 2023–2031 ($Million)
Table 42. Global Multiplex Immunosorbent Assay Market Size, By Country/Region, 2023–2031 ($Million)
Table 43. Global Research Antibodies and Reagents Market Size for Western Blot, By Country/Region, 2023–2031 ($Million)
Table 44. Global Research Antibodies and Reagents Market Size for Immunohistochemistry, By Country/Region, 2023–2031 ($Million)
Table 45. Global Research Antibodies and Reagents Market Size for Immunoprecipitation, By Country/Region, 2023–2031 ($Million)
Table 46. Global Research Antibodies and Reagents Market Size for Other Technologies, By Country/Region, 2023–2031 ($Million)
Table 47. Global Research Antibodies and Reagents Market Size, By Application, 2023–2031 ($Million)
Table 48. Global Research Antibodies and Reagents Market Size for Proteomics, By Country/Region, 2023–2031 ($Million)
Table 49. Global Research Antibodies and Reagents Market Size for Drug Discovery And Development, By Country/Region, 2023–2031 ($Million)
Table 50. Global Research Antibodies and Reagents Market Size for Genomics, By Country/Region, 2023–2031 ($Million)
Table 51. Global Research Antibodies and Reagents Market Size, By End User, 2023–2031 ($Million)
Table 52. Global Research Antibodies and Reagents Market Size for Pharmaceutical And Biotechnology Industry, By Country/Region, 2023–2031 ($Million)
Table 53. Global Research Antibodies and Reagents Market Size for Academic And Research Institutes, By Country/Region, 2023–2031 ($Million)
Table 54. Global Research Antibodies and Reagents Market Size for Contract Research Organizations, By Country/Region, 2023–2031 ($Million)
Table 55. North America: Research Antibodies and Reagents Market, By Country, 2023–2031 (Usd Million)
Table 56. North America: Research Antibodies and Reagents Market Size, By Product, 2023–2031 ($Million)
Table 57. North America: Research Reagents Market Size, By Type, 2023–2031 ($Million)
Table 58. North America: Sample Preparation Reagents Market Size, By Type, 2023–2031 ($Million)
Table 59. North America: Antibody Production Reagents Market Size, By Type, 2023–2031 ($Million)
Table 60. North America: Research Antibodies Market Size, By Type, 2023–2031 ($Million)
Table 61. North America: Research Antibodies Market Size, By Production Type, 2023–2031 ($Million)
Table 62. North America: Research Antibodies Market Size, By Source, 2023–2031 ($Million)
Table 63. North America: Research Antibodies Market Size, By Research Area, 2023–2031 ($Million)
Table 64. North America: Research Antibodies and Reagents Market Size, By Technology, 2023–2031 ($Million)
Table 65. North America: Research Antibodies and Reagents Market Size, By Application, 2023–2031 ($Million)
Table 66. North America: Research Antibodies and Reagents Market Size, By End User, 2023–2031 ($Million)
Table 67. U.S.: Research Antibodies and Reagents Market Size, By Product, 2023–2031 ($Million)
Table 68. U.S.: Research Reagents Market Size, By Type, 2023–2031 ($Million)
Table 69. U.S.: Sample Preparation Reagents Market Size, By Type, 2023–2031 ($Million)
Table 70. U.S.: Antibody Production Reagents Market Size, By Type, 2023–2031 ($Million)
Table 71. U.S.: Research Antibodies Market Size, By Type, 2023–2031 ($Million)
Table 72. U.S.: Research Antibodies Market Size, By Production Type, 2023–2031 ($Million)
Table 73. U.S.: Research Antibodies Market Size, By Source, 2023–2031 ($Million)
Table 74. U.S.: Research Antibodies Market Size, By Research Area, 2023–2031 ($Million)
Table 75. U.S.: Research Antibodies and Reagents Market Size, By Technology, 2023–2031 ($Million)
Table 76. U.S.: Research Antibodies and Reagents Market Size, By Application, 2023–2031 ($Million)
Table 77. U.S.: Research Antibodies and Reagents Market Size, By End User, 2023–2031 ($Million)
Table 78. Canada: Research Antibodies and Reagents Market Size, By Product, 2023–2031 ($Million)
Table 79. Canada: Research Reagents Market Size, By Type, 2023–2031 ($Million)
Table 80. Canada: Sample Preparation Reagents Market Size, By Type, 2023–2031 ($Million)
Table 81. Canada: Antibody Production Reagents Market Size, By Type, 2023–2031 ($Million)
Table 82. Canada: Research Antibodies Market Size, By Type, 2023–2031 ($Million)
Table 83. Canada: Research Antibodies Market Size, By Production Type, 2023–2031 ($Million)
Table 84. Canada: Research Antibodies Market Size, By Source, 2023–2031 ($Million)
Table 85. Canada: Research Antibodies Market Size, By Research Area, 2023–2031 ($Million)
Table 86. Canada: Research Antibodies and Reagents Market Size, By Technology, 2023–2031 ($Million)
Table 87. Canada: Research Antibodies and Reagents Market Size, By Application, 2023–2031 ($Million)
Table 88. Canada: Research Antibodies and Reagents Market Size, By End User, 2023–2031 ($Million)
Table 89. Europe: Research Antibodies and Reagents Market, By Country, 2023–2031 (Usd Million)
Table 90. Europe: Research Antibodies and Reagents Market Size, By Product, 2023–2031 ($Million)
Table 91. Europe: Research Reagents Market Size, By Type, 2023–2031 ($Million)
Table 92. Europe: Sample Preparation Reagents Market Size, By Type, 2023–2031 ($Million)
Table 93. Europe: Antibody Production Reagents Market Size, By Type, 2023–2031 ($Million)
Table 94. Europe: Research Antibodies Market Size, By Type, 2023–2031 ($Million)
Table 95. Europe: Research Antibodies Market Size, By Production Type, 2023–2031 ($Million)
Table 96. Europe: Research Antibodies Market Size, By Source, 2023–2031 ($Million)
Table 97. Europe: Research Antibodies Market Size, By Research Area, 2023–2031 ($Million)
Table 98. Europe: Research Antibodies and Reagents Market Size, By Technology, 2023–2031 ($Million)
Table 99. Europe: Research Antibodies and Reagents Market Size, By Application, 2023–2031 ($Million)
Table 100. Europe: Research Antibodies and Reagents Market Size, By End User, 2023–2031 ($Million)
Table 101. Germany: Research Antibodies and Reagents Market Size, By Product, 2023–2031 ($Million)
Table 102. Germany: Research Reagents Market Size, By Type, 2023–2031 ($Million)
Table 103. Germany: Sample Preparation Reagents Market Size, By Type, 2023–2031 ($Million)
Table 104. Germany: Antibody Production Reagents Market Size, By Type, 2023–2031 ($Million)
Table 105. Germany: Research Antibodies Market Size, By Type, 2023–2031 ($Million)
Table 106. Germany: Research Antibodies Market Size, By Production Type, 2023–2031 ($Million)
Table 107. Germany: Research Antibodies Market Size, By Source, 2023–2031 ($Million)
Table 108. Germany: Research Antibodies Market Size, By Research Area, 2023–2031 ($Million)
Table 109. Germany: Research Antibodies and Reagents Market Size, By Technology, 2023–2031 ($Million)
Table 110. Germany: Research Antibodies and Reagents Market Size, By Application, 2023–2031 ($Million)
Table 111. Germany: Research Antibodies and Reagents Market Size, By End User, 2023–2031 ($Million)
Table 112. France: Research Antibodies and Reagents Market Size, By Product, 2023–2031 ($Million)
Table 113. France: Research Reagents Market Size, By Type, 2023–2031 ($Million)
Table 114. France: Sample Preparation Reagents Market Size, By Type, 2023–2031 ($Million)
Table 115. France: Antibody Production Reagents Market Size, By Type, 2023–2031 ($Million)
Table 116. France: Research Antibodies Market Size, By Type, 2023–2031 ($Million)
Table 117. France: Research Antibodies Market Size, By Production Type, 2023–2031 ($Million)
Table 118. France: Research Antibodies Market Size, By Source, 2023–2031 ($Million)
Table 119. France: Research Antibodies Market Size, By Research Area, 2023–2031 ($Million)
Table 120. France: Research Antibodies and Reagents Market Size, By Technology, 2023–2031 ($Million)
Table 121. France: Research Antibodies and Reagents Market Size, By Application, 2023–2031 ($Million)
Table 122. France: Research Antibodies and Reagents Market Size, By End User, 2023–2031 ($Million)
Table 123. U.K.: Research Antibodies and Reagents Market Size, By Product, 2023–2031 ($Million)
Table 124. U.K.: Research Reagents Market Size, By Type, 2023–2031 ($Million)
Table 125. U.K.: Sample Preparation Reagents Market Size, By Type, 2023–2031 ($Million)
Table 126. U.K.: Antibody Production Reagents Market Size, By Type, 2023–2031 ($Million)
Table 127. U.K.: Research Antibodies Market Size, By Type, 2023–2031 ($Million)
Table 128. U.K.: Research Antibodies Market Size, By Production Type, 2023–2031 ($Million)
Table 129. U.K.: Research Antibodies Market Size, By Source, 2023–2031 ($Million)
Table 130. U.K.: Research Antibodies Market Size, By Research Area, 2023–2031 ($Million)
Table 131. U.K.: Research Antibodies and Reagents Market Size, By Technology, 2023–2031 ($Million)
Table 132. U.K.: Research Antibodies and Reagents Market Size, By Application, 2023–2031 ($Million)
Table 133. U.K.: Research Antibodies and Reagents Market Size, By End User, 2023–2031 ($Million)
Table 134. Italy: Research Antibodies and Reagents Market Size, By Product, 2023–2031 ($Million)
Table 135. Italy: Research Reagents Market Size, By Type, 2023–2031 ($Million)
Table 136. Italy: Sample Preparation Reagents Market Size, By Type, 2023–2031 ($Million)
Table 137. Italy: Antibody Production Reagents Market Size, By Type, 2023–2031 ($Million)
Table 138. Italy: Research Antibodies Market Size, By Type, 2023–2031 ($Million)
Table 139. Italy: Research Antibodies Market Size, By Production Type, 2023–2031 ($Million)
Table 140. Italy: Research Antibodies Market Size, By Source, 2023–2031 ($Million)
Table 141. Italy: Research Antibodies Market Size, By Research Area, 2023–2031 ($Million)
Table 142. Italy: Research Antibodies and Reagents Market Size, By Technology, 2023–2031 ($Million)
Table 143. Italy: Research Antibodies and Reagents Market Size, By Application, 2023–2031 ($Million)
Table 144. Italy: Research Antibodies and Reagents Market Size, By End User, 2023–2031 ($Million)
Table 145. Spain: Research Antibodies and Reagents Market Size, By Product, 2023–2031 ($Million)
Table 146. Spain: Research Reagents Market Size, By Type, 2023–2031 ($Million)
Table 147. Spain: Sample Preparation Reagents Market Size, By Type, 2023–2031 ($Million)
Table 148. Spain: Antibody Production Reagents Market Size, By Type, 2023–2031 ($Million)
Table 149. Spain: Research Antibodies Market Size, By Type, 2023–2031 ($Million)
Table 150. Spain: Research Antibodies Market Size, By Production Type, 2023–2031 ($Million)
Table 151. Spain: Research Antibodies Market Size, By Source, 2023–2031 ($Million)
Table 152. Spain: Research Antibodies Market Size, By Research Area, 2023–2031 ($Million)
Table 153. Spain: Research Antibodies and Reagents Market Size, By Technology, 2023–2031 ($Million)
Table 154. Spain: Research Antibodies and Reagents Market Size, By Application, 2023–2031 ($Million)
Table 155. Spain: Research Antibodies and Reagents Market Size, By End User, 2023–2031 ($Million)
Table 156. Switzerland: Research Antibodies and Reagents Market Size, By Product, 2023–2031 ($Million)
Table 157. Switzerland: Research Reagents Market Size, By Type, 2023–2031 ($Million)
Table 158. Switzerland: Sample Preparation Reagents Market Size, By Type, 2023–2031 ($Million)
Table 159. Switzerland: Antibody Production Reagents Market Size, By Type, 2023–2031 ($Million)
Table 160. Switzerland: Research Antibodies Market Size, By Type, 2023–2031 ($Million)
Table 161. Switzerland: Research Antibodies Market Size, By Production Type, 2023–2031 ($Million)
Table 162. Switzerland: Research Antibodies Market Size, By Source, 2023–2031 ($Million)
Table 163. Switzerland: Research Antibodies Market Size, By Research Area, 2023–2031 ($Million)
Table 164. Switzerland: Research Antibodies and Reagents Market Size, By Technology, 2023–2031 ($Million)
Table 165. Switzerland: Research Antibodies and Reagents Market Size, By Application, 2023–2031 ($Million)
Table 166. Switzerland: Research Antibodies and Reagents Market Size, By End User, 2023–2031 ($Million)
Table 167. Rest of Europe: Research Antibodies and Reagents Market Size, By Product, 2023–2031 ($Million)
Table 168. Rest of Europe: Research Reagents Market Size, By Type, 2023–2031 ($Million)
Table 169. Rest of Europe: Sample Preparation Reagents Market Size, By Type, 2023–2031 ($Million)
Table 170. Rest of Europe: Antibody Production Reagents Market Size, By Type, 2023–2031 ($Million)
Table 171. Rest of Europe: Research Antibodies Market Size, By Type, 2023–2031 ($Million)
Table 172. Rest of Europe: Research Antibodies Market Size, By Production Type, 2023–2031 ($Million)
Table 173. Rest of Europe: Research Antibodies Market Size, By Source, 2023–2031 ($Million)
Table 174. Rest of Europe: Research Antibodies Market Size, By Research Area, 2023–2031 ($Million)
Table 175. Rest of Europe: Research Antibodies and Reagents Market Size, By Technology, 2023–2031 ($Million)
Table 176. Rest of Europe: Research Antibodies and Reagents Market Size, By Application, 2023–2031 ($Million)
Table 177. Rest of Europe: Research Antibodies and Reagents Market Size, By End User, 2023–2031 ($Million)
Table 178. Asia-Pacific: Research Antibodies and Reagents Market, By Country, 2023–2031 (Usd Million)
Table 179. Asia-Pacific: Research Antibodies and Reagents Market Size, By Product, 2023–2031 ($Million)
Table 180. Asia-Pacific: Research Reagents Market Size, By Type, 2023–2031 ($Million)
Table 181. Asia-Pacific: Sample Preparation Reagents Market Size, By Type, 2023–2031 ($Million)
Table 182. Asia-Pacific: Antibody Production Reagents Market Size, By Type, 2023–2031 ($Million)
Table 183. Asia-Pacific: Research Antibodies Market Size, By Type, 2023–2031 ($Million)
Table 184. Asia-Pacific: Research Antibodies Market Size, By Production Type, 2023–2031 ($Million)
Table 185. Asia-Pacific: Research Antibodies Market Size, By Source, 2023–2031 ($Million)
Table 186. Asia-Pacific: Research Antibodies Market Size, By Research Area, 2023–2031 ($Million)
Table 187. Asia-Pacific: Research Antibodies and Reagents Market Size, By Technology, 2023–2031 ($Million)
Table 188. Asia-Pacific: Research Antibodies and Reagents Market Size, By Application, 2023–2031 ($Million)
Table 189. Asia-Pacific: Research Antibodies and Reagents Market Size, By End User, 2023–2031 ($Million)
Table 190. Japan: Research Antibodies and Reagents Market Size, By Product, 2023–2031 ($Million)
Table 191. Japan: Research Reagents Market Size, By Type, 2023–2031 ($Million)
Table 192. Japan: Sample Preparation Reagents Market Size, By Type, 2023–2031 ($Million)
Table 193. Japan: Antibody Production Reagents Market Size, By Type, 2023–2031 ($Million)
Table 194. Japan: Research Antibodies Market Size, By Type, 2023–2031 ($Million)
Table 195. Japan: Research Antibodies Market Size, By Production Type, 2023–2031 ($Million)
Table 196. Japan: Research Antibodies Market Size, By Source, 2023–2031 ($Million)
Table 197. Japan: Research Antibodies Market Size, By Research Area, 2023–2031 ($Million)
Table 198. Japan: Research Antibodies and Reagents Market Size, By Technology, 2023–2031 ($Million)
Table 199. Japan: Research Antibodies and Reagents Market Size, By Application, 2023–2031 ($Million)
Table 200. Japan: Research Antibodies and Reagents Market Size, By End User, 2023–2031 ($Million)
Table 201. China: Research Antibodies and Reagents Market Size, By Product, 2023–2031 ($Million)
Table 202. China: Research Reagents Market Size, By Type, 2023–2031 ($Million)
Table 203. China: Sample Preparation Reagents Market Size, By Type, 2023–2031 ($Million)
Table 204. China: Antibody Production Reagents Market Size, By Type, 2023–2031 ($Million)
Table 205. China: Research Antibodies Market Size, By Type, 2023–2031 ($Million)
Table 206. China: Research Antibodies Market Size, By Production Type, 2023–2031 ($Million)
Table 207. China: Research Antibodies Market Size, By Source, 2023–2031 ($Million)
Table 208. China: Research Antibodies Market Size, By Research Area, 2023–2031 ($Million)
Table 209. China: Research Antibodies and Reagents Market Size, By Technology, 2023–2031 ($Million)
Table 210. China: Research Antibodies and Reagents Market Size, By Application, 2023–2031 ($Million)
Table 211. China: Research Antibodies and Reagents Market Size, By End User, 2023–2031 ($Million)
Table 212. India: Research Antibodies and Reagents Market Size, By Product, 2023–2031 ($Million)
Table 213. India: Research Reagents Market Size, By Type, 2023–2031 ($Million)
Table 214. India: Sample Preparation Reagents Market Size, By Type, 2023–2031 ($Million)
Table 215. India: Antibody Production Reagents Market Size, By Type, 2023–2031 ($Million)
Table 216. India: Research Antibodies Market Size, By Type, 2023–2031 ($Million)
Table 217. India: Research Antibodies Market Size, By Production Type, 2023–2031 ($Million)
Table 218. India: Research Antibodies Market Size, By Source, 2023–2031 ($Million)
Table 219. India: Research Antibodies Market Size, By Research Area, 2023–2031 ($Million)
Table 220. India: Research Antibodies and Reagents Market Size, By Technology, 2023–2031 ($Million)
Table 221. India: Research Antibodies and Reagents Market Size, By Application, 2023–2031 ($Million)
Table 222. India: Research Antibodies and Reagents Market Size, By End User, 2023–2031 ($Million)
Table 223. South Korea: Research Antibodies and Reagents Market Size, By Product, 2023–2031 ($Million)
Table 224. South Korea: Research Reagents Market Size, By Type, 2023–2031 ($Million)
Table 225. South Korea: Sample Preparation Reagents Market Size, By Type, 2023–2031 ($Million)
Table 226. South Korea: Antibody Production Reagents Market Size, By Type, 2023–2031 ($Million)
Table 227. South Korea: Research Antibodies Market Size, By Type, 2023–2031 ($Million)
Table 228. South Korea: Research Antibodies Market Size, By Production Type, 2023–2031 ($Million)
Table 229. South Korea: Research Antibodies Market Size, By Source, 2023–2031 ($Million)
Table 230. South Korea: Research Antibodies Market Size, By Research Area, 2023–2031 ($Million)
Table 231. South Korea: Research Antibodies and Reagents Market Size, By Technology, 2023–2031 ($Million)
Table 232. South Korea: Research Antibodies and Reagents Market Size, By Application, 2023–2031 ($Million)
Table 233. South Korea: Research Antibodies and Reagents Market Size, By End User, 2023–2031 ($Million)
Table 234. Australia: Research Antibodies and Reagents Market Size, By Product, 2023–2031 ($Million)
Table 235. Australia: Research Reagents Market Size, By Type, 2023–2031 ($Million)
Table 236. Australia: Sample Preparation Reagents Market Size, By Type, 2023–2031 ($Million)
Table 237. Australia: Antibody Production Reagents Market Size, By Type, 2023–2031 ($Million)
Table 238. Australia: Research Antibodies Market Size, By Type, 2023–2031 ($Million)
Table 239. Australia: Research Antibodies Market Size, By Production Type, 2023–2031 ($Million)
Table 240. Australia: Research Antibodies Market Size, By Source, 2023–2031 ($Million)
Table 241. Australia: Research Antibodies Market Size, By Research Area, 2023–2031 ($Million)
Table 242. Australia: Research Antibodies and Reagents Market Size, By Technology, 2023–2031 ($Million)
Table 243. Australia: Research Antibodies and Reagents Market Size, By Application, 2023–2031 ($Million)
Table 244. Australia: Research Antibodies and Reagents Market Size, By End User, 2023–2031 ($Million)
Table 245. Singapore: Research Antibodies and Reagents Market Size, By Product, 2023–2031 ($Million)
Table 246. Singapore: Research Reagents Market Size, By Type, 2023–2031 ($Million)
Table 247. Singapore: Sample Preparation Reagents Market Size, By Type, 2023–2031 ($Million)
Table 248. Singapore: Antibody Production Reagents Market Size, By Type, 2023–2031 ($Million)
Table 249. Singapore: Research Antibodies Market Size, By Type, 2023–2031 ($Million)
Table 250. Singapore: Research Antibodies Market Size, By Production Type, 2023–2031 ($Million)
Table 251. Singapore: Research Antibodies Market Size, By Source, 2023–2031 ($Million)
Table 252. Singapore: Research Antibodies Market Size, By Research Area, 2023–2031 ($Million)
Table 253. Singapore: Research Antibodies and Reagents Market Size, By Technology, 2023–2031 ($Million)
Table 254. Singapore: Research Antibodies and Reagents Market Size, By Application, 2023–2031 ($Million)
Table 255. Singapore: Research Antibodies and Reagents Market Size, By End User, 2023–2031 ($Million)
Table 256. Rest of Asia-Pacific: Research Antibodies and Reagents Market Size, By Product, 2023–2031 ($Million)
Table 257. Rest of Asia-Pacific: Research Reagents Market Size, By Type, 2023–2031 ($Million)
Table 258. Rest of Asia-Pacific: Sample Preparation Reagents Market Size, By Type, 2023–2031 ($Million)
Table 259. Rest of Asia-Pacific: Antibody Production Reagents Market Size, By Type, 2023–2031 ($Million)
Table 260. Rest of Asia-Pacific: Research Antibodies Market Size, By Type, 2023–2031 ($Million)
Table 261. Rest of Asia-Pacific: Research Antibodies Market Size, By Production Type, 2023–2031 ($Million)
Table 262. Rest of Asia-Pacific: Research Antibodies Market Size, By Source, 2023–2031 ($Million)
Table 263. Rest of Asia-Pacific: Research Antibodies Market Size, By Research Area, 2023–2031 ($Million)
Table 264. Rest of Asia-Pacific: Research Antibodies and Reagents Market Size, By Technology, 2023–2031 ($Million)
Table 265. Rest of Asia-Pacific: Research Antibodies and Reagents Market Size, By Application, 2023–2031 ($Million)
Table 266. Rest of Asia-Pacific: Research Antibodies and Reagents Market Size, By End User, 2023–2031 ($Million)
Table 267. Latin America: Research Antibodies and Reagents Market, By Country, 2023–2031 (Usd Million)
Table 268. Latin America: Research Antibodies and Reagents Market Size, By Product, 2023–2031 ($Million)
Table 269. Latin America: Research Reagents Market Size, By Type, 2023–2031 ($Million)
Table 270. Latin America: Sample Preparation Reagents Market Size, By Type, 2023–2031 ($Million)
Table 271. Latin America: Antibody Production Reagents Market Size, By Type, 2023–2031 ($Million)
Table 272. Latin America: Research Antibodies Market Size, By Type, 2023–2031 ($Million)
Table 273. Latin America: Research Antibodies Market Size, By Production Type, 2023–2031 ($Million)
Table 274. Latin America: Research Antibodies Market Size, By Source, 2023–2031 ($Million)
Table 275. Latin America: Research Antibodies Market Size, By Research Area, 2023–2031 ($Million)
Table 276. Latin America: Research Antibodies and Reagents Market Size, By Technology, 2023–2031 ($Million)
Table 277. Latin America: Research Antibodies and Reagents Market Size, By Application, 2023–2031 ($Million)
Table 278. Latin America: Research Antibodies and Reagents Market Size, By End User, 2023–2031 ($Million)
Table 279. Brazil: Research Antibodies and Reagents Market Size, By Product, 2023–2031 ($Million)
Table 280. Brazil: Research Reagents Market Size, By Type, 2023–2031 ($Million)
Table 281. Brazil: Sample Preparation Reagents Market Size, By Type, 2023–2031 ($Million)
Table 282. Brazil: Antibody Production Reagents Market Size, By Type, 2023–2031 ($Million)
Table 283. Brazil: Research Antibodies Market Size, By Type, 2023–2031 ($Million)
Table 284. Brazil: Research Antibodies Market Size, By Production Type, 2023–2031 ($Million)
Table 285. Brazil: Research Antibodies Market Size, By Source, 2023–2031 ($Million)
Table 286. Brazil: Research Antibodies Market Size, By Research Area, 2023–2031 ($Million)
Table 287. Brazil: Research Antibodies and Reagents Market Size, By Technology, 2023–2031 ($Million)
Table 288. Brazil: Research Antibodies and Reagents Market Size, By Application, 2023–2031 ($Million)
Table 289. Brazil: Research Antibodies and Reagents Market Size, By End User, 2023–2031 ($Million)
Table 290. Mexico: Research Antibodies and Reagents Market Size, By Product, 2023–2031 ($Million)
Table 291. Mexico: Research Reagents Market Size, By Type, 2023–2031 ($Million)
Table 292. Mexico: Sample Preparation Reagents Market Size, By Type, 2023–2031 ($Million)
Table 293. Mexico: Antibody Production Reagents Market Size, By Type, 2023–2031 ($Million)
Table 294. Mexico: Research Antibodies Market Size, By Type, 2023–2031 ($Million)
Table 295. Mexico: Research Antibodies Market Size, By Production Type, 2023–2031 ($Million)
Table 296. Mexico: Research Antibodies Market Size, By Source, 2023–2031 ($Million)
Table 297. Mexico: Research Antibodies Market Size, By Research Area, 2023–2031 ($Million)
Table 298. Mexico: Research Antibodies and Reagents Market Size, By Technology, 2023–2031 ($Million)
Table 299. Mexico: Research Antibodies and Reagents Market Size, By Application, 2023–2031 ($Million)
Table 300. Mexico: Research Antibodies and Reagents Market Size, By End User, 2023–2031 ($Million)
Table 301. Rest of Latin America: Research Antibodies and Reagents Market Size, By Product, 2023–2031 ($ Million)
Table 302. Rest of Latin America: Research Reagents Market Size, By Type, 2023–2031 ($ Million)
Table 303. Rest of Latin America: Sample Preparation Reagents Market Size, By Type, 2023–2031 ($ Million)
Table 304. Rest of Latin America: Antibody Production Reagents Market Size, By Type, 2023–2031 ($ Million)
Table 305. Rest of Latin America: Research Antibodies Market Size, By Type, 2023–2031 ($ Million)
Table 306. Rest of Latin America: Research Antibodies Market Size, By Production Type, 2023–2031 ($ Million)
Table 307. Rest of Latin America: Research Antibodies Market Size, By Source, 2023–2031 ($ Million)
Table 308. Rest of Latin America: Research Antibodies Market Size, By Research Area, 2023–2031 ($ Million)
Table 309. Rest of Latin America: Research Antibodies and Reagents Market Size, By Technology, 2023–2031 ($ Million)
Table 310. Rest of Latin America: Research Antibodies and Reagents Market Size, By Application, 2023–2031 ($ Million)
Table 311. Rest of Latin America: Research Antibodies and Reagents Market Size, By End User, 2023–2031 ($ Million)
Table 312. Middle East and Africa: Research Antibodies and Reagents Market Size, By Product, 2023–2031 ($ Million)
Table 313. Middle East and Africa: Research Reagents Market Size, By Type, 2023–2031 ($ Million)
Table 314. Middle East and Africa: Sample Preparation Reagents Market Size, By Type, 2023–2031 ($ Million)
Table 315. Middle East and Africa: Antibody Production Reagents Market Size, By Type, 2023–2031 ($ Million)
Table 316. Middle East and Africa: Research Antibodies Market Size, By Type, 2023–2031 ($ Million)
Table 317. Middle East and Africa: Research Antibodies Market Size, By Production Type, 2023–2031 ($ Million)
Table 318. Middle East and Africa: Research Antibodies Market Size, By Source, 2023–2031 ($ Million)
Table 319. Middle East and Africa: Research Antibodies Market Size, By Research Area, 2023–2031 ($ Million)
Table 320. Middle East and Africa: Research Antibodies and Reagents Market Size, By Technology, 2023–2031 ($ Million)
Table 321. Middle East and Africa: Research Antibodies and Reagents Market Size, By Application, 2023–2031 ($ Million)
Table 322. Middle East and Africa: Research Antibodies and Reagents Market Size, By End User, 2023–2031 ($ Million)
LIST OF FIGURES
Figure 1. Research Process
Figure 2. Key Secondary Sources
Figure 3. Primary Research Techniques
Figure 4. Key Executives Interviewed
Figure 5. Breakdown of Primary Interviews (Supply-Side & Demand-Side)
Figure 6. Market Sizing and Growth Forecast Approach
Figure 7. Global Research Antibodies and Reagents Market, By Product, 2024 Vs. 2031 (Usd Million)
Figure 8. Global Research Antibodies and Reagents Market, By Technology, 2024 Vs. 2031 (Usd Million)
Figure 9. Global Research Antibodies and Reagents Market, By Application, 2024 Vs. 2031 (Usd Million)
Figure 10. Global Research Antibodies and Reagents Market, By End User, 2024 Vs. 2031 (Usd Million)
Figure 11. Research Antibodies and Reagents Market, By Geography, 2024 Vs 2031 (Usd Milliion)
Figure 12. Porter's Five Forces Analysis
Figure 13. Global Research Antibodies and Reagents Market, By Product, 2024 Vs. 2031 (Usd Million)
Figure 14. Global Research Antibodies and Reagents Market, By Technology, 2024 Vs. 2031 (Usd Million)
Figure 15. Global Research Antibodies and Reagents Market, By Application, 2024 Vs. 2031 (Usd Million)
Figure 16. Global Research Antibodies and Reagents Market, By End User, 2025 Vs. 2035 (Usd Million)
Figure 17. Global Research Antibodies and Reagents Market, By Region, 2024 Vs. 2031 (Usd Million)
Figure 18. Research Antibodies and Reagents Market: Competitive Benchmarking
Figure 19. Competitive Dashboard: Research Antibodies and Reagents Market
Figure 20. Research Antibodies and Reagents Market Position Analysis, 2024
Figure 21. Merck Kgaa: Financial Overview (2024)
Figure 22. Thermo Fisher Scientific Inc.: Financial Overview (2024)
Figure 23. F. Hoffmann-La Roche: Financial Overview (2024)
Figure 24. Agilent Technologies, Inc.: Financial Overview (2024)
Figure 25. Becton Dickinson And Company: Financial Overview (2024)
Figure 26. Genscript Biotech Corporation: Financial Overview (2024)
Figure 27. Bio-Techne Corporation: Financial Overview (2024)
Figure 28. Bio-Rad Laboratories, Inc.: Financial Overview (2024)


Published Date: Jan-2025
Published Date: Aug-2024
Published Date: Jul-2024
Published Date: Jun-2024
Published Date: Jul-2022
Subscribe to get the latest industry updates