Resources
About Us
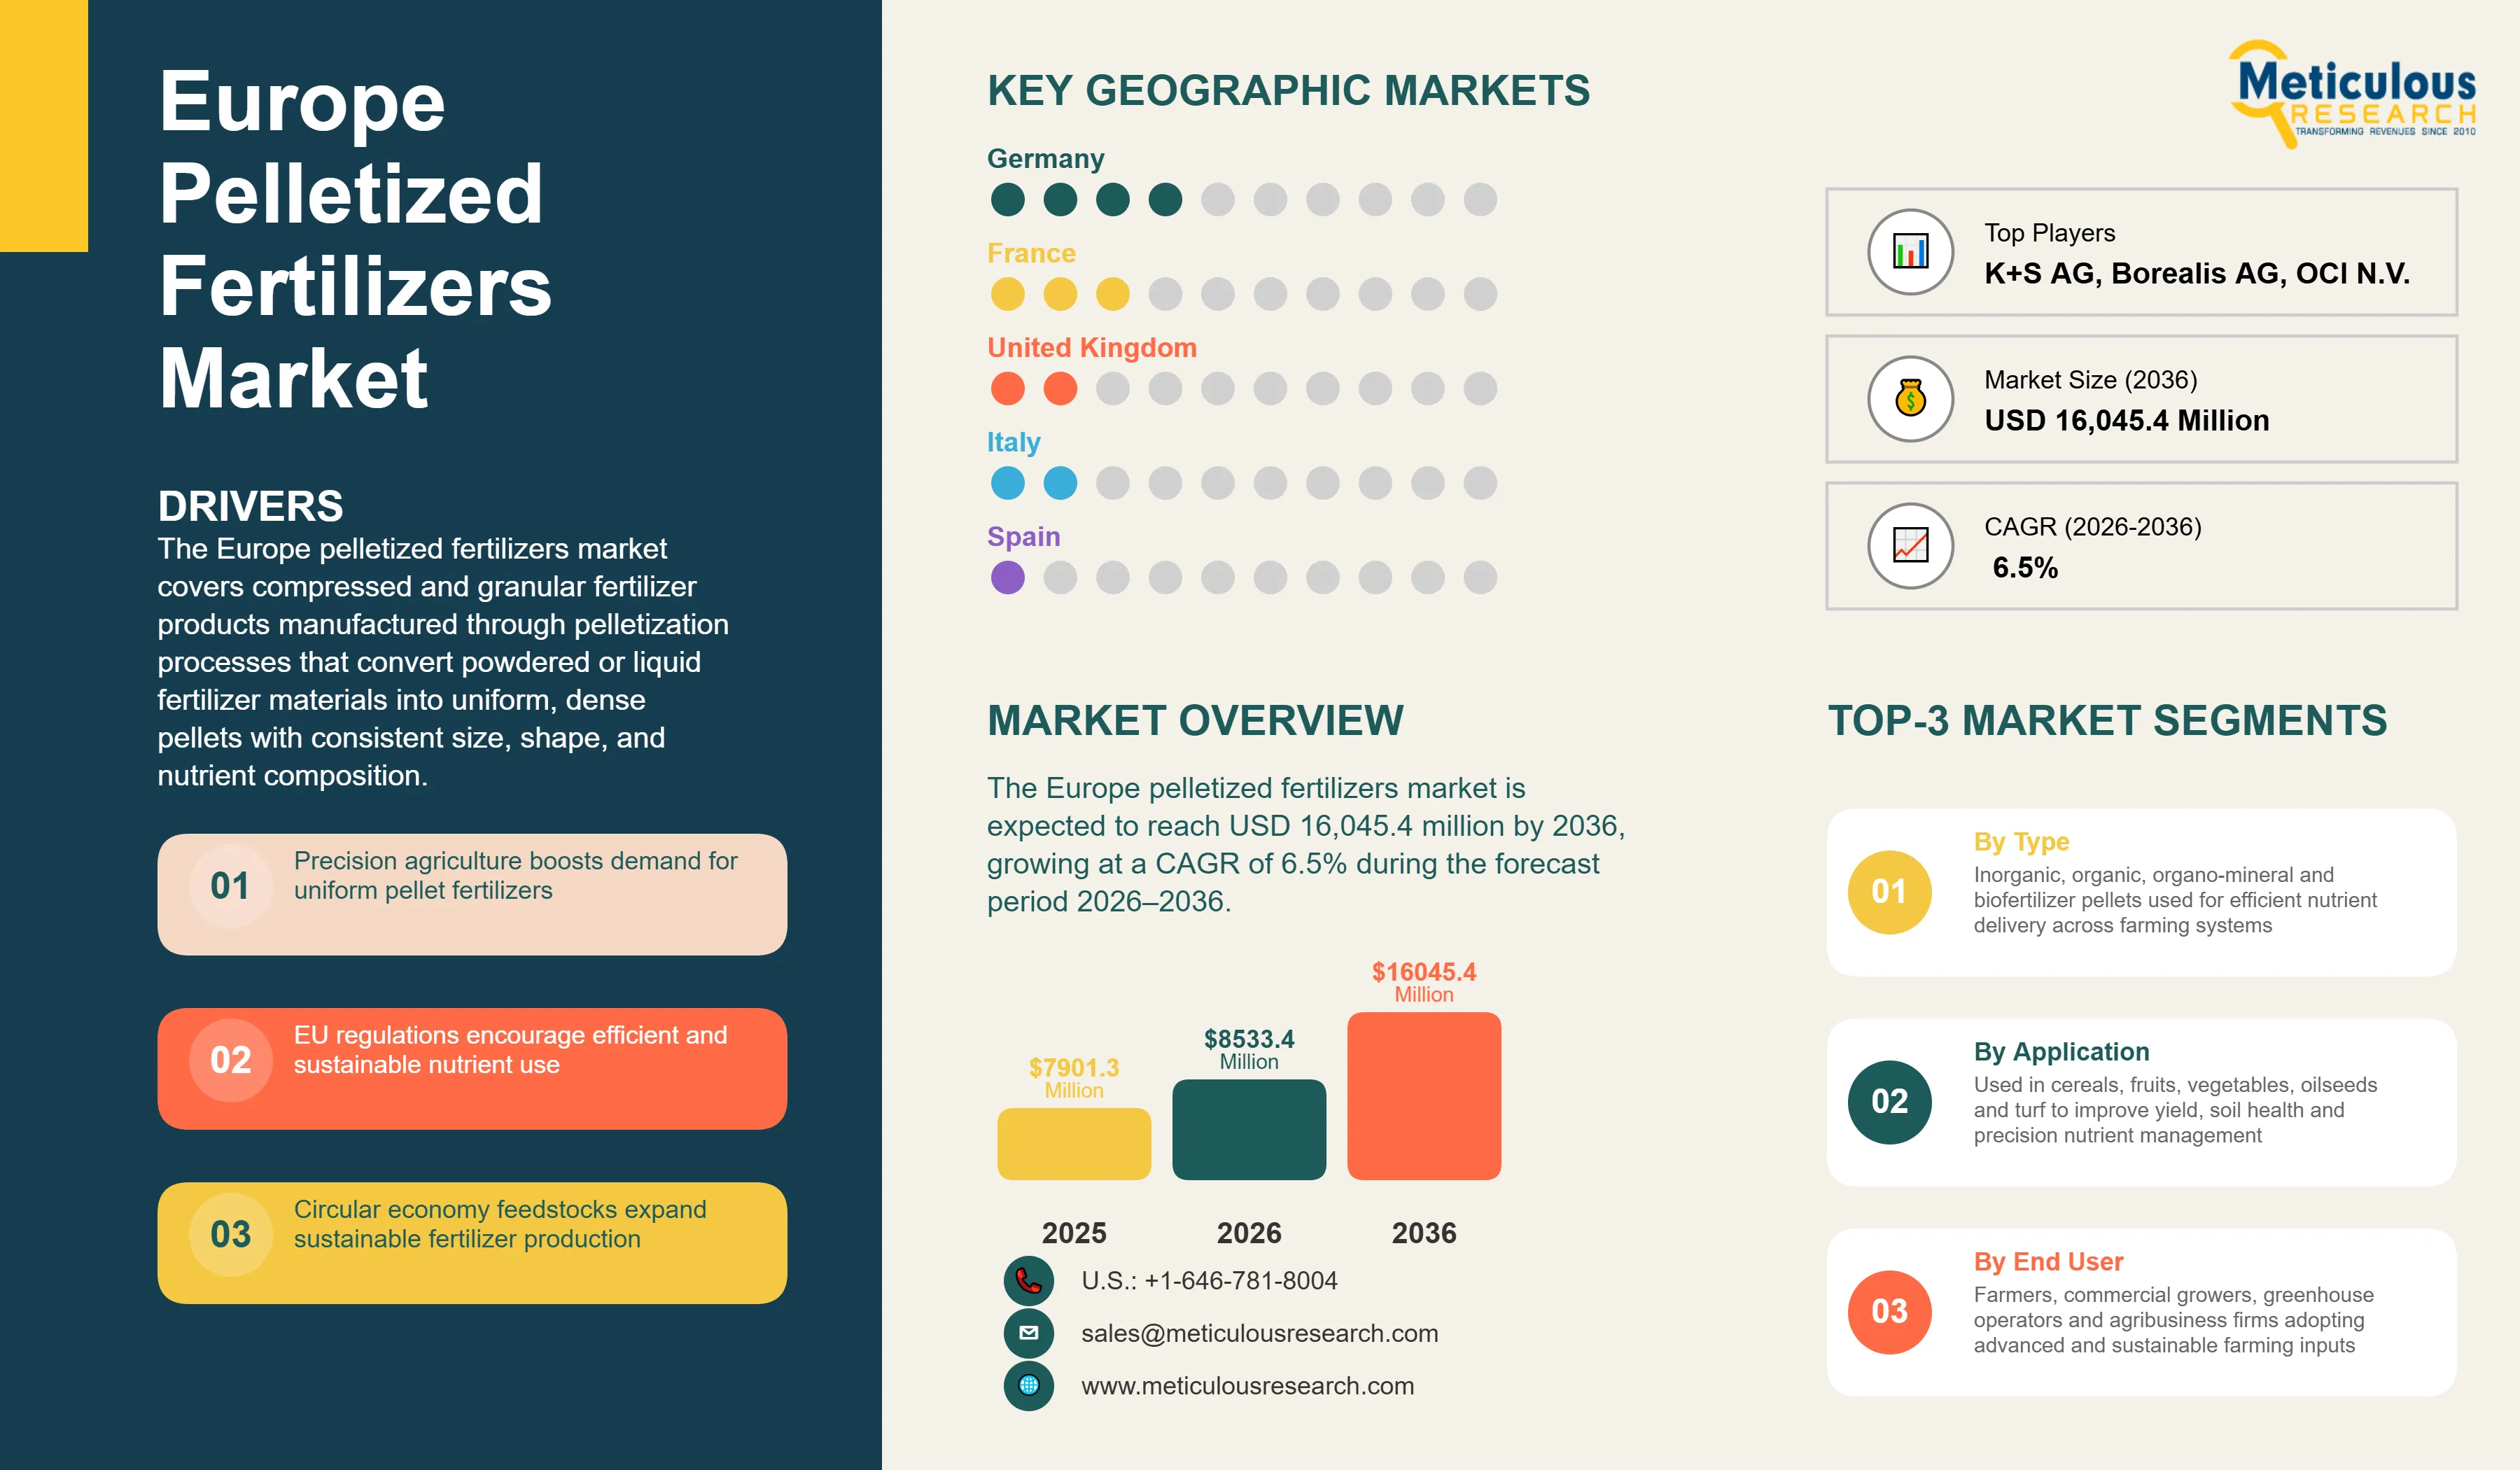
The Europe pelletized fertilizers market was valued at USD 7,901.3 million in 2025. This market is expected to reach USD 16,045.4 million by 2036 from an estimated USD 8,533.4 million in 2026, growing at a CAGR of 6.5% during the forecast period 2026–2036.
Click here to: Get Free Sample Pages of this Report
The Europe pelletized fertilizers market covers compressed and granular fertilizer products manufactured through pelletization processes that convert powdered or liquid fertilizer materials into uniform, dense pellets with consistent size, shape, and nutrient composition. These fertilizers are produced using various nutrient sources including nitrogen, phosphorus, potassium, and secondary nutrients, often combined with organic materials, binding agents, and micronutrients to create balanced formulations tailored to specific crop requirements and soil conditions. The pelletization process offers meaningful advantages over conventional powdered or bulk fertilizer formats, including improved handling and application characteristics, reduced dust generation during storage and transport, enhanced nutrient release profiles enabling controlled and slow release formulations, better storage stability with reduced caking and moisture absorption, and improved precision in mechanical application equipment.
Pelletized fertilizers serve diverse agricultural applications across field crops such as cereals, oilseeds, and pulses; horticultural crops including fruits, vegetables, and ornamentals; turf and lawn care; and specialty agriculture. These products are central to broader transition in Europe toward sustainable and precision agriculture practices that optimize nutrient use efficiency, minimize environmental impact, and enhance crop productivity and quality.
The growth of the pelletized fertilizers market in Europe is primarily driven by the growing adoption of precision agriculture and digital farming technologies that are increasing demand for pelletized nutrient formats compatible with variable rate spreading and GPS guided application systems. The EU Common Agricultural Policy eco scheme and green payment frameworks that reward documented nutrient management practices aligned with precision pelletized inputs are further reinforcing structural demand. Additionally, the tightening of environmental regulations including the Nitrates Directive, the National Emission Ceilings Directive, and the Farm to Fork Strategy's 20% synthetic fertilizer use reduction target by 2030 are collectively creating strong incentives for the adoption of enhanced efficiency, slow release, and organo mineral pelletized fertilizer formats across European agricultural systems.
However, higher production costs relative to conventional granular and prilled fertilizer products, substantial infrastructure requirements for handling, storage, and precision application, and the significant energy cost sensitivity of industrial pelletization processes restrain the growth of this market to some extent.
On the other hand, the growing demand for organic and bio based pelletized fertilizer products, the commercial development of controlled release and biodegradable coating technologies, and the expanding integration of circular economy feedstocks such as recovered struvite, composted organic waste, and animal derived materials into pelletized fertilizer production indicate significant growth opportunities for players operating in this market.
A major trend shaping this market is the increasing integration of pelletized fertilizers with variable rate application technology and the growing utilization of circular economy feedstocks in pellet manufacturing, which is collectively broadening the addressable market and reinforcing the commercial relevance of advanced pelletized formulations across European agriculture.
Precision Agriculture and Digital Farming Drive Pelletized Fertilizer Market in Europe
Precision Agriculture and Digital Farming Integration Reshaping Fertilizer Demand Profiles
The adoption of precision agriculture technologies across European farms is primarily altering that how fertilizers are selected, applied, and managed. Farmers are increasingly deploying GPS guided variable rate spreading equipment, soil nutrient mapping platforms, and satellite based crop monitoring systems that require fertilizer inputs with predictable physical and chemical properties. Pelletized fertilizers, with their uniform particle size, consistent bulk density, and reproducible nutrient content, are particularly well suited to these precision application systems. This compatibility is translating into growing substitution of conventional prilled and bulk fertilizer formats with pelletized alternatives, especially among larger arable farms in Germany, France, and the United Kingdom.
The EU Common Agricultural Policy eco scheme framework is strengthening this trend offering financial incentives to farmers who can demonstrate through documented nutrient management practices, measurable gains in application accuracy and environmental outcomes. Pelletized fertilizers, particularly enhanced efficiency and slow release formats, align well with the documented nutrient management plans that eco scheme compliance typically requires, creating a strong policy tailwind for market growth.
Furthermore, the ongoing digitalization of agricultural input procurement, including the expanding use of farm management software and agri tech platforms, is accelerating awareness and accessibility of advanced pelletized fertilizer products, particularly among the younger generation of farm operators who are more receptive to precision input management.
Environmental Regulation Driving Structural Shift Toward Enhanced Efficiency Pelletized Formats
Shrinking environmental legislation across the European Union is creating durable structural demand for fertilizer formats that offer demonstrably superior nutrient use efficiency and reduced environmental losses compared with conventional fertilizer products. The Nitrates Directive's action programmes, which restrict nitrogen application volumes and timing across designated vulnerable zones, are incentivizing farmers to maximize the agronomic performance of each unit of applied nutrient, making slow release and controlled release pelletized fertilizers increasingly attractive from a cost benefit perspective.
The National Emission Ceilings Directive's ammonia reduction targets are further increasing the adoption of pelletized ammonium based fertilizer formats that offer lower volatilization losses compared with urea based alternatives, particularly in livestock intensive regions of the Netherlands, Belgium, Denmark, and northwestern Germany. The Farm to Fork Strategy's target of reducing overall synthetic fertilizer use by at least 20% by 2030 while maintaining food production levels is creating a clear commercial imperative for fertilizer products that can deliver equivalent or superior agronomic outcomes with lower total application rates.
Organo mineral pellets and biofertilizer pellets are well established in this regulatory environment, as they combine mineral nutrient efficiency with soil biological activity enhancement and organic matter contribution, addressing multiple sustainability criteria simultaneously.
Circular Economy Integration Expanding Feedstock Base and Sustainability Credentials
The European pelletized fertilizer industry is increasingly incorporating recovered and circular economy nutrient streams into commercial pellet production. Recovered struvite a magnesium ammonium phosphate mineral extracted from municipal wastewater and livestock effluent is gaining momentum as a high purity phosphate source, delivering both resource recovery and strong agronomic performance. At the same time, composted organic waste, digestate from anaerobic digestion, and processed animal based materials are being widely used as sources of organic matter and nutrients in organo mineral pellet formulations.
This trend is being actively supported by the EU Fertilizing Products Regulation, which has expanded the category of approved materials that can be used in CE marked fertilizing products to include a broader range of recovered and bio based nutrient streams. Several European fertilizer manufacturers are scaling up commercial scale circular feedstock pelletization facilities, reflecting both supportive regulations and rising demand for environmentally sustainable products. Incorporating these materials can also improve cost competitiveness in certain nutrients especially phosphate where primary supply remains exposed to geopolitical risks.
|
Parameters |
Details |
|
Market Size by 2036 |
USD 16,045.4 Million |
|
Market Size in 2026 |
USD 8,533.4 Million |
|
Market Size in 2025 |
USD 7,901.3 Million |
|
Revenue Growth Rate (2026–2036) |
CAGR of 6.5% |
|
Dominating Product Type |
Inorganic Pelletized Fertilizers |
|
Fastest Growing Product Type |
Biofertilizer Pellets |
|
Dominating Crop Type |
Cereals and Grains |
|
Fastest Growing Crop Type |
Fruits and Vegetables |
|
Dominating Distribution Channel |
Distributors and Dealers |
|
Fastest Growing Distribution Channel |
Online Channels |
|
Dominating Application Method |
Broadcasting |
|
Fastest Growing Application Method |
Precision Placement |
|
Dominating Geography |
Western Europe |
|
Fastest Growing Geography |
Eastern Europe |
|
Base Year |
2025 |
|
Forecast Period |
2026 to 2036 |
Based on product type, the Europe pelletized fertilizers market is segmented into inorganic pelletized fertilizers, organic pelletized fertilizers, organo mineral pellets, and biofertilizer pellets. The large share of this segment is mainly attributed to its widespread use in conventional agriculture, high nutrient concentration, and immediate availability of nutrients for crop uptake. Inorganic fertilizers, particularly nitrogen based and complex NPK pellets, are extensively used by farmers to achieve higher crop yields and ensure consistent productivity. Additionally, the well established manufacturing infrastructure, cost efficiency, and strong distribution networks further support the dominance of this segment across Europe.
However, the biofertilizer pellets segment is expected to witness the fastest growth during the forecast period. The fast growth of this segment is mainly due to increasing regulatory support for sustainable agriculture, rising demand for environmentally friendly farming inputs, and growing awareness regarding soil health and microbial activity. The European Union's emphasis on reducing chemical fertilizer usage and promoting organic and regenerative farming practices is further accelerating the adoption of biofertilizers. Moreover, advancements in microbial technologies and the expanding availability of bio based products are contributing to the rapid growth of this segment.
By Crop Type: In 2026, the Cereals and Grains Segment to Hold the Largest Share
Based on crop type, the Europe pelletized fertilizers market is segmented into cereals and grains, fruits and vegetables, oilseeds and pulses, sugar crops, turf and ornamentals, and other crop types. The large share of this segment is mainly attributed to the extensive cultivation of staple crops such as wheat, maize, and barley across Europe, which require significant and consistent fertilizer application to maintain high yields. Pelletized fertilizers are widely used in cereal farming due to their ease of application, uniform nutrient distribution, and compatibility with large scale mechanized agriculture. Additionally, the strong demand for food security and animal feed production further supports the dominance of this segment.
However, the fruits and vegetables segment is expected to witness the fastest growth during the forecast period. The fast growth of this segment is mainly due to increasing demand for high value crops, rising adoption of precision farming and controlled environment agriculture, and growing consumption of fresh produce across Europe. These crops require more targeted and efficient nutrient management, making pelletized fertilizers an ideal solution. Furthermore, the expansion of greenhouse cultivation and organic farming practices is accelerating fertilizer demand in this segment, driving its rapid growth.
By Distribution Channel: In 2026, the Distributors and Dealers Segment to Account for the Largest Share
Based on distribution channel, the Europe pelletized fertilizers market is segmented into direct sales, distributors and dealers, agricultural cooperatives, online channels, and retail outlets. The large share of this segment is mainly attributed to their extensive regional networks, strong relationships with farmers, and ability to provide a wide range of fertilizer products along with agronomic support. Distributors and dealers play a critical role in bridging manufacturers and end users, especially in countries with fragmented farming structures. Their logistical capabilities, product availability, and advisory services make them the most preferred channel for fertilizer procurement across Europe.
However, the online channels segment is expected to witness the fastest growth during the forecast period. The fast growth of this segment is mainly due to increasing digitalization in agriculture, growing adoption of e commerce platforms, and the rising preference for convenient and direct purchasing options among farmers. Digital platforms enable price transparency, product comparison, and doorstep delivery, which are particularly attractive in developed European markets. Additionally, the integration of digital tools with precision agriculture practices is further accelerating the adoption of online sales channels for fertilizers.
By Application Method: In 2026, the Broadcasting Segment to Dominate the Europe Pelletized Fertilizers Market
Based on application method, the Europe pelletized fertilizers market is segmented into broadcasting, band and strip application, precision placement, fertigation systems, and seed treatment. The large share of this segment is mainly attributed to its simplicity, cost effectiveness, and widespread use in large scale farming, particularly for cereals and grains. Broadcasting allows for quick and uniform application of fertilizers over large areas, making it highly suitable for conventional farming practices across Europe. Additionally, the availability of mechanized spreading equipment and ease of operation further support the dominance of this method.
However, the precision placement segment is expected to witness the fastest growth during the forecast period. The fast growth of this segment is mainly due to the increasing adoption of precision agriculture technologies, rising focus on optimizing fertilizer use efficiency, and the need to reduce environmental impact. Precision placement enables targeted nutrient delivery near plant roots, minimizing wastage and improving crop yield. Furthermore, stringent European regulations on nutrient runoff and sustainable farming practices are encouraging farmers to adopt more efficient and controlled fertilizer application methods, driving the growth of this segment.
Based on geography, the Europe pelletized fertilizers market is segmented into Western Europe, Southern Europe, Northern Europe, Eastern Europe, and Benelux. The large share of this region is mainly attributed to advanced agricultural practices, high adoption of precision farming technologies, and strong regulatory support for sustainable and efficient fertilizer use. Countries such as Germany, France, and the Netherlands have well established agricultural infrastructure, higher awareness regarding soil health, and a strong presence of leading fertilizer manufacturers and distributors. Additionally, the increasing shift toward controlled nutrient application and environmentally compliant farming practices further supports the dominance of this region.
However, Eastern Europe is expected to witness the fastest growth during the forecast period. The fast growth of this region is mainly due to the expansion of agricultural activities, increasing modernization of farming practices, and rising adoption of high efficiency fertilizers. Countries such as Poland, Romania, and Hungary are experiencing growing investments in agriculture, supported by EU funding and policy initiatives aimed at improving productivity and sustainability. Furthermore, the relatively lower current penetration of advanced fertilizers compared to Western Europe presents significant growth opportunities, driving the rapid expansion of the market in this region.
The competitive landscape of the Europe pelletized fertilizers market is shaped by technological innovation in pelletization processes, portfolio diversification toward enhanced efficiency and bio based products, geographic expansion, and strategic collaborations across the agricultural input value chain.
Yara International ASA holds a leading position in the European market through its broad range of nitrogen based and specialty pelletized fertilizer products, combined with its extensive digital farming and precision nutrition platforms. ICL Group Ltd. maintains a strong market presence through its diverse portfolio spanning complex NPK fertilizers, specialty plant nutrition products, and controlled release formulations serving multiple crop and application segments across Europe.
In addition, K+S AG and EuroChem Group AG hold string positions through their established potash based and multi nutrient pelletized product lines, while companies including Borealis AG, through Rosier SA, and Grupa Azoty S.A. reinforce their market standing through European manufacturing scale and established distribution relationships. Specialty players such as COMPO EXPERT GmbH, Van Iperen International B.V., and ILSA S.p.A. are advancing differentiated product lines targeting high value horticulture, organic farming, and bio based fertilizer segments, which are among the fastest growing categories within the overall European pelletized fertilizers market.
The report provides a comprehensive competitive analysis based on an extensive assessment of the leading players' product portfolios, geographic presence, financial strength, and key growth strategies adopted over the last few years.
Some of the key players operating in the Europe pelletized fertilizers market include Yara International ASA (Norway), ICL Group Ltd. (Israel), K+S AG (Germany), Borealis AG (Austria), Grupa Azoty S.A. (Poland), OCI N.V. (Netherlands), EuroChem Group AG (Switzerland), Fertiberia S.A. (Spain), Rosier SA (Belgium), BASF SE Agricultural Solutions (Germany), Van Iperen International B.V. (Netherlands), Haifa Group (Israel), COMPO EXPERT GmbH (Germany), Frayssinet SAS (France), ILSA S.p.A. (Italy), De Sangosse SAS (France), Koppert Biological Systems (Netherlands), Agrium Europe/Nutrien (Canada), and SKW Stickstoffwerke Piesteritz GmbH (Germany), among others.
The Europe pelletized fertilizers market is expected to reach USD 16,045.4 million by 2036 from an estimated USD 8,533.4 million in 2026, at a CAGR of 6.5% during the forecast period 2026–2036.
In 2026, the inorganic pelletized fertilizers segment is expected to hold the largest share of 56.9% of the Europe pelletized fertilizers market, driven by the widespread use of nitrogen based and complex NPK pellets in conventional agriculture and their compatibility with large scale mechanized farming operations.
The biofertilizer pellets segment is expected to register the highest CAGR of 9.1% during the forecast period 2026–2036, driven by increasing regulatory support for sustainable agriculture and growing adoption of microbial and bio based fertilizer technologies.
In 2026, the cereals and grains segment is expected to hold the largest share in the Europe pelletized fertilizers market, driven by the extensive cultivation of wheat, maize, and barley across Europe and the strong compatibility of pelletized fertilizers with large scale mechanized cereal farming.
In 2026, the broadcasting segment is expected to hold the largest share in the Europe pelletized fertilizers market, driven by its simplicity, cost effectiveness, and widespread adoption in large scale cereal and grain farming across Europe.
The growth of this market is primarily driven by the growing adoption of precision agriculture and digital farming technologies compatible with pelletized nutrient formats, the EU Common Agricultural Policy eco scheme incentives for documented precision nutrient management, and tightening environmental regulations under the Nitrates Directive, the National Emission Ceilings Directive, and the Farm to Fork Strategy that collectively create structural incentives for enhanced efficiency and slow release pelletized fertilizer adoption.
Key players operating in the Europe pelletized fertilizers market include Yara International ASA, ICL Group Ltd., K+S AG, Borealis AG, Grupa Azoty S.A., OCI N.V., EuroChem Group AG, Fertiberia S.A., Rosier SA, BASF SE Agricultural Solutions, Van Iperen International B.V., Haifa Group, COMPO EXPERT GmbH, Frayssinet SAS, ILSA S.p.A., De Sangosse SAS, Koppert Biological Systems, Agrium Europe (Nutrien), and SKW Stickstoffwerke Piesteritz GmbH, among others.
Eastern Europe is expected to register the highest growth rate in the Europe pelletized fertilizers market during the forecast period 2026–2036, driven by the rapid modernization of farming practices, growing EU funded agricultural investments, and the significant untapped potential for advanced pelletized fertilizer adoption in countries such as Poland, Romania, and Hungary.
1. INTRODUCTION
1.1. Market Definition & Scope
1.2. Currency & Limitations
2. RESEARCH METHODOLOGY
2.1. Research Approach
2.2. Data Collection & Validation
2.2.1. Secondary Research
2.2.2. Primary Research
2.3. Market Assessment
2.3.1. Market Size Estimation
2.3.2. Bottom-Up Approach
2.3.3. Top-Down Approach
2.3.4. Growth Forecast
2.4. Assumptions for the Study
3. EXECUTIVE SUMMARY
4. MARKET INSIGHTS
4.1. Overview
4.2. Drivers
4.2.1. Precision Agriculture Adoption and Digital Farming Integration
4.2.2. EU Common Agricultural Policy Eco-Schemes and Green Payments
4.2.3. Environmental Regulations Driving Nutrient Efficiency Requirements
4.2.4. Farm to Fork Strategy Sustainable Intensification Goals
4.2.5. Labor Shortage and Mechanization Trends
4.3. Restraints
4.3.1. Higher Production Costs Compared to Conventional Fertilizers
4.3.2. Infrastructure Requirements for Handling and Application
4.3.3. Energy Costs Impacting Pelletization Processes
4.3.4. Raw Material Price Volatility
4.4. Opportunities
4.4.1. Organic and Bio-Based Pelletized Fertilizer Growth
4.4.2. Controlled-Release and Enhanced-Efficiency Products
4.4.3. Carbon Farming and Soil Health Initiatives
4.4.4. Export Opportunities to Emerging Markets
4.5. Trends
4.5.1. Integration with Variable-Rate Application Technology
4.5.2. Biodegradable Coating Development
4.5.3. Circular Economy Feedstock Utilization
4.5.4. Customized Formulations for Specific Crops and Soils
4.6. Challenges
4.6.1. Meeting Diverse Regulatory Requirements Across Countries
4.6.2. Competition from Liquid Fertilizers in Certain Applications
4.6.3. Storage and Handling Moisture Sensitivity
4.7. Porter’s Five Forces Analysis
4.7.1. Bargaining Power of Suppliers
4.7.2. Bargaining Power of Buyers
4.7.3. Threat of Substitutes
4.7.4. Threat of New Entrants
4.7.5. Degree of Competition
4.8. Regulatory Impact on Europe Pelletized Fertilizers Market
4.8.1. EU Fertilizing Products Regulation (2019/1009)
4.8.1.1. CE Marking Requirements and Standards
4.8.1.2. Product Function Categories and Specifications
4.8.1.3. Contaminant Limits and Safety Requirements
4.8.2. Environmental Directives
4.8.2.1. Nitrates Directive Implementation
4.8.2.2. Water Framework Directive Compliance
4.8.2.3. National Emission Ceilings Directive
4.8.3. CAP Strategic Plans
4.8.3.1. Eco-Scheme Requirements by Country
4.8.3.2. Nutrient Management Planning Obligations
4.8.3.3. Organic Farming Support Measures
5. IMPACT OF SUSTAINABILITY ON EUROPE PELLETIZED FERTILIZERS MARKET
5.1. Carbon Footprint Reduction Through Efficient Nutrient Use
5.2. Contribution to EU Climate Neutrality 2050 Targets
5.3. Soil Health Improvement and Carbon Sequestration
5.4. Water Quality Protection Through Reduced Runoff
5.5. Biodiversity Preservation in Agricultural Landscapes
5.6. Circular Economy Integration with Organic Waste Streams
5.7. Sustainable Intensification Enabling Land Use Efficiency
6. EUROPE PELLETIZED FERTILIZERS MARKET, BY PRODUCT TYPE
6.1. Overview
6.2. Inorganic Pelletized Fertilizers
6.2.1. Nitrogen-Based Pellets
6.2.2. Phosphate-Based Pellets
6.2.3. Potash-Based Pellets
6.2.4. Complex NPK Pellets
6.3. Organic Pelletized Fertilizers
6.3.1. Plant-Based Pellets
6.3.2. Animal-Based Pellets
6.3.3. Compost Pellets
6.4. Biofertilizer Pellets
6.4.1. Microbial-Enriched Pellets
6.4.2. Mycorrhizal Pellets
6.5. Organo-Mineral Pellets
7. EUROPE PELLETIZED FERTILIZERS MARKET, BY CROP TYPE
7.1. Overview
7.2. Cereals & Grains
7.2.1. Wheat
7.2.2. Corn/Maize
7.2.3. Barley
7.2.4. Others
7.3. Fruits & Vegetables
7.3.1. Field Vegetables
7.3.2. Greenhouse Crops
7.3.3. Orchards
7.4. Oilseeds & Pulses
7.4.1. Rapeseed
7.4.2. Sunflower
7.4.3. Soybeans
7.5. Sugar Crops
7.6. Turf & Ornamentals
7.7. Others
8. EUROPE PELLETIZED FERTILIZERS MARKET, BY APPLICATION METHOD
8.1. Overview
8.2. Broadcasting
8.3. Band/Strip Application
8.4. Precision Placement
9. EUROPE PELLETIZED FERTILIZERS MARKET, BY DISTRIBUTION CHANNEL
9.1. Overview
9.2. Direct Sales
9.3. Distributors and Dealers
9.4. Agricultural Cooperatives
9.5. Online Channels
9.6. Retail Outlets
10. EUROPE PELLETIZED FERTILIZERS MARKET ASSESSMENT, BY COUNTRY/REGION
10.1. Overview
10.2. Western Europe
10.2.1. Germany
10.2.2. France
10.2.3. United Kingdom
10.2.4. Netherlands
10.2.5. Belgium
10.2.6. Austria
10.2.7. Switzerland
10.2.8. Luxembourg
10.2.9. Rest of Western Europe
10.3. Southern Europe
10.3.1. Italy
10.3.2. Spain
10.3.3. Portugal
10.3.4. Greece
10.3.5. Rest of Southern Europe
10.4. Northern Europe
10.4.1. Sweden
10.4.2. Denmark
10.4.3. Finland
10.4.4. Norway
10.4.5. Rest of Northern Europe
10.5. Eastern Europe
10.5.1. Poland
10.5.2. Czech Republic
10.5.3. Romania
10.5.4. Hungary
10.5.5. Rest of Eastern Europe
11. COMPETITIVE LANDSCAPE
11.1. Introduction
11.2. Competitive Benchmarking
11.3. Competitive Dashboard
11.3.1. Industry Leaders
11.3.2. Market Differentiators
11.3.3. Vanguards
11.3.4. Emerging Companies
11.4. Market Share/Position Analysis
12. COMPANY PROFILES
12.1. Yara International ASA
12.1.1. Company Overview
12.1.2. Financial Overview
12.1.3. Product Portfolio
12.1.4. Strategic Developments
12.1.5. SWOT Analysis
12.2. ICL Group Ltd.
12.2.1. Company Overview
12.2.2. Financial Overview
12.2.3. Product Portfolio
12.2.4. SWOT Analysis
12.3. K+S AG
12.3.1. Company Overview
12.3.2. Financial Overview
12.3.3. Product Portfolio
12.3.4. SWOT Analysis
12.4. Borealis AG
12.4.1. Company Overview
12.4.2. Product Portfolio
12.4.3. Strategic Developments
12.4.4. SWOT Analysis
12.5. Grupa Azoty S.A.
12.5.1. Company Overview
12.5.2. Financial Overview
12.5.3. Product Portfolio
12.5.4. Strategic Developments
12.5.5. SWOT Analysis
12.6. OCI N.V.
12.6.1. Company Overview
12.6.2. Financial Overview
12.6.3. Product Portfolio
12.6.4. SWOT Analysis
12.7. EuroChem Group AG
12.7.1. Company Overview
12.7.2. Product Portfolio
12.7.3. SWOT Analysis
12.8. Fertiberia S.A.
12.8.1. Company Overview
12.8.2. Product Portfolio
12.8.3. SWOT Analysis
12.9. Rosier SA (Borealis)
12.9.1. Company Overview
12.9.2. Product Portfolio
12.9.3. SWOT Analysis
12.10. BASF SE
12.10.1. Company Overview
12.10.2. Financial Overview
12.10.3. Product Portfolio
12.10.4. SWOT Analysis
12.11. Van Iperen International B.V.
12.11.1. Company Overview
12.11.2. Product Portfolio
12.11.3. SWOT Analysis
12.12. Haifa Group
12.12.1. Company Overview
12.12.2. Product Portfolio
12.12.3. SWOT Analysis
12.13. Compo Expert GmbH
12.13.1. Company Overview
12.13.2. Product Portfolio
12.13.3. SWOT Analysis
12.14. Frayssinet SAS
12.14.1. Company Overview
12.14.2. Product Portfolio
12.14.3. SWOT Analysis
12.15. Ilsa S.p.A.
12.15.1. Company Overview
12.15.2. Product Portfolio
12.15.3. SWOT Analysis
12.16. De Sangosse SAS
12.16.1. Company Overview
12.16.2. Product Portfolio
12.16.3. SWOT Analysis
12.17. Koppert Biological Systems
12.17.1. Company Overview
12.17.2. Product Portfolio
12.17.3. SWOT Analysis
12.18. Agrium Europe
12.18.1. Company Overview
12.18.2. Product Portfolio
12.18.3. SWOT Analysis
12.19. SKW Stickstoffwerke Piesteritz GmbH
12.19.1. Company Overview
12.19.2. Product Portfolio
12.19.3. SWOT Analysis
13. APPENDIX
13.1. Available Customization
13.2. Related Reports
LIST OF TABLES
Table 1. Europe Pelletized Fertilizers Market Drivers: Impact Analysis (2026–2036)
Table 2. Europe Pelletized Fertilizers Market Restraints: Impact Analysis (2026–2036)
Table 3. Europe Pelletized Fertilizers Market Opportunities: Impact Analysis (2026–2036)
Table 4. Europe Pelletized Fertilizers Market Trends: Impact Analysis (2026–2036)
Table 5. Europe Pelletized Fertilizers Market Challenges: Impact Analysis (2026–2036)
Table 6. Europe Pelletized Fertilizers Market – Porter’s Five Forces Summary (2025–2026)
Table 7. Europe Pelletized Fertilizers Market, By Product Type, 2024–2036 (USD Million)
Table 8. Europe Inorganic Pelletized Fertilizers Market, By Type, 2024–2036 (USD Million)
Table 9. Europe Inorganic Pelletized Fertilizers Market, By Country, 2024–2036 (USD Million)
Table 10. Europe Nitrogen-Based Pellets Market, By Country, 2024–2036 (USD Million)
Table 11. Europe Phosphate-Based Pellets Market, By Country, 2024–2036 (USD Million)
Table 12. Europe Potash-Based Pellets Market, By Country, 2024–2036 (USD Million)
Table 13. Europe Complex NPK Pellets Market, By Country, 2024–2036 (USD Million)
Table 14. Europe Organic Pelletized Fertilizers Market, By Type, 2024–2036 (USD Million)
Table 15. Europe Organic Pelletized Fertilizers Market, By Country, 2024–2036 (USD Million)
Table 16. Europe Plant-Based Pellets Market, By Country, 2024–2036 (USD Million)
Table 17. Europe Animal-Based Pellets Market, By Country, 2024–2036 (USD Million)
Table 18. Europe Compost Pellets Market, By Country, 2024–2036 (USD Million)
Table 19. Europe Biofertilizer Pellets Market, By Type, 2024–2036 (USD Million)
Table 20. Europe Biofertilizer Pellets Market, By Country, 2024–2036 (USD Million)
Table 21. Europe Microbial-Enriched Pellets Market, By Country, 2024–2036 (USD Million)
Table 22. Europe Mycorrhizal Pellets Market, By Country, 2024–2036 (USD Million)
Table 23. Europe Organo-Mineral Pellets Market, By Country, 2024–2036 (USD Million)
Table 24. Europe Pelletized Fertilizers Market, By Crop Type, 2024–2036 (USD Million)
Table 25. Europe Pelletized Fertilizers Market for Cereals and Grains, By Type, 2024–2036 (USD Million)
Table 26. Europe Pelletized Fertilizers Market for Cereals & Grains, By Country, 2024–2036 (USD Million)
Table 27. Europe Pelletized Fertilizers Market for Wheat, By Country, 2024–2036 (USD Million)
Table 28. Europe Pelletized Fertilizers Market for Corn/Maize, By Country, 2024–2036 (USD Million)
Table 29. Europe Pelletized Fertilizers Market for Barley, By Country, 2024–2036 (USD Million)
Table 30. Europe Pelletized Fertilizers Market for Others Segment, By Country, 2024–2036 (USD Million)
Table 31. Europe Pelletized Fertilizers Market for Fruits and Vegetables, By Type, 2024–2036 (USD Million)
Table 32. Europe Pelletized Fertilizers Market for Fruits & Vegetables, By Country, 2024–2036 (USD Million)
Table 33. Europe Pelletized Fertilizers Market for Field Vegetables, By Country, 2024–2036 (USD Million)
Table 34. Europe Pelletized Fertilizers Market for Greenhouse Crops, By Country, 2024–2036 (USD Million)
Table 35. Europe Pelletized Fertilizers Market for Orchards, By Country, 2024–2036 (USD Million)
Table 36. Europe Pelletized Fertilizers Market for Oilseeds & Pulses, By Country, 2024–2036 (USD Million)
Table 37. Europe Pelletized Fertilizer for Oilseeds and Pulses Market, By Type, 2024–2036 (USD Million)
Table 38. Europe Pelletized Fertilizers Market for Rapeseed, By Country, 2024–2036 (USD Million)
Table 39. Europe Pelletized Fertilizers Market for Sunflower, By Country, 2024–2036 (USD Million)
Table 40. Europe Pelletized Fertilizers Market for Soybeans, By Country, 2024–2036 (USD Million)
Table 41. Europe Pelletized Fertilizers Market for Sugar Crops, By Country, 2024–2036 (USD Million)
Table 42. Europe Pelletized Fertilizers Market for Turf & Ornamentals, By Country, 2024–2036 (USD Million)
Table 43. Europe Pelletized Fertilizers Market for Other Crops, By Country, 2024–2036 (USD Million)
Table 44. Europe Pelletized Fertilizers Market, By Application, 2024–2036 (USD Million)
Table 45. Europe Pelletized Fertilizers Market for Broadcasting, By Country, 2024–2036 (USD Million)
Table 46. Europe Pelletized Fertilizers Market for Band / Strip Application, By Country, 2024–2036 (USD Million)
Table 47. Europe Pelletized Fertilizers Market for Precision Placement, By Country, 2024–2036 (USD Million)
Table 48. Europe Pelletized Fertilizers Market, By Distribution Channel, 2024–2036 (USD Million)
Table 49. Europe Pelletized Fertilizers Market for Direct Sales, By Country, 2024–2036 (USD Million)
Table 50. Europe Pelletized Fertilizers Market for Distributors & Dealers, By Country, 2024–2036 (USD Million)
Table 51. Europe Pelletized Fertilizers Market for Agricultural Cooperatives, By Country, 2024–2036 (USD Million)
Table 52. Europe Pelletized Fertilizers Market for Online Channels, By Country, 2024–2036 (USD Million)
Table 53. Europe Pelletized Fertilizers Market for Retail Outlets, By Country, 2024–2036 (USD Million)
Table 54. Europe Food Waste Recycling Market, By Region, 2023–2035 (USD Million)
Table 55. Western Europe: Pelletized Fertilizer Market, By Country, 2023–2035 (USD Million)
Table 56. Western Europe: Pelletized Fertilizer Market, By Product Type, 2024–2036 (USD Million)
Table 57. Western Europe: Inorganic Pelletized Fertilizer Market, By Type, 2024–2036 (USD Million)
Table 58. Western Europe: Organic Pelletized Fertilizer Market, By Type, 2024–2036 (USD Million)
Table 59. Western Europe: Biofertilizer Pellets Market, By Type, 2024–2036 (USD Million)
Table 60. Western Europe: Pelletized Fertilizer Market, By Crop Type, 2024–2036 (USD Million)
Table 61. Western Europe: Pelletized Fertilizer Market for Cereals and Grains, By Type, 2024–2036 (USD Million)
Table 62. Western Europe: Pelletized Fertilizer Market for Fruits and Vegetables, By Type, 2024–2036 (USD Million)
Table 63. Western Europe: Pelletized Fertilizer for Oilseeds and Pulses Market, By Type, 2024–2036 (USD Million)
Table 64. Western Europe: Pelletized Fertilizer Market, By Distribution Channel, 2024–2036 (USD Million)
Table 65. Western Europe: Pelletized Fertilizer Market, By Application, 2024–2036 (USD Million)
Table 66. Germany: Pelletized Fertilizer Market, By Product Type, 2024–2036 (USD Million)
Table 67. Germany: Inorganic Pelletized Fertilizer Market, By Type, 2024–2036 (USD Million)
Table 68. Germany: Organic Pelletized Fertilizer Market, By Type, 2024–2036 (USD Million)
Table 69. Germany Biofertilizer Pellets Market, By Type, 2024–2036 (USD Million)
Table 70. Germany: Pelletized Fertilizer Market, By Crop Type, 2024–2036 (USD Million)
Table 71. Germany: Pelletized Fertilizer Market for Cereals and Grains, By Type, 2024–2036 (USD Million)
Table 72. Germany: Pelletized Fertilizer Market for Fruits and Vegetables, By Type, 2024–2036 (USD Million)
Table 73. Germany: Pelletized Fertilizer for Oilseeds and Pulses Market, By Type, 2024–2036 (USD Million)
Table 74. Germany: Pelletized Fertilizer Market, By Distribution Channel, 2024–2036 (USD Million)
Table 75. Germany: Pelletized Fertilizer Market, By Application, 2024–2036 (USD Million)
Table 76. France: Pelletized Fertilizer Market, By Product Type, 2024–2036 (USD Million)
Table 77. France: Inorganic Pelletized Fertilizer Market, By Type, 2024–2036 (USD Million)
Table 78. France: Organic Pelletized Fertilizer Market, By Type, 2024–2036 (USD Million)
Table 79. France Biofertilizer Pellets Market, By Type, 2024–2036 (USD Million)
Table 80. France: Pelletized Fertilizer Market, By Crop Type, 2024–2036 (USD Million)
Table 81. France: Pelletized Fertilizer Market for Cereals and Grains, By Type, 2024–2036 (USD Million)
Table 82. France: Pelletized Fertilizer Market for Fruits and Vegetables, By Type, 2024–2036 (USD Million)
Table 83. France: Pelletized Fertilizer for Oilseeds and Pulses Market, By Type, 2024–2036 (USD Million)
Table 84. France: Pelletized Fertilizer Market, By Distribution Channel, 2024–2036 (USD Million)
Table 85. France: Pelletized Fertilizer Market, By Application, 2024–2036 (USD Million)
Table 86. U.K.: Pelletized Fertilizer Market, By Product Type, 2024–2036 (USD Million)
Table 87. U.K.: Inorganic Pelletized Fertilizer Market, By Type, 2024–2036 (USD Million)
Table 88. U.K.: Organic Pelletized Fertilizer Market, By Type, 2024–2036 (USD Million)
Table 89. U.K. Biofertilizer Pellets Market, By Type, 2024–2036 (USD Million)
Table 90. U.K.: Pelletized Fertilizer Market, By Crop Type, 2024–2036 (USD Million)
Table 91. U.K.: Pelletized Fertilizer Market for Cereals and Grains, By Type, 2024–2036 (USD Million)
Table 92. U.K.: Pelletized Fertilizer Market for Fruits and Vegetables, By Type, 2024–2036 (USD Million)
Table 93. U.K.: Pelletized Fertilizer for Oilseeds and Pulses Market, By Type, 2024–2036 (USD Million)
Table 94. U.K.: Pelletized Fertilizer Market, By Distribution Channel, 2024–2036 (USD Million)
Table 95. U.K.: Pelletized Fertilizer Market, By Application, 2024–2036 (USD Million)
Table 96. Netherlands: Pelletized Fertilizer Market, By Product Type, 2024–2036 (USD Million)
Table 97. Netherlands: Inorganic Pelletized Fertilizer Market, By Type, 2024–2036 (USD Million)
Table 98. Netherlands: Organic Pelletized Fertilizer Market, By Type, 2024–2036 (USD Million)
Table 99. Netherlands Biofertilizer Pellets Market, By Type, 2024–2036 (USD Million)
Table 100. Netherlands: Pelletized Fertilizer Market, By Crop Type, 2024–2036 (USD Million)
Table 101. Netherlands: Pelletized Fertilizer Market for Cereals and Grains, By Type, 2024–2036 (USD Million)
Table 102. Netherlands: Pelletized Fertilizer Market for Fruits and Vegetables, By Type, 2024–2036 (USD Million)
Table 103. Netherlands: Pelletized Fertilizer for Oilseeds and Pulses Market, By Type, 2024–2036 (USD Million)
Table 104. Netherlands: Pelletized Fertilizer Market, By Distribution Channel, 2024–2036 (USD Million)
Table 105. Netherlands: Pelletized Fertilizer Market, By Application, 2024–2036 (USD Million)
Table 106. Belgium: Pelletized Fertilizer Market, By Product Type, 2024–2036 (USD Million)
Table 107. Belgium: Inorganic Pelletized Fertilizer Market, By Type, 2024–2036 (USD Million)
Table 108. Belgium: Organic Pelletized Fertilizer Market, By Type, 2024–2036 (USD Million)
Table 109. Belgium Biofertilizer Pellets Market, By Type, 2024–2036 (USD Million)
Table 110. Belgium: Pelletized Fertilizer Market, By Crop Type, 2024–2036 (USD Million)
Table 111. Belgium: Pelletized Fertilizer Market for Cereals and Grains, By Type, 2024–2036 (USD Million)
Table 112. Belgium: Pelletized Fertilizer Market for Fruits and Vegetables, By Type, 2024–2036 (USD Million)
Table 113. Belgium: Pelletized Fertilizer for Oilseeds and Pulses Market, By Type, 2024–2036 (USD Million)
Table 114. Belgium: Pelletized Fertilizer Market, By Distribution Channel, 2024–2036 (USD Million)
Table 115. Belgium: Pelletized Fertilizer Market, By Application, 2024–2036 (USD Million)
Table 116. Austria: Pelletized Fertilizer Market, By Product Type, 2024–2036 (USD Million)
Table 117. Austria: Inorganic Pelletized Fertilizer Market, By Type, 2024–2036 (USD Million)
Table 118. Austria: Organic Pelletized Fertilizer Market, By Type, 2024–2036 (USD Million)
Table 119. Austria Biofertilizer Pellets Market, By Type, 2024–2036 (USD Million)
Table 120. Austria: Pelletized Fertilizer Market, By Crop Type, 2024–2036 (USD Million)
Table 121. Austria: Pelletized Fertilizer Market for Cereals and Grains, By Type, 2024–2036 (USD Million)
Table 122. Austria: Pelletized Fertilizer Market for Fruits and Vegetables, By Type, 2024–2036 (USD Million)
Table 123. Austria: Pelletized Fertilizer for Oilseeds and Pulses Market, By Type, 2024–2036 (USD Million)
Table 124. Austria: Pelletized Fertilizer Market, By Distribution Channel, 2024–2036 (USD Million)
Table 125. Austria: Pelletized Fertilizer Market, By Application, 2024–2036 (USD Million)
Table 126. Switzerland: Pelletized Fertilizer Market, By Product Type, 2024–2036 (USD Million)
Table 127. Switzerland: Inorganic Pelletized Fertilizer Market, By Type, 2024–2036 (USD Million)
Table 128. Switzerland: Organic Pelletized Fertilizer Market, By Type, 2024–2036 (USD Million)
Table 129. Switzerland Biofertilizer Pellets Market, By Type, 2024–2036 (USD Million)
Table 130. Switzerland: Pelletized Fertilizer Market, By Crop Type, 2024–2036 (USD Million)
Table 131. Switzerland: Pelletized Fertilizer Market for Cereals and Grains, By Type, 2024–2036 (USD Million)
Table 132. Switzerland: Pelletized Fertilizer Market for Fruits and Vegetables, By Type, 2024–2036 (USD Million)
Table 133. Switzerland: Pelletized Fertilizer for Oilseeds and Pulses Market, By Type, 2024–2036 (USD Million)
Table 134. Switzerland: Pelletized Fertilizer Market, By Distribution Channel, 2024–2036 (USD Million)
Table 135. Switzerland: Pelletized Fertilizer Market, By Application, 2024–2036 (USD Million)
Table 136. Luxembourg: Pelletized Fertilizer Market, By Product Type, 2024–2036 (USD Million)
Table 137. Luxembourg: Inorganic Pelletized Fertilizer Market, By Type, 2024–2036 (USD Million)
Table 138. Luxembourg: Organic Pelletized Fertilizer Market, By Type, 2024–2036 (USD Million)
Table 139. Luxembourg Biofertilizer Pellets Market, By Type, 2024–2036 (USD Million)
Table 140. Luxembourg: Pelletized Fertilizer Market, By Crop Type, 2024–2036 (USD Million)
Table 141. Luxembourg: Pelletized Fertilizer Market for Cereals and Grains, By Type, 2024–2036 (USD Million)
Table 142. Luxembourg: Pelletized Fertilizer Market for Fruits and Vegetables, By Type, 2024–2036 (USD Million)
Table 143. Luxembourg: Pelletized Fertilizer for Oilseeds and Pulses Market, By Type, 2024–2036 (USD Million)
Table 144. Luxembourg: Pelletized Fertilizer Market, By Distribution Channel, 2024–2036 (USD Million)
Table 145. Luxembourg: Pelletized Fertilizer Market, By Application, 2024–2036 (USD Million)
Table 146. Rest of Western Europe: Pelletized Fertilizer Market, By Product Type, 2024–2036 (USD Million)
Table 147. Rest of Western Europe: Inorganic Pelletized Fertilizer Market, By Type, 2024–2036 (USD Million)
Table 148. Rest of Western Europe: Organic Pelletized Fertilizer Market, By Type, 2024–2036 (USD Million)
Table 149. Rest of Western Europe Biofertilizer Pellets Market, By Type, 2024–2036 (USD Million)
Table 150. Rest of Western Europe: Pelletized Fertilizer Market, By Crop Type, 2024–2036 (USD Million)
Table 151. Rest of Western Europe: Pelletized Fertilizer Market for Cereals and Grains, By Type, 2024–2036 (USD Million)
Table 152. Rest of Western Europe: Pelletized Fertilizer Market for Fruits and Vegetables, By Type, 2024–2036 (USD Million)
Table 153. Rest of Western Europe: Pelletized Fertilizer for Oilseeds and Pulses Market, By Type, 2024–2036 (USD Million)
Table 154. Rest of Western Europe: Pelletized Fertilizer Market, By Distribution Channel, 2024–2036 (USD Million)
Table 155. Rest of Western Europe: Pelletized Fertilizer Market, By Application, 2024–2036 (USD Million)
Table 156. Southern Europe: Pelletized Fertilizer Market, By Country, 2023–2035 (USD Million)
Table 157. Southern Europe: Pelletized Fertilizer Market, By Product Type, 2024–2036 (USD Million)
Table 158. Southern Europe: Inorganic Pelletized Fertilizer Market, By Type, 2024–2036 (USD Million)
Table 159. Southern Europe: Organic Pelletized Fertilizer Market, By Type, 2024–2036 (USD Million)
Table 160. Southern Europe Biofertilizer Pellets Market, By Type, 2024–2036 (USD Million)
Table 161. Southern Europe: Pelletized Fertilizer Market, By Crop Type, 2024–2036 (USD Million)
Table 162. Southern Europe: Pelletized Fertilizer Market for Cereals and Grains, By Type, 2024–2036 (USD Million)
Table 163. Southern Europe: Pelletized Fertilizer Market for Fruits and Vegetables, By Type, 2024–2036 (USD Million)
Table 164. Southern Europe: Pelletized Fertilizer for Oilseeds and Pulses Market, By Type, 2024–2036 (USD Million)
Table 165. Southern Europe: Pelletized Fertilizer Market, By Distribution Channel, 2024–2036 (USD Million)
Table 166. Southern Europe: Pelletized Fertilizer Market, By Application, 2024–2036 (USD Million)
Table 167. Italy: Pelletized Fertilizer Market, By Product Type, 2024–2036 (USD Million)
Table 168. Italy: Inorganic Pelletized Fertilizer Market, By Type, 2024–2036 (USD Million)
Table 169. Italy: Organic Pelletized Fertilizer Market, By Type, 2024–2036 (USD Million)
Table 170. Italy Biofertilizer Pellets Market, By Type, 2024–2036 (USD Million)
Table 171. Italy: Pelletized Fertilizer Market, By Crop Type, 2024–2036 (USD Million)
Table 172. Italy: Pelletized Fertilizer Market for Cereals and Grains, By Type, 2024–2036 (USD Million)
Table 173. Italy: Pelletized Fertilizer Market for Fruits and Vegetables, By Type, 2024–2036 (USD Million)
Table 174. Italy: Pelletized Fertilizer for Oilseeds and Pulses Market, By Type, 2024–2036 (USD Million)
Table 175. Italy: Pelletized Fertilizer Market, By Distribution Channel, 2024–2036 (USD Million)
Table 176. Italy: Pelletized Fertilizer Market, By Application, 2024–2036 (USD Million)
Table 177. Spain: Pelletized Fertilizer Market, By Product Type, 2024–2036 (USD Million)
Table 178. Spain: Inorganic Pelletized Fertilizer Market, By Type, 2024–2036 (USD Million)
Table 179. Spain: Organic Pelletized Fertilizer Market, By Type, 2024–2036 (USD Million)
Table 180. Spain Biofertilizer Pellets Market, By Type, 2024–2036 (USD Million)
Table 181. Spain: Pelletized Fertilizer Market, By Crop Type, 2024–2036 (USD Million)
Table 182. Spain: Pelletized Fertilizer Market for Cereals and Grains, By Type, 2024–2036 (USD Million)
Table 183. Spain: Pelletized Fertilizer Market for Fruits and Vegetables, By Type, 2024–2036 (USD Million)
Table 184. Spain: Pelletized Fertilizer for Oilseeds and Pulses Market, By Type, 2024–2036 (USD Million)
Table 185. Spain: Pelletized Fertilizer Market, By Distribution Channel, 2024–2036 (USD Million)
Table 186. Spain: Pelletized Fertilizer Market, By Application, 2024–2036 (USD Million)
Table 187. Portugal: Pelletized Fertilizer Market, By Product Type, 2024–2036 (USD Million)
Table 188. Portugal: Inorganic Pelletized Fertilizer Market, By Type, 2024–2036 (USD Million)
Table 189. Portugal: Organic Pelletized Fertilizer Market, By Type, 2024–2036 (USD Million)
Table 190. Portugal Biofertilizer Pellets Market, By Type, 2024–2036 (USD Million)
Table 191. Portugal: Pelletized Fertilizer Market, By Crop Type, 2024–2036 (USD Million)
Table 192. Portugal: Pelletized Fertilizer Market for Cereals and Grains, By Type, 2024–2036 (USD Million)
Table 193. Portugal: Pelletized Fertilizer Market for Fruits and Vegetables, By Type, 2024–2036 (USD Million)
Table 194. Portugal: Pelletized Fertilizer for Oilseeds and Pulses Market, By Type, 2024–2036 (USD Million)
Table 195. Portugal: Pelletized Fertilizer Market, By Distribution Channel, 2024–2036 (USD Million)
Table 196. Portugal: Pelletized Fertilizer Market, By Application, 2024–2036 (USD Million)
Table 197. Greece: Pelletized Fertilizer Market, By Product Type, 2024–2036 (USD Million)
Table 198. Greece: Inorganic Pelletized Fertilizer Market, By Type, 2024–2036 (USD Million)
Table 199. Greece: Organic Pelletized Fertilizer Market, By Type, 2024–2036 (USD Million)
Table 200. Greece Biofertilizer Pellets Market, By Type, 2024–2036 (USD Million)
Table 201. Greece: Pelletized Fertilizer Market, By Crop Type, 2024–2036 (USD Million)
Table 202. Greece: Pelletized Fertilizer Market for Cereals and Grains, By Type, 2024–2036 (USD Million)
Table 203. Greece: Pelletized Fertilizer Market for Fruits and Vegetables, By Type, 2024–2036 (USD Million)
Table 204. Greece: Pelletized Fertilizer for Oilseeds and Pulses Market, By Type, 2024–2036 (USD Million)
Table 205. Greece: Pelletized Fertilizer Market, By Distribution Channel, 2024–2036 (USD Million)
Table 206. Greece: Pelletized Fertilizer Market, By Application, 2024–2036 (USD Million)
Table 207. Rest of Southern Europe: Pelletized Fertilizer Market, By Product Type, 2024–2036 (USD Million)
Table 208. Rest of Southern Europe: Inorganic Pelletized Fertilizer Market, By Type, 2024–2036 (USD Million)
Table 209. Rest of Southern Europe: Organic Pelletized Fertilizer Market, By Type, 2024–2036 (USD Million)
Table 210. Rest of Southern Europe Biofertilizer Pellets Market, By Type, 2024–2036 (USD Million)
Table 211. Rest of Southern Europe: Pelletized Fertilizer Market, By Crop Type, 2024–2036 (USD Million)
Table 212. Rest of Southern Europe: Pelletized Fertilizer Market for Cereals and Grains, By Type, 2024–2036 (USD Million)
Table 213. Rest of Southern Europe: Pelletized Fertilizer Market for Fruits and Vegetables, By Type, 2024–2036 (USD Million)
Table 214. Rest of Southern Europe: Pelletized Fertilizer for Oilseeds and Pulses Market, By Type, 2024–2036 (USD Million)
Table 215. Rest of Southern Europe: Pelletized Fertilizer Market, By Distribution Channel, 2024–2036 (USD Million)
Table 216. Rest of Southern Europe: Pelletized Fertilizer Market, By Application, 2024–2036 (USD Million)
Table 217. Northern Europe: Pelletized Fertilizer Market, By Country, 2023–2035 (USD Million)
Table 218. Northern Europe: Pelletized Fertilizer Market, By Product Type, 2024–2036 (USD Million)
Table 219. Northern Europe: Inorganic Pelletized Fertilizer Market, By Type, 2024–2036 (USD Million)
Table 220. Northern Europe: Organic Pelletized Fertilizer Market, By Type, 2024–2036 (USD Million)
Table 221. Northern Europe Biofertilizer Pellets Market, By Type, 2024–2036 (USD Million)
Table 222. Northern Europe: Pelletized Fertilizer Market, By Crop Type, 2024–2036 (USD Million)
Table 223. Northern Europe: Pelletized Fertilizer Market for Cereals and Grains, By Type, 2024–2036 (USD Million)
Table 224. Northern Europe: Pelletized Fertilizer Market for Fruits and Vegetables, By Type, 2024–2036 (USD Million)
Table 225. Northern Europe: Pelletized Fertilizer for Oilseeds and Pulses Market, By Type, 2024–2036 (USD Million)
Table 226. Northern Europe: Pelletized Fertilizer Market, By Distribution Channel, 2024–2036 (USD Million)
Table 227. Northern Europe: Pelletized Fertilizer Market, By Application, 2024–2036 (USD Million)
Table 228. Sweden: Pelletized Fertilizer Market, By Product Type, 2024–2036 (USD Million)
Table 229. Sweden: Inorganic Pelletized Fertilizer Market, By Type, 2024–2036 (USD Million)
Table 230. Sweden: Organic Pelletized Fertilizer Market, By Type, 2024–2036 (USD Million)
Table 231. Sweden Biofertilizer Pellets Market, By Type, 2024–2036 (USD Million)
Table 232. Sweden: Pelletized Fertilizer Market, By Crop Type, 2024–2036 (USD Million)
Table 233. Sweden: Pelletized Fertilizer Market for Cereals and Grains, By Type, 2024–2036 (USD Million)
Table 234. Sweden: Pelletized Fertilizer Market for Fruits and Vegetables, By Type, 2024–2036 (USD Million)
Table 235. Sweden: Pelletized Fertilizer for Oilseeds and Pulses Market, By Type, 2024–2036 (USD Million)
Table 236. Sweden: Pelletized Fertilizer Market, By Distribution Channel, 2024–2036 (USD Million)
Table 237. Sweden: Pelletized Fertilizer Market, By Application, 2024–2036 (USD Million)
Table 238. Denmark: Pelletized Fertilizer Market, By Product Type, 2024–2036 (USD Million)
Table 239. Denmark: Inorganic Pelletized Fertilizer Market, By Type, 2024–2036 (USD Million)
Table 240. Denmark: Organic Pelletized Fertilizer Market, By Type, 2024–2036 (USD Million)
Table 241. Denmark Biofertilizer Pellets Market, By Type, 2024–2036 (USD Million)
Table 242. Denmark: Pelletized Fertilizer Market, By Crop Type, 2024–2036 (USD Million)
Table 243. Denmark: Pelletized Fertilizer Market for Cereals and Grains, By Type, 2024–2036 (USD Million)
Table 244. Denmark: Pelletized Fertilizer Market for Fruits and Vegetables, By Type, 2024–2036 (USD Million)
Table 245. Denmark: Pelletized Fertilizer for Oilseeds and Pulses Market, By Type, 2024–2036 (USD Million)
Table 246. Denmark: Pelletized Fertilizer Market, By Distribution Channel, 2024–2036 (USD Million)
Table 247. Denmark: Pelletized Fertilizer Market, By Application, 2024–2036 (USD Million)
Table 248. Finland: Pelletized Fertilizer Market, By Product Type, 2024–2036 (USD Million)
Table 249. Finland: Inorganic Pelletized Fertilizer Market, By Type, 2024–2036 (USD Million)
Table 250. Finland: Organic Pelletized Fertilizer Market, By Type, 2024–2036 (USD Million)
Table 251. Finland Biofertilizer Pellets Market, By Type, 2024–2036 (USD Million)
Table 252. Finland: Pelletized Fertilizer Market, By Crop Type, 2024–2036 (USD Million)
Table 253. Finland: Pelletized Fertilizer Market for Cereals and Grains, By Type, 2024–2036 (USD Million)
Table 254. Finland: Pelletized Fertilizer Market for Fruits and Vegetables, By Type, 2024–2036 (USD Million)
Table 255. Finland: Pelletized Fertilizer for Oilseeds and Pulses Market, By Type, 2024–2036 (USD Million)
Table 256. Finland: Pelletized Fertilizer Market, By Distribution Channel, 2024–2036 (USD Million)
Table 257. Finland: Pelletized Fertilizer Market, By Application, 2024–2036 (USD Million)
Table 258. Norway: Pelletized Fertilizer Market, By Product Type, 2024–2036 (USD Million)
Table 259. Norway: Inorganic Pelletized Fertilizer Market, By Type, 2024–2036 (USD Million)
Table 260. Norway: Organic Pelletized Fertilizer Market, By Type, 2024–2036 (USD Million)
Table 261. Norway Biofertilizer Pellets Market, By Type, 2024–2036 (USD Million)
Table 262. Norway: Pelletized Fertilizer Market, By Crop Type, 2024–2036 (USD Million)
Table 263. Norway: Pelletized Fertilizer Market for Cereals and Grains, By Type, 2024–2036 (USD Million)
Table 264. Norway: Pelletized Fertilizer Market for Fruits and Vegetables, By Type, 2024–2036 (USD Million)
Table 265. Norway: Pelletized Fertilizer for Oilseeds and Pulses Market, By Type, 2024–2036 (USD Million)
Table 266. Norway: Pelletized Fertilizer Market, By Distribution Channel, 2024–2036 (USD Million)
Table 267. Norway: Pelletized Fertilizer Market, By Application, 2024–2036 (USD Million)
Table 268. Rest of Northern Europe: Pelletized Fertilizer Market, By Product Type, 2024–2036 (USD Million)
Table 269. Rest of Northern Europe: Inorganic Pelletized Fertilizer Market, By Type, 2024–2036 (USD Million)
Table 270. Rest of Northern Europe: Organic Pelletized Fertilizer Market, By Type, 2024–2036 (USD Million)
Table 271. Rest of Northern Europe Biofertilizer Pellets Market, By Type, 2024–2036 (USD Million)
Table 272. Rest of Northern Europe: Pelletized Fertilizer Market, By Crop Type, 2024–2036 (USD Million)
Table 273. Rest of Northern Europe: Pelletized Fertilizer Market for Cereals and Grains, By Type, 2024–2036 (USD Million)
Table 274. Rest of Northern Europe: Pelletized Fertilizer Market for Fruits and Vegetables, By Type, 2024–2036 (USD Million)
Table 275. Rest of Northern Europe: Pelletized Fertilizer for Oilseeds and Pulses Market, By Type, 2024–2036 (USD Million)
Table 276. Rest of Northern Europe: Pelletized Fertilizer Market, By Distribution Channel, 2024–2036 (USD Million)
Table 277. Rest of Northern Europe: Pelletized Fertilizer Market, By Application, 2024–2036 (USD Million)
Table 278. Eastern Europe: Pelletized Fertilizer Market, By Country, 2023–2035 (USD Million)
Table 279. Eastern Europe: Pelletized Fertilizer Market, By Product Type, 2024–2036 (USD Million)
Table 280. Eastern Europe: Inorganic Pelletized Fertilizer Market, By Type, 2024–2036 (USD Million)
Table 281. Eastern Europe: Organic Pelletized Fertilizer Market, By Type, 2024–2036 (USD Million)
Table 282. Eastern Europe Biofertilizer Pellets Market, By Type, 2024–2036 (USD Million)
Table 283. Eastern Europe: Pelletized Fertilizer Market, By Crop Type, 2024–2036 (USD Million)
Table 284. Eastern Europe: Pelletized Fertilizer Market for Cereals and Grains, By Type, 2024–2036 (USD Million)
Table 285. Eastern Europe: Pelletized Fertilizer Market for Fruits and Vegetables, By Type, 2024–2036 (USD Million)
Table 286. Eastern Europe: Pelletized Fertilizer for Oilseeds and Pulses Market, By Type, 2024–2036 (USD Million)
Table 287. Eastern Europe: Pelletized Fertilizer Market, By Distribution Channel, 2024–2036 (USD Million)
Table 288. Eastern Europe: Pelletized Fertilizer Market, By Application, 2024–2036 (USD Million)
Table 289. Poland: Pelletized Fertilizer Market, By Product Type, 2024–2036 (USD Million)
Table 290. Poland: Inorganic Pelletized Fertilizer Market, By Type, 2024–2036 (USD Million)
Table 291. Poland: Organic Pelletized Fertilizer Market, By Type, 2024–2036 (USD Million)
Table 292. Poland Biofertilizer Pellets Market, By Type, 2024–2036 (USD Million)
Table 293. Poland: Pelletized Fertilizer Market, By Crop Type, 2024–2036 (USD Million)
Table 294. Poland: Pelletized Fertilizer Market for Cereals and Grains, By Type, 2024–2036 (USD Million)
Table 295. Poland: Pelletized Fertilizer Market for Fruits and Vegetables, By Type, 2024–2036 (USD Million)
Table 296. Poland: Pelletized Fertilizer for Oilseeds and Pulses Market, By Type, 2024–2036 (USD Million)
Table 297. Poland: Pelletized Fertilizer Market, By Distribution Channel, 2024–2036 (USD Million)
Table 298. Poland: Pelletized Fertilizer Market, By Application, 2024–2036 (USD Million)
Table 299. Czech Republic: Pelletized Fertilizer Market, By Product Type, 2024–2036 (USD Million)
Table 300. Czech Republic: Inorganic Pelletized Fertilizer Market, By Type, 2024–2036 (USD Million)
Table 301. Czech Republic: Organic Pelletized Fertilizer Market, by Type, 2024–2036 (USD Million)
Table 302. Czech Republic Biofertilizer Pellets Market, by Type, 2024–2036 (USD Million)
Table 303. Czech Republic: Pelletized Fertilizer Market, by Crop Type, 2024–2036 (USD Million)
Table 304. Czech Republic: Pelletized Fertilizer Market for Cereals and Grains, by Type, 2024–2036 (USD Million)
Table 305. Czech Republic: Pelletized Fertilizer Market for Fruits and Vegetables, by Type, 2024–2036 (USD Million)
Table 306. Czech Republic: Pelletized Fertilizer for Oilseeds and Pulses Market, by Type, 2024–2036 (USD Million)
Table 307. Czech Republic: Pelletized Fertilizer Market, by Distribution Channel, 2024–2036 (USD Million)
Table 308. Czech Republic: Pelletized Fertilizer Market, by Application, 2024–2036 (USD Million)
Table 309. Romania: Pelletized Fertilizer Market, by Product Type, 2024–2036 (USD Million)
Table 310. Romania: Inorganic Pelletized Fertilizer Market, by Type, 2024–2036 (USD Million)
Table 311. Romania: Organic Pelletized Fertilizer Market, by Type, 2024–2036 (USD Million)
Table 312. Romania Biofertilizer Pellets Market, by Type, 2024–2036 (USD Million)
Table 313. Romania: Pelletized Fertilizer Market, by Crop Type, 2024–2036 (USD Million)
Table 314. Romania: Pelletized Fertilizer Market for Cereals and Grains, by Type, 2024–2036 (USD Million)
Table 315. Romania: Pelletized Fertilizer Market for Fruits and Vegetables, by Type, 2024–2036 (USD Million)
Table 316. Romania: Pelletized Fertilizer for Oilseeds and Pulses Market, by Type, 2024–2036 (USD Million)
Table 317. Romania: Pelletized Fertilizer Market, by Distribution Channel, 2024–2036 (USD Million)
Table 318. Romania: Pelletized Fertilizer Market, by Application, 2024–2036 (USD Million)
Table 319. Hungary: Pelletized Fertilizer Market, by Product Type, 2024–2036 (USD Million)
Table 320. Hungary: Inorganic Pelletized Fertilizer Market, by Type, 2024–2036 (USD Million)
Table 321. Hungary: Organic Pelletized Fertilizer Market, by Type, 2024–2036 (USD Million)
Table 322. Hungary Biofertilizer Pellets Market, by Type, 2024–2036 (USD Million)
Table 323. Hungary: Pelletized Fertilizer Market, by Crop Type, 2024–2036 (USD Million)
Table 324. Hungary: Pelletized Fertilizer Market for Cereals and Grains, by Type, 2024–2036 (USD Million)
Table 325. Hungary: Pelletized Fertilizer Market for Fruits and Vegetables, by Type, 2024–2036 (USD Million)
Table 326. Hungary: Pelletized Fertilizer for Oilseeds and Pulses Market, by Type, 2024–2036 (USD Million)
Table 327. Hungary: Pelletized Fertilizer Market, by Distribution Channel, 2024–2036 (USD Million)
Table 328. Hungary: Pelletized Fertilizer Market, by Application, 2024–2036 (USD Million)
Table 329. Rest of Eastern Europe: Pelletized Fertilizer Market, by Product Type, 2024–2036 (USD Million)
Table 330. Rest of Eastern Europe: Inorganic Pelletized Fertilizer Market, by Type, 2024–2036 (USD Million)
Table 331. Rest of Eastern Europe: Organic Pelletized Fertilizer Market, by Type, 2024–2036 (USD Million)
Table 332. Rest of Eastern Europe Biofertilizer Pellets Market, by Type, 2024–2036 (USD Million)
Table 333. Rest of Eastern Europe: Pelletized Fertilizer Market, by Crop Type, 2024–2036 (USD Million)
Table 334. Rest of Eastern Europe: Pelletized Fertilizer Market for Cereals and Grains, by Type, 2024–2036 (USD Million)
Table 335. Rest of Eastern Europe: Pelletized Fertilizer Market for Fruits and Vegetables, by Type, 2024–2036 (USD Million)
Table 336. Rest of Eastern Europe: Pelletized Fertilizer for Oilseeds and Pulses Market, by Type, 2024–2036 (USD Million)
Table 337. Rest of Eastern Europe: Pelletized Fertilizer Market, by Distribution Channel, 2024–2036 (USD Million)
Table 338. Rest of Eastern Europe: Pelletized Fertilizer Market, by Application, 2024–2036 (USD Million)
LIST OF FIGURES
Figure 1. Research Process
Figure 2. Key Secondary Sources
Figure 3. Primary Research Techniques
Figure 4. Key Executives Interviewed
Figure 5. Breakdown of Primary Interviews (Supply-Side & Demand-Side)
Figure 6. Market Sizing and Growth Forecast Approach
Figure 7. Europe Pelletized Fertilizers Market, by Product Type, 2026 vs. 2036 (USD Million)
Figure 8. Global Europe Pelletized Fertilizers Market, by Crop Type, 2026 vs. 2036 (USD Million)
Figure 9. Europe Pelletized Fertilizers Market, by Distribution Channel, 2026 vs. 2036 (USD Million)
Figure 10. Europe Pelletized Fertilizers Market, by Application Method, 2026 vs. 2036 (USD Million)
Figure 11. Europe Pelletized Fertilizers Market, by Geography, 2026 vs. 2036 (USD Million)
Figure 12. Factors Impacting Market Growth
Figure 13. Europe Pelletized Fertilizers Market, by Product Type, 2026 vs. 2036 (USD Million)
Figure 14. Europe Pelletized Fertilizers Market, by Crop Type, 2026 vs. 2036 (USD Million)
Figure 15. Europe Pelletized Fertilizers Market, by Application Method, 2026 vs. 2036 (USD Million)
Figure 16. Europe Pelletized Fertilizers Market, by Distribution Channel, 2026 vs. 2036 (USD Million)
Figure 17. Europe Pelletized Fertilizers Market, by Region, 2026 vs. 2036 (USD Million)
Figure 18. Europe Pelletized Fertilizers Market: Competitive Benchmarking, by Region
Figure 19. Competitive Dashboard: Europe Pelletized Fertilizers Market
Figure 20. Europe Pelletized Fertilizers Market Position Analysis, 2025
Figure 21. Yara International ASA: Financial Overview (2025)
Figure 22. ICL Group Ltd.: Financial Overview (2025)
Figure 23. K+S AG: Financial Overview (2025)
Figure 24. Grupa Azoty S.A.: Financial Overview (2024)
Figure 25. OCI N.V: Financial Overview (2024)
Figure 26. BASF SE: Financial Overview (2025)


Published Date: Jan-2025
Published Date: Jan-2025
Published Date: Jan-2024
Published Date: Jun-2022
Subscribe to get the latest industry updates