Resources
About Us
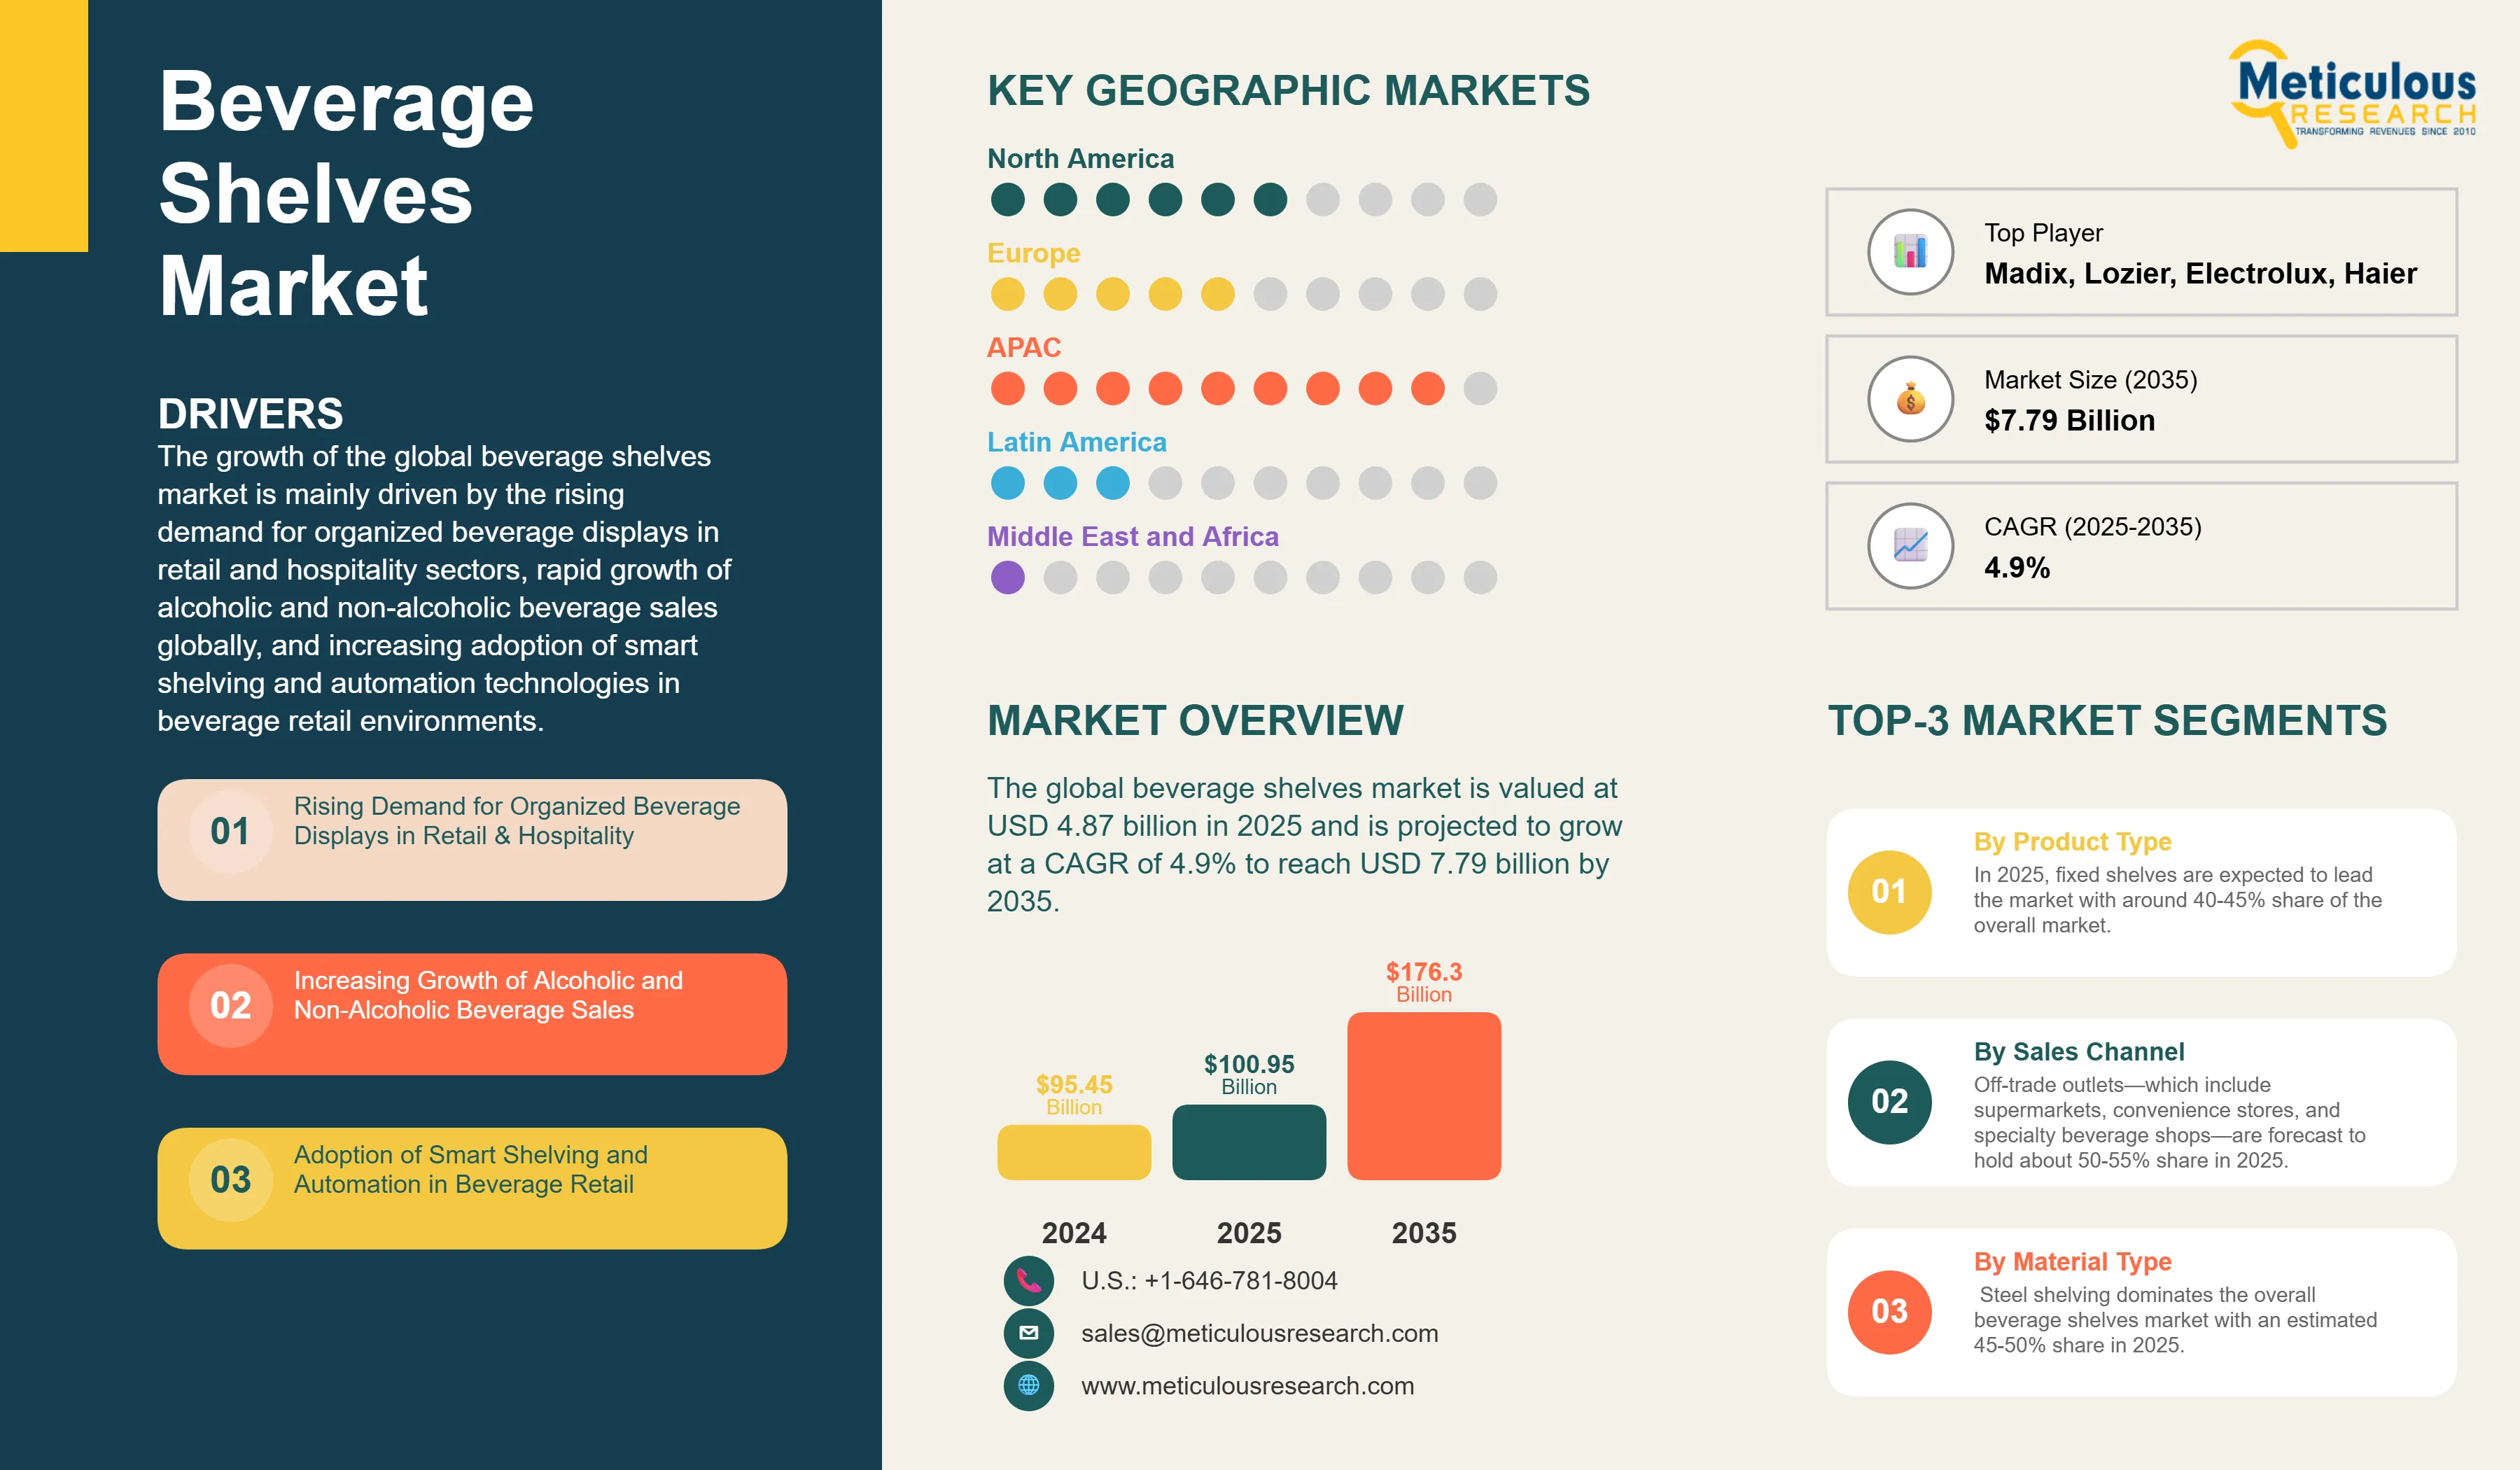
The growth of the global beverage shelves market is mainly driven by the rising demand for organized beverage displays in retail and hospitality sectors, rapid growth of alcoholic and non-alcoholic beverage sales globally, and increasing adoption of smart shelving and automation technologies in beverage retail environments.
Moreover, the expansion of e-commerce and the consequent need for optimized shelf storage in warehouses has accelerated the growth of this market across the globe. Additionally, regulatory and safety compliance requirements, particularly for alcoholic beverage shelving, are driving demand for specialized display solutions.
However, the high cost of smart shelving technologies is expected to hamper the adoption, especially by some smaller retailers to some extent. Additionally, factors such as various complexities in shelf compliance and labeling requirements for alcoholic products and the difficulty in managing diverse beverage sizes, packaging formats, and weight distributions further restrains the growth of this market to some extent.
Despite existing challenges, the beverage shelving market offers significant growth opportunities in many regions across the globe. These opportunities for growth are emerging through the development of advanced solutions such as gravity-fed and refrigerated shelving systems, which enhance product preservation and visibility. Rapid retail expansion in many emerging markets is further driving demand for innovative and scalable shelving technologies. Additionally, the integration of AI and advanced analytics into shelf management is also broadening the use of shelves for different applications.
In line with broader industry trends, the focus on energy-efficient refrigerated shelving technologies and reduced carbon footprint through optimized material usage is increasing. Manufacturers are also developing sustainable materials and implementing sustainable manufacturing processes to meet evolving environmental demands.
Market Drivers
Rising Demand for Organized Beverage Displays in Retail & Hospitality
According to industry trends reported in recent retail research, a significant portion of retailers have increased their investment in visual merchandising and display solutions to enhance the in-store customer experience. This trend is particularly evident in the beverage sector, where demand for organized and attractive beverage displays is rising across supermarkets, specialty stores, bars, restaurants, and other hospitality venues.
Beverage shelves often represent a substantial portion of retail display space in these outlets, typically ranging from around 20% to 30%, depending on the store format and product mix. Given the high sales value of beverages, these shelves play a crucial role in revenue generation. Research and case studies in retail merchandising indicate that well-designed shelving systems can notably improve product visibility and positively influence sales conversion rates when compared to traditional storage and display methods. Enhancements in shelf organization, lighting, and ergonomics contribute to better shopper engagement and purchasing decisions, thereby maximizing sales and optimizing space utilization in high-traffic areas.
The use of gravity feed shelving systems alongside temperature-controlled display units is increasingly recognized for its effectiveness in keeping beverages fresh and ensuring smooth product rotation. These shelving solutions not only help maintain product quality but also typically deliver a return on investment within 18 to 24 months by reducing waste and increasing sales velocity.
Recent trends indicate growing interest from the hospitality sector—including hotels, restaurants, and entertainment venues—for custom-designed beverage shelving that balances practical functionality with visual appeal. Such tailored shelving solutions not only improve the customer experience but also strengthen brand image and positioning in competitive markets.
Increasing Growth of Alcoholic and Non-Alcoholic Beverage Sales
The global beverage industry is continuing its growth trajectory, with the International Wine and Spirit Research (IWSR) forecasting an annual growth rate of around 2.3% through 2025. This steady expansion is driving a demand for specialized beverage shelving solutions capable of accommodating a wide variety of products—from craft beers and premium wines to energy drinks and functional beverages.
The trend toward premiumization in alcoholic beverages is fueling the need for sophisticated display shelving that highlights the value and uniqueness of high-end products. For example, wine storage and display shelves now often include specialized features such as temperature control, UV protection, and vibration reduction to help preserve product quality and enhance the customer experience.
Meanwhile, non-alcoholic beverage segments—like functional drinks, cold-pressed juices, and craft sodas—are growing rapidly and require versatile shelving solutions that can easily adjust to different package sizes and presentation styles. Alongside this growth, the increasing number of health-conscious consumers has fueled demand for refrigerated shelving that keeps products fresh while making them visually appealing on the shelf.
Adoption of Smart Shelving and Automation in Beverage Retail
The integration of IoT-enabled smart shelving systems with real-time inventory tracking is transforming the way beverage retailers operate. Recent industry studies have shown that businesses adopting smart shelves experience significant improvements—inventory accuracy increases by around 25 to 35%, while out-of-stock situations drop by 20 to 30%.
Modern beverage shelving increasingly features sensor-based weight detection and automated replenishment alerts, allowing retailers to maintain optimal stock levels without manual oversight. These technologies not only help reduce labor costs but also increase customer satisfaction by ensuring popular products are always available.
In addition, the use of digital price tags and interactive product displays linked with smart shelves is reshaping the shopping experience. Customers benefit from up-to-date pricing and detailed product information, while retailers gain the flexibility to implement dynamic pricing and manage promotions in real time.
Beyond inventory management, smart shelving systems are leveraging advanced analytics and machine learning to forecast demand, fine-tune product placement, and boost operational efficiency. These innovations enable beverage retailers to respond quicker to changing consumer preferences and optimize shelf space for maximum impact.
As the retail landscape becomes increasingly digital, smart shelves are proving to be a crucial tool in bridging offline and online channels—offering seamless, engaging, and efficient shopping experiences that drive sales and build customer loyalty.
Market Segmentation Analysis
By Product Type
The beverage shelves market is broadly categorized into fixed shelves, mobile shelves, gravity feed shelves, and refrigerated or temperature -controlled shelving units. In 2025, fixed shelves are expected to lead the market with around 40-45% share of the overall market. Their popularity stems from being cost- effective, durable, and versatile enough to suit many retail formats and beverages varieties.
However, refrigerated and temperature-controlled shelving is anticipated to grow at the fastest CAGR between 2025 and2035. This growth is largely driven by increasing consumer demand for premium beverage preservation, the expanding craft beverage sector requiring precise temperature control, and retailers' focus on maintaining product freshness and quality.
By Technology
Technologically, the overall beverage shelves market is primarily segmented into conventional shelving, smart shelving with IoT capabilities, automated shelving including robotic systems, and sensors or weight-based inventory management systems. Conventional shelving is expected to hold the largest share in 2025 with around 55-60% share of the overall market- thanks to its lower upfront costs and widespread use in traditional retail.
At the same time, smart and IoT-enabled shelving solutions are predicted to register the fastest CAGR, driven by their benefits in real-time inventory tracking, boosting operational efficiency, lowering labor costs, and enhancing the shopping experience through updated product information and pricing.
By Material Type
Material-wise, steel shelving dominates the overall beverage shelves market with an estimated 45-50% share in 2025, valued for its strength, durability, and cost advantages, especially when handling heavy beverage loads.
That said, shelving made from specialty materials designed for hygienic use and cold storage is expected to grow at the fastest CAGR over the next decade. This reflects rising consumer and retailer emphasis on cleanliness, food safety standards, and the rising use of refrigerated storage that demands more advanced materials.
By Sales Channel
Looking at sales channels, off-trade outlets—which include supermarkets, convenience stores, and specialty beverage shops—are forecast to hold about 50-55% share of the market in 2025. Their extensive reach into consumer markets makes them the largest adopters of beverage shelving solutions.
Meanwhile, the online distribution and e-commerce channel is set to grow rapidly as it scales to accommodate booming online beverage sales. This growth is supported by increasingly efficient warehouse shelving solutions and automated fulfillment technologies specifically designed for beverage inventory management.
Regional Analysis
Geographically, the Asia-Pacific region is poised to be the largest market in 2025, with an estimated 35-40% share of global beverage shelves market. This growth is driven by rapid retail expansion, rising beverage consumption, the proliferation of modern retail formats, and greater adoption of advanced retail technologies.
The Asia-Pacific region is also expected to grow at the fastest CAGR through 2035. Factors such as the expanding organized retail sector's need for professional display solutions, rising disposable incomes, a growing hospitality industry, government-backed retail modernization initiatives, and increasing awareness around food safety and hygiene standards all contribute to the growth of beverage shelves market in this region.
North America remains a mature, innovation-focused market that emphasizes smart shelving technologies, sustainability, and regulatory compliance. Here, upgrading existing retail infrastructure and growing premium beverage segments underpin steady market growth.
In Europe, demand for sustainable and energy-efficient shelving is particularly strong, driven by strict environmental regulations and consumer preferences for eco-friendly materials. This is encouraging the adoption of sustainable shelving designs and circular economy principles across the region's retail sector.
Key Players Operating in the Global Beverage Shelves Market
The key players in the global beverage shelves market include Trion Industries Inc., Madix Inc., Lozier Corporation, Gondella NV, Hussmann Corporation, Artitalia Group, Metalware Corporation, Shelving Inc., Borgen Systems AS, Dexion, Tegometall International AG, Uniweb Inc., Spacesaver Corporation, CAEM Srl, LA Darling, Donracks, Storflex, Guangzhou Huicheng Shelf Co., Ltd., Handy Store Fixtures, Kider SA, Metalfrio Solutions SA, True Manufacturing Co. Inc., Electrolux AB, Haier Group Corporation, and Dover Corporation among others.
|
Particulars |
Details |
|
Number of Pages |
180 |
|
Forecast Period |
2025–2035 |
|
Base Year |
2024 |
|
CAGR (Value) |
4.9% |
|
Market Size 2024 |
USD 4.42 billion |
|
Market Size 2025 |
USD 4.87 billion |
|
Market Size 2035 |
USD 7.79 billion |
|
Segments Covered |
By Product Type, Technology, Material Type, Beverage Type, Sales Channel, and End Use |
|
Countries Covered |
North America (U.S., Canada, Mexico), Europe (Germany, France, U.K., Italy, Spain, Netherlands, Rest of Europe), Asia-Pacific (China, Japan, India, South Korea, Australia, Rest of Asia-Pacific), Latin America (Brazil, Argentina, Rest of Latin America), and the Middle East & Africa (Saudi Arabia, UAE, South Africa, Rest of Middle East & Africa) |
The beverage shelves market is projected to reach USD 7.79 billion by 2035 from USD 4.87 billion in 2025, at a CAGR of 4.9% during the forecast period.
In 2025, the fixed shelves segment is projected to hold the major share of the beverage shelves market, while the refrigerated & temperature-controlled shelving units segment is slated to record the highest growth rate.
Key factors driving the growth include rising demand for organized beverage displays in retail and hospitality sectors, increasing growth of alcoholic and non-alcoholic beverage sales, adoption of smart shelving and automation technologies, expansion of e-commerce and optimized warehouse storage, and regulatory compliance requirements for alcoholic beverage shelving.
Asia-Pacific leads the market with the highest share and is projected to record the highest growth rate during the forecast period, offering significant opportunities for beverage shelving vendors.
Major opportunities include development of gravity feed and refrigerated shelves for beverage preservation, growth in emerging markets and untapped retail channels, integration of artificial intelligence and analytics in shelf management, modularity and customization in shelf design, and emerging trends in self-vending and automated shelving solutions.
Key trends include demand for sustainable and eco-friendly shelf materials, advances in refrigerated and smart display shelving, integration of IoT and sensor-based inventory management systems, temperature-controlled shelving for premium beverages, and focus on energy-efficient refrigerated shelving technologies.
The smart shelving systems and IoT-enabled shelves segment is anticipated to record the highest growth rate during the forecast period, driven by real-time inventory tracking capabilities, improved operational efficiency, and enhanced customer experience through dynamic product information display.
1. Market Definition & Scope
1.1. Market Definition
1.2. Market Ecosystem
1.3. Currency
1.4. Key Stakeholders
2. Research Methodology
2.1. Research Approach
2.2. Process of Data Collection and Validation
2.2.1. Secondary Research
2.2.2. Primary Research/Interviews with Key Opinion Leaders from the Industry
2.3. Market Sizing and Forecast
2.3.1. Market Size Estimation Approach
2.3.1.1. Bottom-up Approach
2.3.1.2. Top-down Approach
2.3.2. Growth Forecast Approach
2.3.3. Assumptions for the Study
3. Executive Summary
3.1. Overview
3.2. Segmental Analysis
3.2.1. Beverage Shelves Market, by Product Type
3.2.2. Beverage Shelves Market, by Technology
3.2.3. Beverage Shelves Market, by Material Type
3.2.4. Beverage Shelves Market, by Beverage Type
3.2.5. Beverage Shelves Market, by Sales Channel
3.2.6. Beverage Shelves Market, by End Use
3.2.7. Beverage Shelves Market, by Geography
3.3. Competitive Landscape
4. Market Insights
4.1. Overview
4.2. Factors Affecting Market Growth
4.2.1. Drivers
4.2.1.1. Rising Demand for Organized Beverage Displays in Retail & Hospitality
4.2.1.2. Increasing Growth of Alcoholic and Non-Alcoholic Beverage Sales
4.2.1.3. Adoption of Smart Shelving and Automation in Beverage Retail
4.2.1.4. Regulatory and Safety Compliance Particularly for Alcoholic Beverage Shelves
4.2.1.5. Expansion of E-Commerce and Need for Optimized Shelf Storage in Warehouses
4.2.2. Restraints
4.2.2.1. High Cost of Smart Shelving Technologies
4.2.2.2. Complexities in Shelf Compliance and Labeling for Alcoholic Products
4.2.2.3. Difficulty in Managing Diverse Beverage Sizes, Packaging, and Weight
4.2.2.4. Shelf Stock Replenishment and Inventory Accuracy in Multi-Brand Stores
4.2.3. Opportunities
4.2.3.1. Development of Gravity Feed & Refrigerated Shelves for Beverage Preservation
4.2.3.2. Growth in Emerging Markets and Untapped Retail Channels
4.2.3.3. Integration of Artificial Intelligence and Analytics in Shelf Management
4.2.3.4. Modularity and Customization in Beverage Shelf Design
4.2.3.5. Emerging Trends in Self-Vending and Automated Shelving Solutions
4.2.4. Trends
4.2.4.1. Demand for Sustainable and Eco-Friendly Shelf Materials
4.2.4.2. Advances in Refrigerated and Smart Display Shelving
4.2.4.3. Integration of IoT and Sensor-Based Inventory Management Systems
4.2.4.4. Temperature-Controlled Shelving for Premium Beverage Categories
4.2.5. Challenges
4.2.5.1. Technical Complexity in Custom Shelving Solutions for Diverse Beverage Types
4.2.5.2. Long Product Development Cycles for Specialized Refrigerated Applications
4.2.5.3. Maintenance and Service Requirements for Smart Shelving Systems
4.3. Porter's Five Forces Analysis
4.3.1. Bargaining Power of Suppliers
4.3.2. Bargaining Power of Buyers
4.3.3. Threat of Substitutes
4.3.4. Threat of New Entrants
4.3.5. Degree of Competition
4.4. Sustainability Impact on Beverage Shelves Market
4.4.1. Environmental Sustainability Factors
4.4.1.1. Energy Efficient Refrigerated Shelving Technologies
4.4.1.2. Reduced Carbon Footprint through Optimized Material Usage
4.4.2. Market Response to Sustainability Demands
4.4.2.1. Development of Eco-Friendly Materials and Manufacturing Processes
4.4.2.2. Manufacturer-led Sustainability Initiatives in Shelf Design
4.4.3. Market Opportunities Created by Sustainability Focus
4.4.3.1. Circular Economy and Product Lifecycle Optimization
4.4.3.2. Challenges in Sustainable Material Sourcing and Recycling
5. Beverage Shelves Market Assessment—By Product Type
5.1. Overview
5.2. Fixed Shelves
5.3. Mobile Shelves
5.4. Gravity Feed Shelves
5.5. Refrigerated & Temperature-Controlled Shelving Units
6. Beverage Shelves Market Assessment—By Technology
6.1. Overview
6.2. Conventional Shelving Systems
6.3. Smart Shelving Systems and IoT-Enabled Shelves
6.4. Automated Shelving and Robotic Integration
6.5. Sensor and Weight-Based Inventory Management Systems
7. Beverage Shelves Market Assessment—By Material Type
7.1. Overview
7.2. Steel Shelving
7.3. Plastic Shelving
7.4. Wood and Composite Materials
7.5. Specialty Materials for Hygienic and Cold Storage Applications
8. Beverage Shelves Market Assessment—By Beverage Type
8.1. Overview
8.2. Alcoholic Beverages
8.2.1. Beer Shelving Solutions
8.2.2. Wine Storage and Display Shelves
8.2.3. Spirits and Liquor Shelving
8.2.4. Malt Beverages
8.3. Non-Alcoholic Beverages
8.3.1. Soft Drinks and Carbonated Beverages
8.3.2. Juices and Fruit Beverages
8.3.3. Bottled Water
8.3.4. Energy and Functional Drinks
9. Beverage Shelves Market Assessment—By Sales Channel
9.1. Overview
9.2. On-Trade Channel
9.2.1. Bars and Pubs
9.2.2. Restaurants
9.2.3. Hotels and Hospitality
9.2.4. Clubs and Entertainment Venues
9.3. Off-Trade Channel
9.3.1. Supermarkets and Hypermarkets
9.3.2. Liquor Stores
9.3.3. Convenience Stores
9.3.4. Specialty Beverage Retailers
9.4. Online Distribution/E-commerce
9.4.1. Warehousing and Fulfillment Centers
9.4.2. Smart Shelving Integration for Online Retail
9.5. Others
10. Beverage Shelves Market Assessment—By End Use
10.1. Overview
10.2. Commercial
10.2.1. Retail Establishments
10.2.2. Hospitality and Food Service
10.2.3. Entertainment Venues
10.2.4. Corporate Offices
10.3. Industrial
10.3.1. Beverage Manufacturing Facilities
10.3.2. Distribution Centers
10.3.3. Cold Storage Facilities
10.4. Residential
11. Beverage Shelves Market Assessment—By Geography
11.1. Overview
11.2. North America
11.2.1. U.S.
11.2.2. Canada
11.2.3. Mexico
11.3. Europe
11.3.1. Germany
11.3.2. France
11.3.3. U.K.
11.3.4. Italy
11.3.5. Spain
11.3.6. Netherlands
11.3.7. Rest of Europe (RoE)
11.4. Asia-Pacific
11.4.1. China
11.4.2. Japan
11.4.3. India
11.4.4. South Korea
11.4.5. Australia
11.4.6. Rest of Asia-Pacific (RoAPAC)
11.5. Latin America
11.5.1. Brazil
11.5.2. Argentina
11.5.3. Rest of Latin America (RoLATAM)
11.6. Middle East & Africa
11.6.1. Saudi Arabia
11.6.2. United Arab Emirates (UAE)
11.6.3. South Africa
11.6.4. Rest of Middle East & Africa (RoMEA)
12. Competitive Landscape
12.1. Overview
12.2. Key Growth Strategies
12.3. Competitive Benchmarking
12.4. Competitive Dashboard
12.4.1. Industry Leaders
12.4.2. Market Differentiators
12.4.3. Vanguards
12.4.4. Contemporary Stalwarts
12.5. Market Share/Ranking Analysis, by the Key Players, 2024
13. Company Profiles (Business Overview, Financial Overview, Product Portfolio, Strategic Developments, and SWOT Analysis*)
13.1. Trion Industries Inc.
13.2. Madix Inc.
13.3. Lozier Corporation
13.4. Gondella NV
13.5. Hussmann Corporation
13.6. Artitalia Group
13.7. Metalware Corporation
13.8. Shelving Inc.
13.9. Borgen Systems AS
13.10. Dexion
13.11. Tegometall International AG
13.12. Uniweb Inc.
13.13. Spacesaver Corporation
13.14. CAEM Srl
13.15. LA Darling
13.16. Donracks
13.17. Storflex
13.18. Guangzhou Huicheng Shelf Co., Ltd.
13.19. Handy Store Fixtures
13.20. Kider SA
13.21. Metalfrio Solutions SA
13.22. True Manufacturing Co. Inc.
13.23. Electrolux AB
13.24. Haier Group Corporation
13.25. Dover Corporation
13.26. Others
14. Appendix
14.1. Available Customization
14.2. Related Reports
LIST OF TABLES
Table 1. Global Beverage Shelves Market, by Product Type, 2025–2035 (USD Million)
Table 2. Global Fixed Shelves Market, by Country/Region, 2025–2035 (USD Million)
Table 3. Global Mobile Shelves Market, by Country/Region, 2025–2035 (USD Million)
Table 4. Global Gravity Feed Shelves Market, by Country/Region, 2025–2035 (USD Million)
Table 5. Global Refrigerated & Temperature-Controlled Shelving Units Market, by Country/Region, 2025–2035 (USD Million)
Table 6. Global Beverage Shelves Market, by Technology, 2025–2035 (USD Million)
Table 7. Global Conventional Shelving Systems Market, by Country/Region, 2025–2035 (USD Million)
Table 8. Global Smart Shelving Systems and IoT-Enabled Shelves Market, by Country/Region, 2025–2035 (USD Million)
Table 9. Global Automated Shelving and Robotic Integration Market, by Country/Region, 2025–2035 (USD Million)
Table 10. Global Sensor and Weight-Based Inventory Management Systems Market, by Country/Region, 2025–2035 (USD Million)
Table 11. Global Beverage Shelves Market, by Material Type, 2025–2035 (USD Million)
Table 12. Global Steel Shelving Market, by Country/Region, 2025–2035 (USD Million)
Table 13. Global Plastic Shelving Market, by Country/Region, 2025–2035 (USD Million)
Table 14. Global Wood and Composite Materials Market, by Country/Region, 2025–2035 (USD Million)
Table 15. Global Specialty Materials for Hygienic and Cold Storage Applications Market, by Country/Region, 2025–2035 (USD Million)
Table 16. Global Beverage Shelves Market, by Beverage Type, 2025–2035 (USD Million)
Table 17. Global Shelves Market for Alcoholic Beverages, by Type, 2025–2035 (USD Million)
Table 18. Global Beer Shelving Solutions Market, by Country/Region, 2025–2035 (USD Million)
Table 19. Global Wine Storage and Display Shelves Market, by Country/Region, 2025–2035 (USD Million)
Table 20. Global Spirits and Liquor Shelving Market, by Country/Region, 2025–2035 (USD Million)
Table 21. Global Shelves Market for Malt Beverages, by Country/Region, 2025–2035 (USD Million)
Table 22. Global Shelves Market for Non-Alcoholic Beverages, by Type, 2025–2035 (USD Million)
Table 23. Global Shelves Market for Soft Drinks and Carbonated Beverages Market, by Country/Region, 2025–2035 (USD Million)
Table 24. Global Shelves Market for Juices and Fruit Beverages, by Country/Region, 2025–2035 (USD Million)
Table 25. Global Shelves Market for Bottled Water, by Country/Region, 2025–2035 (USD Million)
Table 26. Global Shelves Market for Energy and Functional Drinks, by Country/Region, 2025–2035 (USD Million)
Table 27. Global Beverage Shelves Market, by Sales Channel, 2025–2035 (USD Million)
Table 28. Global Beverage Shelves Market Through On-Trade Channel, by Type, 2025–2035 (USD Million)
Table 29. Global Beverage Shelves Market Through Bars and Pubs, by Country/Region, 2025–2035 (USD Million)
Table 30. Global Beverage Shelves Market Through Restaurants, by Country/Region, 2025–2035 (USD Million)
Table 31. Global Beverage Shelves Market Through Hotels and Hospitality, by Country/Region, 2025–2035 (USD Million)
Table 32. Global Beverage Shelves Market Through Clubs and Entertainment Venues, by Country/Region, 2025–2035 (USD Million)
Table 33. Global Beverage Shelves Market Through Off-Trade Channel, by Type, 2025–2035 (USD Million)
Table 34. Global Beverage Shelves Market Through Supermarkets and Hypermarkets, by Country/Region, 2025–2035 (USD Million)
Table 35. Global Beverage Shelves Market Through Liquor Stores, by Country/Region, 2025–2035 (USD Million)
Table 36. Global Beverage Shelves Market Through Convenience Stores, by Country/Region, 2025–2035 (USD Million)
Table 37. Global Beverage Shelves Market Through Specialty Beverage Retailers, by Country/Region, 2025–2035 (USD Million)
Table 38. Global Beverage Shelves Market Through Online Distribution/E-commerce, by Type, 2025–2035 (USD Million)
Table 39. Global Beverage Shelves Market Through Warehousing and Fulfillment Centers, by Country/Region, 2025–2035 (USD Million)
Table 40. Global Beverage Shelves Market Through Smart Shelving Integration for Online Retail, by Country/Region, 2025–2035 (USD Million)
Table 41. Global Beverage Shelves Market Through Other Channels, by Country/Region, 2025–2035 (USD Million)
Table 42. Global Beverage Shelves Market, by End Use, 2025–2035 (USD Million)
Table 43. Global Beverage Shelves Market for Commercial, by Type, 2025–2035 (USD Million)
Table 44. Global Beverage Shelves Market for Retail Establishments, by Country/Region, 2025–2035 (USD Million)
Table 45. Global Beverage Shelves Market for Hospitality and Food Service, by Country/Region, 2025–2035 (USD Million)
Table 46. Global Beverage Shelves Market for Entertainment Venues, by Country/Region, 2025–2035 (USD Million)
Table 47. Global Beverage Shelves Market for Corporate Offices, by Country/Region, 2025–2035 (USD Million)
Table 48. Global Beverage Shelves Market for Industrial, by Type, 2025–2035 (USD Million)
Table 49. Global Beverage Shelves Market for Beverage Manufacturing Facilities, by Country/Region, 2025–2035 (USD Million)
Table 50. Global Beverage Shelves Market for Distribution Centers, by Country/Region, 2025–2035 (USD Million)
Table 51. Global Beverage Shelves Market for Cold Storage Facilities, by Country/Region, 2025–2035 (USD Million)
Table 52. Global Beverage Shelves Market for Residential, by Country/Region, 2025–2035 (USD Million)
Table 53. North America: Beverage Shelves Market, by Product Type, 2025–2035 (USD Million)
Table 54. North America: Beverage Shelves Market, by Technology, 2025–2035 (USD Million)
Table 55. North America: Beverage Shelves Market, by Material Type, 2025–2035 (USD Million)
Table 56. North America: Beverage Shelves Market, by Beverage Type, 2025–2035 (USD Million)
Table 57. North America: Alcoholic Beverages Market, by Type, 2025–2035 (USD Million)
Table 58. North America: Non-Alcoholic Beverages Market, by Type, 2025–2035 (USD Million)
Table 59. North America: Beverage Shelves Market, by Sales Channel, 2025–2035 (USD Million)
Table 60. North America: On-Trade Channel Market, by Type, 2025–2035 (USD Million)
Table 61. North America: Off-Trade Channel Market, by Type, 2025–2035 (USD Million)
Table 62. North America: Online Distribution/E-commerce Market, by Type, 2025–2035 (USD Million)
Table 63. North America: Beverage Shelves Market, by End Use, 2025–2035 (USD Million)
Table 64. North America: Commercial Market, by Type, 2025–2035 (USD Million)
Table 65. North America: Industrial Market, by Type, 2025–2035 (USD Million)
Table 66. U.S.: Beverage Shelves Market, by Product Type, 2025–2035 (USD Million)
Table 67. U.S.: Beverage Shelves Market, by Technology, 2025–2035 (USD Million)
Table 68. U.S.: Beverage Shelves Market, by Material Type, 2025–2035 (USD Million)
Table 69. U.S.: Beverage Shelves Market, by Beverage Type, 2025–2035 (USD Million)
Table 70. U.S.: Alcoholic Beverages Market, by Type, 2025–2035 (USD Million)
Table 71. U.S.: Non-Alcoholic Beverages Market, by Type, 2025–2035 (USD Million)
Table 72. U.S.: Beverage Shelves Market, by Sales Channel, 2025–2035 (USD Million)
Table 73. U.S.: On-Trade Channel Market, by Type, 2025–2035 (USD Million)
Table 74. U.S.: Off-Trade Channel Market, by Type, 2025–2035 (USD Million)
Table 75. U.S.: Online Distribution/E-commerce Market, by Type, 2025–2035 (USD Million)
Table 76. U.S.: Beverage Shelves Market, by End Use, 2025–2035 (USD Million)
Table 77. U.S.: Commercial Market, by Type, 2025–2035 (USD Million)
Table 78. U.S.: Industrial Market, by Type, 2025–2035 (USD Million)
Table 79. Canada: Beverage Shelves Market, by Product Type, 2025–2035 (USD Million)
Table 80. Canada: Beverage Shelves Market, by Technology, 2025–2035 (USD Million)
Table 81. Canada: Beverage Shelves Market, by Material Type, 2025–2035 (USD Million)
Table 82. Canada: Beverage Shelves Market, by Beverage Type, 2025–2035 (USD Million)
Table 83. Canada: Alcoholic Beverages Market, by Type, 2025–2035 (USD Million)
Table 84. Canada: Non-Alcoholic Beverages Market, by Type, 2025–2035 (USD Million)
Table 85. Canada: Beverage Shelves Market, by Sales Channel, 2025–2035 (USD Million)
Table 86. Canada: On-Trade Channel Market, by Type, 2025–2035 (USD Million)
Table 87. Canada: Off-Trade Channel Market, by Type, 2025–2035 (USD Million)
Table 88. Canada: Online Distribution/E-commerce Market, by Type, 2025–2035 (USD Million)
Table 89. Canada: Beverage Shelves Market, by End Use, 2025–2035 (USD Million)
Table 90. Canada: Commercial Market, by Type, 2025–2035 (USD Million)
Table 91. Canada: Industrial Market, by Type, 2025–2035 (USD Million)
Table 92. Mexico: Beverage Shelves Market, by Product Type, 2025–2035 (USD Million)
Table 93. Mexico: Beverage Shelves Market, by Technology, 2025–2035 (USD Million)
Table 94. Mexico: Beverage Shelves Market, by Material Type, 2025–2035 (USD Million)
Table 95. Mexico: Beverage Shelves Market, by Beverage Type, 2025–2035 (USD Million)
Table 96. Mexico: Alcoholic Beverages Market, by Type, 2025–2035 (USD Million)
Table 97. Mexico: Non-Alcoholic Beverages Market, by Type, 2025–2035 (USD Million)
Table 98. Mexico: Beverage Shelves Market, by Sales Channel, 2025–2035 (USD Million)
Table 99. Mexico: On-Trade Channel Market, by Type, 2025–2035 (USD Million)
Table 100. Mexico: Off-Trade Channel Market, by Type, 2025–2035 (USD Million)
Table 101. Mexico: Online Distribution/E-commerce Market, by Type, 2025–2035 (USD Million)
Table 102. Mexico: Beverage Shelves Market, by End Use, 2025–2035 (USD Million)
Table 103. Mexico: Commercial Market, by Type, 2025–2035 (USD Million)
Table 104. Mexico: Industrial Market, by Type, 2025–2035 (USD Million)
Table 105. Europe: Beverage Shelves Market, by Product Type, 2025–2035 (USD Million)
Table 106. Europe: Beverage Shelves Market, by Technology, 2025–2035 (USD Million)
Table 107. Europe: Beverage Shelves Market, by Material Type, 2025–2035 (USD Million)
Table 108. Europe: Beverage Shelves Market, by Beverage Type, 2025–2035 (USD Million)
Table 109. Europe: Alcoholic Beverages Market, by Type, 2025–2035 (USD Million)
Table 110. Europe: Non-Alcoholic Beverages Market, by Type, 2025–2035 (USD Million)
Table 111. Europe: Beverage Shelves Market, by Sales Channel, 2025–2035 (USD Million)
Table 112. Europe: On-Trade Channel Market, by Type, 2025–2035 (USD Million)
Table 113. Europe: Off-Trade Channel Market, by Type, 2025–2035 (USD Million)
Table 114. Europe: Online Distribution/E-commerce Market, by Type, 2025–2035 (USD Million)
Table 115. Europe: Beverage Shelves Market, by End Use, 2025–2035 (USD Million)
Table 116. Europe: Commercial Market, by Type, 2025–2035 (USD Million)
Table 117. Europe: Industrial Market, by Type, 2025–2035 (USD Million)
Table 118. Germany: Beverage Shelves Market, by Product Type, 2025–2035 (USD Million)
Table 119. Germany: Beverage Shelves Market, by Technology, 2025–2035 (USD Million)
Table 120. Germany: Beverage Shelves Market, by Material Type, 2025–2035 (USD Million)
Table 121. Germany: Beverage Shelves Market, by Beverage Type, 2025–2035 (USD Million)
Table 122. Germany: Alcoholic Beverages Market, by Type, 2025–2035 (USD Million)
Table 123. Germany: Non-Alcoholic Beverages Market, by Type, 2025–2035 (USD Million)
Table 124. Germany: Beverage Shelves Market, by Sales Channel, 2025–2035 (USD Million)
Table 125. Germany: On-Trade Channel Market, by Type, 2025–2035 (USD Million)
Table 126. Germany: Off-Trade Channel Market, by Type, 2025–2035 (USD Million)
Table 127. Germany: Online Distribution/E-commerce Market, by Type, 2025–2035 (USD Million)
Table 128. Germany: Beverage Shelves Market, by End Use, 2025–2035 (USD Million)
Table 129. Germany: Commercial Market, by Type, 2025–2035 (USD Million)
Table 130. Germany: Industrial Market, by Type, 2025–2035 (USD Million)
Table 131. France: Beverage Shelves Market, by Product Type, 2025–2035 (USD Million)
Table 132. France: Beverage Shelves Market, by Technology, 2025–2035 (USD Million)
Table 133. France: Beverage Shelves Market, by Material Type, 2025–2035 (USD Million)
Table 134. France: Beverage Shelves Market, by Beverage Type, 2025–2035 (USD Million)
Table 135. France: Alcoholic Beverages Market, by Type, 2025–2035 (USD Million)
Table 136. France: Non-Alcoholic Beverages Market, by Type, 2025–2035 (USD Million)
Table 137. France: Beverage Shelves Market, by Sales Channel, 2025–2035 (USD Million)
Table 138. France: On-Trade Channel Market, by Type, 2025–2035 (USD Million)
Table 139. France: Off-Trade Channel Market, by Type, 2025–2035 (USD Million)
Table 140. France: Online Distribution/E-commerce Market, by Type, 2025–2035 (USD Million)
Table 141. France: Beverage Shelves Market, by End Use, 2025–2035 (USD Million)
Table 142. France: Commercial Market, by Type, 2025–2035 (USD Million)
Table 143. France: Industrial Market, by Type, 2025–2035 (USD Million)
Table 144. U.K.: Beverage Shelves Market, by Product Type, 2025–2035 (USD Million)
Table 145. U.K.: Beverage Shelves Market, by Technology, 2025–2035 (USD Million)
Table 146. U.K.: Beverage Shelves Market, by Material Type, 2025–2035 (USD Million)
Table 147. U.K.: Beverage Shelves Market, by Beverage Type, 2025–2035 (USD Million)
Table 148. U.K.: Alcoholic Beverages Market, by Type, 2025–2035 (USD Million)
Table 149. U.K.: Non-Alcoholic Beverages Market, by Type, 2025–2035 (USD Million)
Table 150. U.K.: Beverage Shelves Market, by Sales Channel, 2025–2035 (USD Million)
Table 151. U.K.: On-Trade Channel Market, by Type, 2025–2035 (USD Million)
Table 152. U.K.: Off-Trade Channel Market, by Type, 2025–2035 (USD Million)
Table 153. U.K.: Online Distribution/E-commerce Market, by Type, 2025–2035 (USD Million)
Table 154. U.K.: Beverage Shelves Market, by End Use, 2025–2035 (USD Million)
Table 155. U.K.: Commercial Market, by Type, 2025–2035 (USD Million)
Table 156. U.K.: Industrial Market, by Type, 2025–2035 (USD Million)
Table 157. Italy: Beverage Shelves Market, by Product Type, 2025–2035 (USD Million)
Table 158. Italy: Beverage Shelves Market, by Technology, 2025–2035 (USD Million)
Table 159. Italy: Beverage Shelves Market, by Material Type, 2025–2035 (USD Million)
Table 160. Italy: Beverage Shelves Market, by Beverage Type, 2025–2035 (USD Million)
Table 161. Italy: Alcoholic Beverages Market, by Type, 2025–2035 (USD Million)
Table 162. Italy: Non-Alcoholic Beverages Market, by Type, 2025–2035 (USD Million)
Table 163. Italy: Beverage Shelves Market, by Sales Channel, 2025–2035 (USD Million)
Table 164. Italy: On-Trade Channel Market, by Type, 2025–2035 (USD Million)
Table 165. Italy: Off-Trade Channel Market, by Type, 2025–2035 (USD Million)
Table 166. Italy: Online Distribution/E-commerce Market, by Type, 2025–2035 (USD Million)
Table 167. Italy: Beverage Shelves Market, by End Use, 2025–2035 (USD Million)
Table 168. Italy: Commercial Market, by Type, 2025–2035 (USD Million)
Table 169. Italy: Industrial Market, by Type, 2025–2035 (USD Million)
Table 170. Spain: Beverage Shelves Market, by Product Type, 2025–2035 (USD Million)
Table 171. Spain: Beverage Shelves Market, by Technology, 2025–2035 (USD Million)
Table 172. Spain: Beverage Shelves Market, by Material Type, 2025–2035 (USD Million)
Table 173. Spain: Beverage Shelves Market, by Beverage Type, 2025–2035 (USD Million)
Table 174. Spain: Alcoholic Beverages Market, by Type, 2025–2035 (USD Million)
Table 175. Spain: Non-Alcoholic Beverages Market, by Type, 2025–2035 (USD Million)
Table 176. Spain: Beverage Shelves Market, by Sales Channel, 2025–2035 (USD Million)
Table 177. Spain: On-Trade Channel Market, by Type, 2025–2035 (USD Million)
Table 178. Spain: Off-Trade Channel Market, by Type, 2025–2035 (USD Million)
Table 179. Spain: Online Distribution/E-commerce Market, by Type, 2025–2035 (USD Million)
Table 180. Spain: Beverage Shelves Market, by End Use, 2025–2035 (USD Million)
Table 181. Spain: Commercial Market, by Type, 2025–2035 (USD Million)
Table 182. Spain: Industrial Market, by Type, 2025–2035 (USD Million)
Table 183. Netherlands: Beverage Shelves Market, by Product Type, 2025–2035 (USD Million)
Table 184. Netherlands: Beverage Shelves Market, by Technology, 2025–2035 (USD Million)
Table 185. Netherlands: Beverage Shelves Market, by Material Type, 2025–2035 (USD Million)
Table 186. Netherlands: Beverage Shelves Market, by Beverage Type, 2025–2035 (USD Million)
Table 187. Netherlands: Alcoholic Beverages Market, by Type, 2025–2035 (USD Million)
Table 188. Netherlands: Non-Alcoholic Beverages Market, by Type, 2025–2035 (USD Million)
Table 189. Netherlands: Beverage Shelves Market, by Sales Channel, 2025–2035 (USD Million)
Table 190. Netherlands: On-Trade Channel Market, by Type, 2025–2035 (USD Million)
Table 191. Netherlands: Off-Trade Channel Market, by Type, 2025–2035 (USD Million)
Table 192. Netherlands: Online Distribution/E-commerce Market, by Type, 2025–2035 (USD Million)
Table 193. Netherlands: Beverage Shelves Market, by End Use, 2025–2035 (USD Million)
Table 194. Netherlands: Commercial Market, by Type, 2025–2035 (USD Million)
Table 195. Netherlands: Industrial Market, by Type, 2025–2035 (USD Million)
Table 196. Rest of Europe: Beverage Shelves Market, by Product Type, 2025–2035 (USD Million)
Table 197. Rest of Europe: Beverage Shelves Market, by Technology, 2025–2035 (USD Million)
Table 198. Rest of Europe: Beverage Shelves Market, by Material Type, 2025–2035 (USD Million)
Table 199. Rest of Europe: Beverage Shelves Market, by Beverage Type, 2025–2035 (USD Million)
Table 200. Rest of Europe: Alcoholic Beverages Market, by Type, 2025–2035 (USD Million)
Table 201. Rest of Europe: Non-Alcoholic Beverages Market, by Type, 2025–2035 (USD Million)
Table 202. Rest of Europe: Beverage Shelves Market, by Sales Channel, 2025–2035 (USD Million)
Table 203. Rest of Europe: On-Trade Channel Market, by Type, 2025–2035 (USD Million)
Table 204. Rest of Europe: Off-Trade Channel Market, by Type, 2025–2035 (USD Million)
Table 205. Rest of Europe: Online Distribution/E-commerce Market, by Type, 2025–2035 (USD Million)
Table 206. Rest of Europe: Beverage Shelves Market, by End Use, 2025–2035 (USD Million)
Table 207. Rest of Europe: Commercial Market, by Type, 2025–2035 (USD Million)
Table 208. Rest of Europe: Industrial Market, by Type, 2025–2035 (USD Million)
Table 209. Asia-Pacific: Beverage Shelves Market, by Product Type, 2025–2035 (USD Million)
Table 210. Asia-Pacific: Beverage Shelves Market, by Technology, 2025–2035 (USD Million)
Table 211. Asia-Pacific: Beverage Shelves Market, by Material Type, 2025–2035 (USD Million)
Table 212. Asia-Pacific: Beverage Shelves Market, by Beverage Type, 2025–2035 (USD Million)
Table 213. Asia-Pacific: Alcoholic Beverages Market, by Type, 2025–2035 (USD Million)
Table 214. Asia-Pacific: Non-Alcoholic Beverages Market, by Type, 2025–2035 (USD Million)
Table 215. Asia-Pacific: Beverage Shelves Market, by Sales Channel, 2025–2035 (USD Million)
Table 216. Asia-Pacific: On-Trade Channel Market, by Type, 2025–2035 (USD Million)
Table 217. Asia-Pacific: Off-Trade Channel Market, by Type, 2025–2035 (USD Million)
Table 218. Asia-Pacific: Online Distribution/E-commerce Market, by Type, 2025–2035 (USD Million)
Table 219. Asia-Pacific: Beverage Shelves Market, by End Use, 2025–2035 (USD Million)
Table 220. Asia-Pacific: Commercial Market, by Type, 2025–2035 (USD Million)
Table 221. Asia-Pacific: Industrial Market, by Type, 2025–2035 (USD Million)
Table 222. China: Beverage Shelves Market, by Product Type, 2025–2035 (USD Million)
Table 223. China: Beverage Shelves Market, by Technology, 2025–2035 (USD Million)
Table 224. China: Beverage Shelves Market, by Material Type, 2025–2035 (USD Million)
Table 225. China: Beverage Shelves Market, by Beverage Type, 2025–2035 (USD Million)
Table 226. China: Alcoholic Beverages Market, by Type, 2025–2035 (USD Million)
Table 227. China: Non-Alcoholic Beverages Market, by Type, 2025–2035 (USD Million)
Table 228. China: Beverage Shelves Market, by Sales Channel, 2025–2035 (USD Million)
Table 229. China: On-Trade Channel Market, by Type, 2025–2035 (USD Million)
Table 230. China: Off-Trade Channel Market, by Type, 2025–2035 (USD Million)
Table 231. China: Online Distribution/E-commerce Market, by Type, 2025–2035 (USD Million)
Table 232. China: Beverage Shelves Market, by End Use, 2025–2035 (USD Million)
Table 233. China: Commercial Market, by Type, 2025–2035 (USD Million)
Table 234. China: Industrial Market, by Type, 2025–2035 (USD Million)
Table 235. Japan: Beverage Shelves Market, by Product Type, 2025–2035 (USD Million)
Table 236. Japan: Beverage Shelves Market, by Technology, 2025–2035 (USD Million)
Table 237. Japan: Beverage Shelves Market, by Material Type, 2025–2035 (USD Million)
Table 238. Japan: Beverage Shelves Market, by Beverage Type, 2025–2035 (USD Million)
Table 239. Japan: Alcoholic Beverages Market, by Type, 2025–2035 (USD Million)
Table 240. Japan: Non-Alcoholic Beverages Market, by Type, 2025–2035 (USD Million)
Table 241. Japan: Beverage Shelves Market, by Sales Channel, 2025–2035 (USD Million)
Table 242. Japan: On-Trade Channel Market, by Type, 2025–2035 (USD Million)
Table 243. Japan: Off-Trade Channel Market, by Type, 2025–2035 (USD Million)
Table 244. Japan: Online Distribution/E-commerce Market, by Type, 2025–2035 (USD Million)
Table 245. Japan: Beverage Shelves Market, by End Use, 2025–2035 (USD Million)
Table 246. Japan: Commercial Market, by Type, 2025–2035 (USD Million)
Table 247. Japan: Industrial Market, by Type, 2025–2035 (USD Million)
Table 248. India: Beverage Shelves Market, by Product Type, 2025–2035 (USD Million)
Table 249. India: Beverage Shelves Market, by Technology, 2025–2035 (USD Million)
Table 250. India: Beverage Shelves Market, by Material Type, 2025–2035 (USD Million)
Table 251. India: Beverage Shelves Market, by Beverage Type, 2025–2035 (USD Million)
Table 252. India: Alcoholic Beverages Market, by Type, 2025–2035 (USD Million)
Table 253. India: Non-Alcoholic Beverages Market, by Type, 2025–2035 (USD Million)
Table 254. India: Beverage Shelves Market, by Sales Channel, 2025–2035 (USD Million)
Table 255. India: On-Trade Channel Market, by Type, 2025–2035 (USD Million)
Table 256. India: Off-Trade Channel Market, by Type, 2025–2035 (USD Million)
Table 257. India: Online Distribution/E-commerce Market, by Type, 2025–2035 (USD Million)
Table 258. India: Beverage Shelves Market, by End Use, 2025–2035 (USD Million)
Table 259. India: Commercial Market, by Type, 2025–2035 (USD Million)
Table 260. India: Industrial Market, by Type, 2025–2035 (USD Million)
Table 261. South Korea: Beverage Shelves Market, by Product Type, 2025–2035 (USD Million)
Table 262. South Korea: Beverage Shelves Market, by Technology, 2025–2035 (USD Million)
Table 263. South Korea: Beverage Shelves Market, by Material Type, 2025–2035 (USD Million)
Table 264. South Korea: Beverage Shelves Market, by Beverage Type, 2025–2035 (USD Million)
Table 265. South Korea: Alcoholic Beverages Market, by Type, 2025–2035 (USD Million)
Table 266. South Korea: Non-Alcoholic Beverages Market, by Type, 2025–2035 (USD Million)
Table 267. South Korea: Beverage Shelves Market, by Sales Channel, 2025–2035 (USD Million)
Table 268. South Korea: On-Trade Channel Market, by Type, 2025–2035 (USD Million)
Table 269. South Korea: Off-Trade Channel Market, by Type, 2025–2035 (USD Million)
Table 270. South Korea: Online Distribution/E-commerce Market, by Type, 2025–2035 (USD Million)
Table 271. South Korea: Beverage Shelves Market, by End Use, 2025–2035 (USD Million)
Table 272. South Korea: Commercial Market, by Type, 2025–2035 (USD Million)
Table 273. South Korea: Industrial Market, by Type, 2025–2035 (USD Million)
Table 274. Australia: Beverage Shelves Market, by Product Type, 2025–2035 (USD Million)
Table 275. Australia: Beverage Shelves Market, by Technology, 2025–2035 (USD Million)
Table 276. Australia: Beverage Shelves Market, by Material Type, 2025–2035 (USD Million)
Table 277. Australia: Beverage Shelves Market, by Beverage Type, 2025–2035 (USD Million)
Table 278. Australia: Alcoholic Beverages Market, by Type, 2025–2035 (USD Million)
Table 279. Australia: Non-Alcoholic Beverages Market, by Type, 2025–2035 (USD Million)
Table 280. Australia: Beverage Shelves Market, by Sales Channel, 2025–2035 (USD Million)
Table 281. Australia: On-Trade Channel Market, by Type, 2025–2035 (USD Million)
Table 282. Australia: Off-Trade Channel Market, by Type, 2025–2035 (USD Million)
Table 283. Australia: Online Distribution/E-commerce Market, by Type, 2025–2035 (USD Million)
Table 284. Australia: Beverage Shelves Market, by End Use, 2025–2035 (USD Million)
Table 285. Australia: Commercial Market, by Type, 2025–2035 (USD Million)
Table 286. Australia: Industrial Market, by Type, 2025–2035 (USD Million)
Table 287. Rest of Asia-Pacific: Beverage Shelves Market, by Product Type, 2025–2035 (USD Million)
Table 288. Rest of Asia-Pacific: Beverage Shelves Market, by Technology, 2025–2035 (USD Million)
Table 289. Rest of Asia-Pacific: Beverage Shelves Market, by Material Type, 2025–2035 (USD Million)
Table 290. Rest of Asia-Pacific: Beverage Shelves Market, by Beverage Type, 2025–2035 (USD Million)
Table 291. Rest of Asia-Pacific: Alcoholic Beverages Market, by Type, 2025–2035 (USD Million)
Table 292. Rest of Asia-Pacific: Non-Alcoholic Beverages Market, by Type, 2025–2035 (USD Million)
Table 293. Rest of Asia-Pacific: Beverage Shelves Market, by Sales Channel, 2025–2035 (USD Million)
Table 294. Rest of Asia-Pacific: On-Trade Channel Market, by Type, 2025–2035 (USD Million)
Table 295. Rest of Asia-Pacific: Off-Trade Channel Market, by Type, 2025–2035 (USD Million)
Table 296. Rest of Asia-Pacific: Online Distribution/E-commerce Market, by Type, 2025–2035 (USD Million)
Table 297. Rest of Asia-Pacific: Beverage Shelves Market, by End Use, 2025–2035 (USD Million)
Table 298. Rest of Asia-Pacific: Commercial Market, by Type, 2025–2035 (USD Million)
Table 299. Rest of Asia-Pacific: Industrial Market, by Type, 2025–2035 (USD Million)
Table 300. Latin America: Beverage Shelves Market, by Product Type, 2025–2035 (USD Million)
Table 301. Latin America: Beverage Shelves Market, by Technology, 2025–2035 (USD Million)
Table 302. Latin America: Beverage Shelves Market, by Material Type, 2025–2035 (USD Million)
Table 303. Latin America: Beverage Shelves Market, by Beverage Type, 2025–2035 (USD Million)
Table 304. Latin America: Alcoholic Beverages Market, by Type, 2025–2035 (USD Million)
Table 305. Latin America: Non-Alcoholic Beverages Market, by Type, 2025–2035 (USD Million)
Table 306. Latin America: Beverage Shelves Market, by Sales Channel, 2025–2035 (USD Million)
Table 307. Latin America: On-Trade Channel Market, by Type, 2025–2035 (USD Million)
Table 308. Latin America: Off-Trade Channel Market, by Type, 2025–2035 (USD Million)
Table 309. Latin America: Online Distribution/E-commerce Market, by Type, 2025–2035 (USD Million)
Table 310. Latin America: Beverage Shelves Market, by End Use, 2025–2035 (USD Million)
Table 311. Latin America: Commercial Market, by Type, 2025–2035 (USD Million)
Table 312. Latin America: Industrial Market, by Type, 2025–2035 (USD Million)
Table 313. Brazil: Beverage Shelves Market, by Product Type, 2025–2035 (USD Million)
Table 314. Brazil: Beverage Shelves Market, by Technology, 2025–2035 (USD Million)
Table 315. Brazil: Beverage Shelves Market, by Material Type, 2025–2035 (USD Million)
Table 316. Brazil: Beverage Shelves Market, by Beverage Type, 2025–2035 (USD Million)
Table 317. Brazil: Alcoholic Beverages Market, by Type, 2025–2035 (USD Million)
Table 318. Brazil: Non-Alcoholic Beverages Market, by Type, 2025–2035 (USD Million)
Table 319. Brazil: Beverage Shelves Market, by Sales Channel, 2025–2035 (USD Million)
Table 320. Brazil: On-Trade Channel Market, by Type, 2025–2035 (USD Million)
Table 321. Brazil: Off-Trade Channel Market, by Type, 2025–2035 (USD Million)
Table 322. Brazil: Online Distribution/E-commerce Market, by Type, 2025–2035 (USD Million)
Table 323. Brazil: Beverage Shelves Market, by End Use, 2025–2035 (USD Million)
Table 324. Brazil: Commercial Market, by Type, 2025–2035 (USD Million)
Table 325. Brazil: Industrial Market, by Type, 2025–2035 (USD Million)
Table 326. Argentina: Beverage Shelves Market, by Product Type, 2025–2035 (USD Million)
Table 327. Argentina: Beverage Shelves Market, by Technology, 2025–2035 (USD Million)
Table 328. Argentina: Beverage Shelves Market, by Material Type, 2025–2035 (USD Million)
Table 329. Argentina: Beverage Shelves Market, by Beverage Type, 2025–2035 (USD Million)
Table 330. Argentina: Alcoholic Beverages Market, by Type, 2025–2035 (USD Million)
Table 331. Argentina: Non-Alcoholic Beverages Market, by Type, 2025–2035 (USD Million)
Table 332. Argentina: Beverage Shelves Market, by Sales Channel, 2025–2035 (USD Million)
Table 333. Argentina: On-Trade Channel Market, by Type, 2025–2035 (USD Million)
Table 334. Argentina: Off-Trade Channel Market, by Type, 2025–2035 (USD Million)
Table 335. Argentina: Online Distribution/E-commerce Market, by Type, 2025–2035 (USD Million)
Table 336. Argentina: Beverage Shelves Market, by End Use, 2025–2035 (USD Million)
Table 337. Argentina: Commercial Market, by Type, 2025–2035 (USD Million)
Table 338. Argentina: Industrial Market, by Type, 2025–2035 (USD Million)
Table 339. Rest of Latin America: Beverage Shelves Market, by Product Type, 2025–2035 (USD Million)
Table 340. Rest of Latin America: Beverage Shelves Market, by Technology, 2025–2035 (USD Million)
Table 341. Rest of Latin America: Beverage Shelves Market, by Material Type, 2025–2035 (USD Million)
Table 342. Rest of Latin America: Beverage Shelves Market, by Beverage Type, 2025–2035 (USD Million)
Table 343. Rest of Latin America: Alcoholic Beverages Market, by Type, 2025–2035 (USD Million)
Table 344. Rest of Latin America: Non-Alcoholic Beverages Market, by Type, 2025–2035 (USD Million)
Table 345. Rest of Latin America: Beverage Shelves Market, by Sales Channel, 2025–2035 (USD Million)
Table 346. Rest of Latin America: On-Trade Channel Market, by Type, 2025–2035 (USD Million)
Table 347. Rest of Latin America: Off-Trade Channel Market, by Type, 2025–2035 (USD Million)
Table 348. Rest of Latin America: Online Distribution/E-commerce Market, by Type, 2025–2035 (USD Million)
Table 349. Rest of Latin America: Beverage Shelves Market, by End Use, 2025–2035 (USD Million)
Table 350. Rest of Latin America: Commercial Market, by Type, 2025–2035 (USD Million)
Table 351. Rest of Latin America: Industrial Market, by Type, 2025–2035 (USD Million)
Table 352. Middle East & Africa: Beverage Shelves Market, by Product Type, 2025–2035 (USD Million)
Table 353. Middle East & Africa: Beverage Shelves Market, by Technology, 2025–2035 (USD Million)
Table 354. Middle East & Africa: Beverage Shelves Market, by Material Type, 2025–2035 (USD Million)
Table 355. Middle East & Africa: Beverage Shelves Market, by Beverage Type, 2025–2035 (USD Million)
Table 356. Middle East & Africa: Alcoholic Beverages Market, by Type, 2025–2035 (USD Million)
Table 357. Middle East & Africa: Non-Alcoholic Beverages Market, by Type, 2025–2035 (USD Million)
Table 358. Middle East & Africa: Beverage Shelves Market, by Sales Channel, 2025–2035 (USD Million)
Table 359. Middle East & Africa: On-Trade Channel Market, by Type, 2025–2035 (USD Million)
Table 360. Middle East & Africa: Off-Trade Channel Market, by Type, 2025–2035 (USD Million)
Table 361. Middle East & Africa: Online Distribution/E-commerce Market, by Type, 2025–2035 (USD Million)
Table 362. Middle East & Africa: Beverage Shelves Market, by End Use, 2025–2035 (USD Million)
Table 363. Middle East & Africa: Commercial Market, by Type, 2025–2035 (USD Million)
Table 364. Middle East & Africa: Industrial Market, by Type, 2025–2035 (USD Million)
Table 365. Saudi Arabia: Beverage Shelves Market, by Product Type, 2025–2035 (USD Million)
Table 366. Saudi Arabia: Beverage Shelves Market, by Technology, 2025–2035 (USD Million)
Table 367. Saudi Arabia: Beverage Shelves Market, by Material Type, 2025–2035 (USD Million)
Table 368. Saudi Arabia: Beverage Shelves Market, by Beverage Type, 2025–2035 (USD Million)
Table 369. Saudi Arabia: Alcoholic Beverages Market, by Type, 2025–2035 (USD Million)
Table 370. Saudi Arabia: Non-Alcoholic Beverages Market, by Type, 2025–2035 (USD Million)
Table 371. Saudi Arabia: Beverage Shelves Market, by Sales Channel, 2025–2035 (USD Million)
Table 372. Saudi Arabia: On-Trade Channel Market, by Type, 2025–2035 (USD Million)
Table 373. Saudi Arabia: Off-Trade Channel Market, by Type, 2025–2035 (USD Million)
Table 374. Saudi Arabia: Online Distribution/E-commerce Market, by Type, 2025–2035 (USD Million)
Table 375. Saudi Arabia: Beverage Shelves Market, by End Use, 2025–2035 (USD Million)
Table 376. Saudi Arabia: Commercial Market, by Type, 2025–2035 (USD Million)
Table 377. Saudi Arabia: Industrial Market, by Type, 2025–2035 (USD Million)
Table 378. United Arab Emirates: Beverage Shelves Market, by Product Type, 2025–2035 (USD Million)
Table 379. United Arab Emirates: Beverage Shelves Market, by Technology, 2025–2035 (USD Million)
Table 380. United Arab Emirates: Beverage Shelves Market, by Material Type, 2025–2035 (USD Million)
Table 381. United Arab Emirates: Beverage Shelves Market, by Beverage Type, 2025–2035 (USD Million)
Table 382. United Arab Emirates: Alcoholic Beverages Market, by Type, 2025–2035 (USD Million)
Table 383. United Arab Emirates: Non-Alcoholic Beverages Market, by Type, 2025–2035 (USD Million)
Table 384. United Arab Emirates: Beverage Shelves Market, by Sales Channel, 2025–2035 (USD Million)
Table 385. United Arab Emirates: On-Trade Channel Market, by Type, 2025–2035 (USD Million)
Table 386. United Arab Emirates: Off-Trade Channel Market, by Type, 2025–2035 (USD Million)
Table 387. United Arab Emirates: Online Distribution/E-commerce Market, by Type, 2025–2035 (USD Million)
Table 388. United Arab Emirates: Beverage Shelves Market, by End Use, 2025–2035 (USD Million)
Table 389. United Arab Emirates: Commercial Market, by Type, 2025–2035 (USD Million)
Table 390. United Arab Emirates: Industrial Market, by Type, 2025–2035 (USD Million)
Table 391. South Africa: Beverage Shelves Market, by Product Type, 2025–2035 (USD Million)
Table 392. South Africa: Beverage Shelves Market, by Technology, 2025–2035 (USD Million)
Table 393. South Africa: Beverage Shelves Market, by Material Type, 2025–2035 (USD Million)
Table 394. South Africa: Beverage Shelves Market, by Beverage Type, 2025–2035 (USD Million)
Table 395. South Africa: Alcoholic Beverages Market, by Type, 2025–2035 (USD Million)
Table 396. South Africa: Non-Alcoholic Beverages Market, by Type, 2025–2035 (USD Million)
Table 397. South Africa: Beverage Shelves Market, by Sales Channel, 2025–2035 (USD Million)
Table 398. South Africa: On-Trade Channel Market, by Type, 2025–2035 (USD Million)
Table 399. South Africa: Off-Trade Channel Market, by Type, 2025–2035 (USD Million)
Table 400. South Africa: Online Distribution/E-commerce Market, by Type, 2025–2035 (USD Million)
Table 401. South Africa: Beverage Shelves Market, by End Use, 2025–2035 (USD Million)
Table 402. South Africa: Commercial Market, by Type, 2025–2035 (USD Million)
Table 403. South Africa: Industrial Market, by Type, 2025–2035 (USD Million)
Table 404. Rest of Middle East & Africa: Beverage Shelves Market, by Product Type, 2025–2035 (USD Million)
Table 405. Rest of Middle East & Africa: Beverage Shelves Market, by Technology, 2025–2035 (USD Million)
Table 406. Rest of Middle East & Africa: Beverage Shelves Market, by Material Type, 2025–2035 (USD Million)
Table 407. Rest of Middle East & Africa: Beverage Shelves Market, by Beverage Type, 2025–2035 (USD Million)
Table 408. Rest of Middle East & Africa: Alcoholic Beverages Market, by Type, 2025–2035 (USD Million)
Table 409. Rest of Middle East & Africa: Non-Alcoholic Beverages Market, by Type, 2025–2035 (USD Million)
Table 410. Rest of Middle East & Africa: Beverage Shelves Market, by Sales Channel, 2025–2035 (USD Million)
Table 411. Rest of Middle East & Africa: On-Trade Channel Market, by Type, 2025–2035 (USD Million)
Table 412. Rest of Middle East & Africa: Off-Trade Channel Market, by Type, 2025–2035 (USD Million)
Table 413. Rest of Middle East & Africa: Online Distribution/E-commerce Market, by Type, 2025–2035 (USD Million)
Table 414. Rest of Middle East & Africa: Beverage Shelves Market, by End Use, 2025–2035 (USD Million)
Table 415. Rest of Middle East & Africa: Commercial Market, by Type, 2025–2035 (USD Million)
Table 416. Rest of Middle East & Africa: Industrial Market, by Type, 2025–2035 (USD Million)
LIST OF FIGURES
Figure 1. Research Process
Figure 2. Secondary Sources Referenced for This Study
Figure 3. Primary Research Techniques
Figure 4. Key Executives Interviewed
Figure 5. Breakdown of Primary Interviews (Supply Side & Demand Side)
Figure 6. Market Sizing and Growth Forecast Approach
Figure 7. In 2025, the Fixed Shelves segment to Account for the Largest Share
Figure 8. In 2025, the Conventional Shelving Systems to Account for the Largest Share
Figure 9. In 2025, the Steel Shelving to Account for the Largest Share
Figure 10. In 2025, the Non-Alcoholic Beverages to Account for the Largest Share
Figure 11. In 2025, the Off-Trade Channel to Account for the Largest Share
Figure 12. In 2025, the Beverage Shelves Market for Commercial sector to Account for the Largest Share
Figure 13. Asia-Pacific to be the Fastest-growing Regional Market
Figure 14. Impact Analysis of Market Dynamics
Figure 15. Global Beverage Shelves Market: Porter's Five Forces Analysis
Figure 16. Global Beverage Shelves Market, by Product Type, 2025 Vs. 2035 (USD Million)
Figure 17. Global Beverage Shelves Market, by Technology, 2025 Vs. 2035 (USD Million)
Figure 18. Global Beverage Shelves Market, by Material Type, 2025 Vs. 2035 (USD Million)
Figure 19. Global Beverage Shelves Market, by Beverage Type, 2025 Vs. 2035 (USD Million)
Figure 20. Global Beverage Shelves Market, by Sales Channel, 2025 Vs. 2035 (USD Million)
Figure 21. Global Beverage Shelves Market, by End Use, 2025 Vs. 2035 (USD Million)
Figure 22. Global Beverage Shelves Market, by Region, 2025 Vs. 2035 (USD Million)
Figure 23. North America: Beverage Shelves Market Snapshot (2025)
Figure 24. Europe: Beverage Shelves Market Snapshot (2025)
Figure 25. Asia-Pacific: Beverage Shelves Market Snapshot (2025)
Figure 26. Latin America: Beverage Shelves Market Snapshot (2025)
Figure 27. Middle East & Africa: Beverage Shelves Market Snapshot (2025)
Figure 28. Key Growth Strategies Adopted by Leading Players (2022–2025)
Figure 29. Global Beverage Shelves Market Competitive Benchmarking, by Product Type
Figure 30. Competitive Dashboard: Global Beverage Shelves Market
Figure 31. Global Beverage Shelves Market Share/Ranking, by Key Player, 2024 (%)
Figure 32. Trion Industries Inc.: Financial Overview (2024)
Figure 33. Madix Inc.: Financial Overview (2024)
Figure 34. Lozier Corporation: Financial Overview (2024)
Figure 35. Gondola Shelving: Financial Overview (2024)
Figure 36. Husmann Corporation: Financial Overview (2024)
Figure 37. Artitalia Group: Financial Overview (2024)
Figure 38. Hygiena LLC: Financial Overview (2024)
Figure 39. Metalware Corporation: Financial Overview (2024)
Figure 40. Shelving Inc.: Financial Overview (2024)
Figure 41. Borgen Systems AS: Financial Overview (2024)
Figure 42. Dexion: Financial Overview (2024)
Figure 43. Tegometall International AG: Financial Overview (2024)
Figure 44. Uniweb Inc.: Financial Overview (2024)
Figure 45. Spacesaver Corporation: Financial Overview (2024)
Figure 46. Caem S.r.l.: Financial Overview (2024)


Published Date: Feb-2026
Published Date: Feb-2026
Published Date: Jan-2025
Published Date: Dec-2024
Published Date: Jun-2024
Subscribe to get the latest industry updates