Resources
About Us
Functional Food and Beverages Market by Type (Functional Foods, Functional Beverages), Application (Health & Wellness, Immunity, Digestive Health, Sports Nutrition, Weight Management, Clinical Nutrition, Cardio Health), and Distribution Channel – Global Forecast to 2036
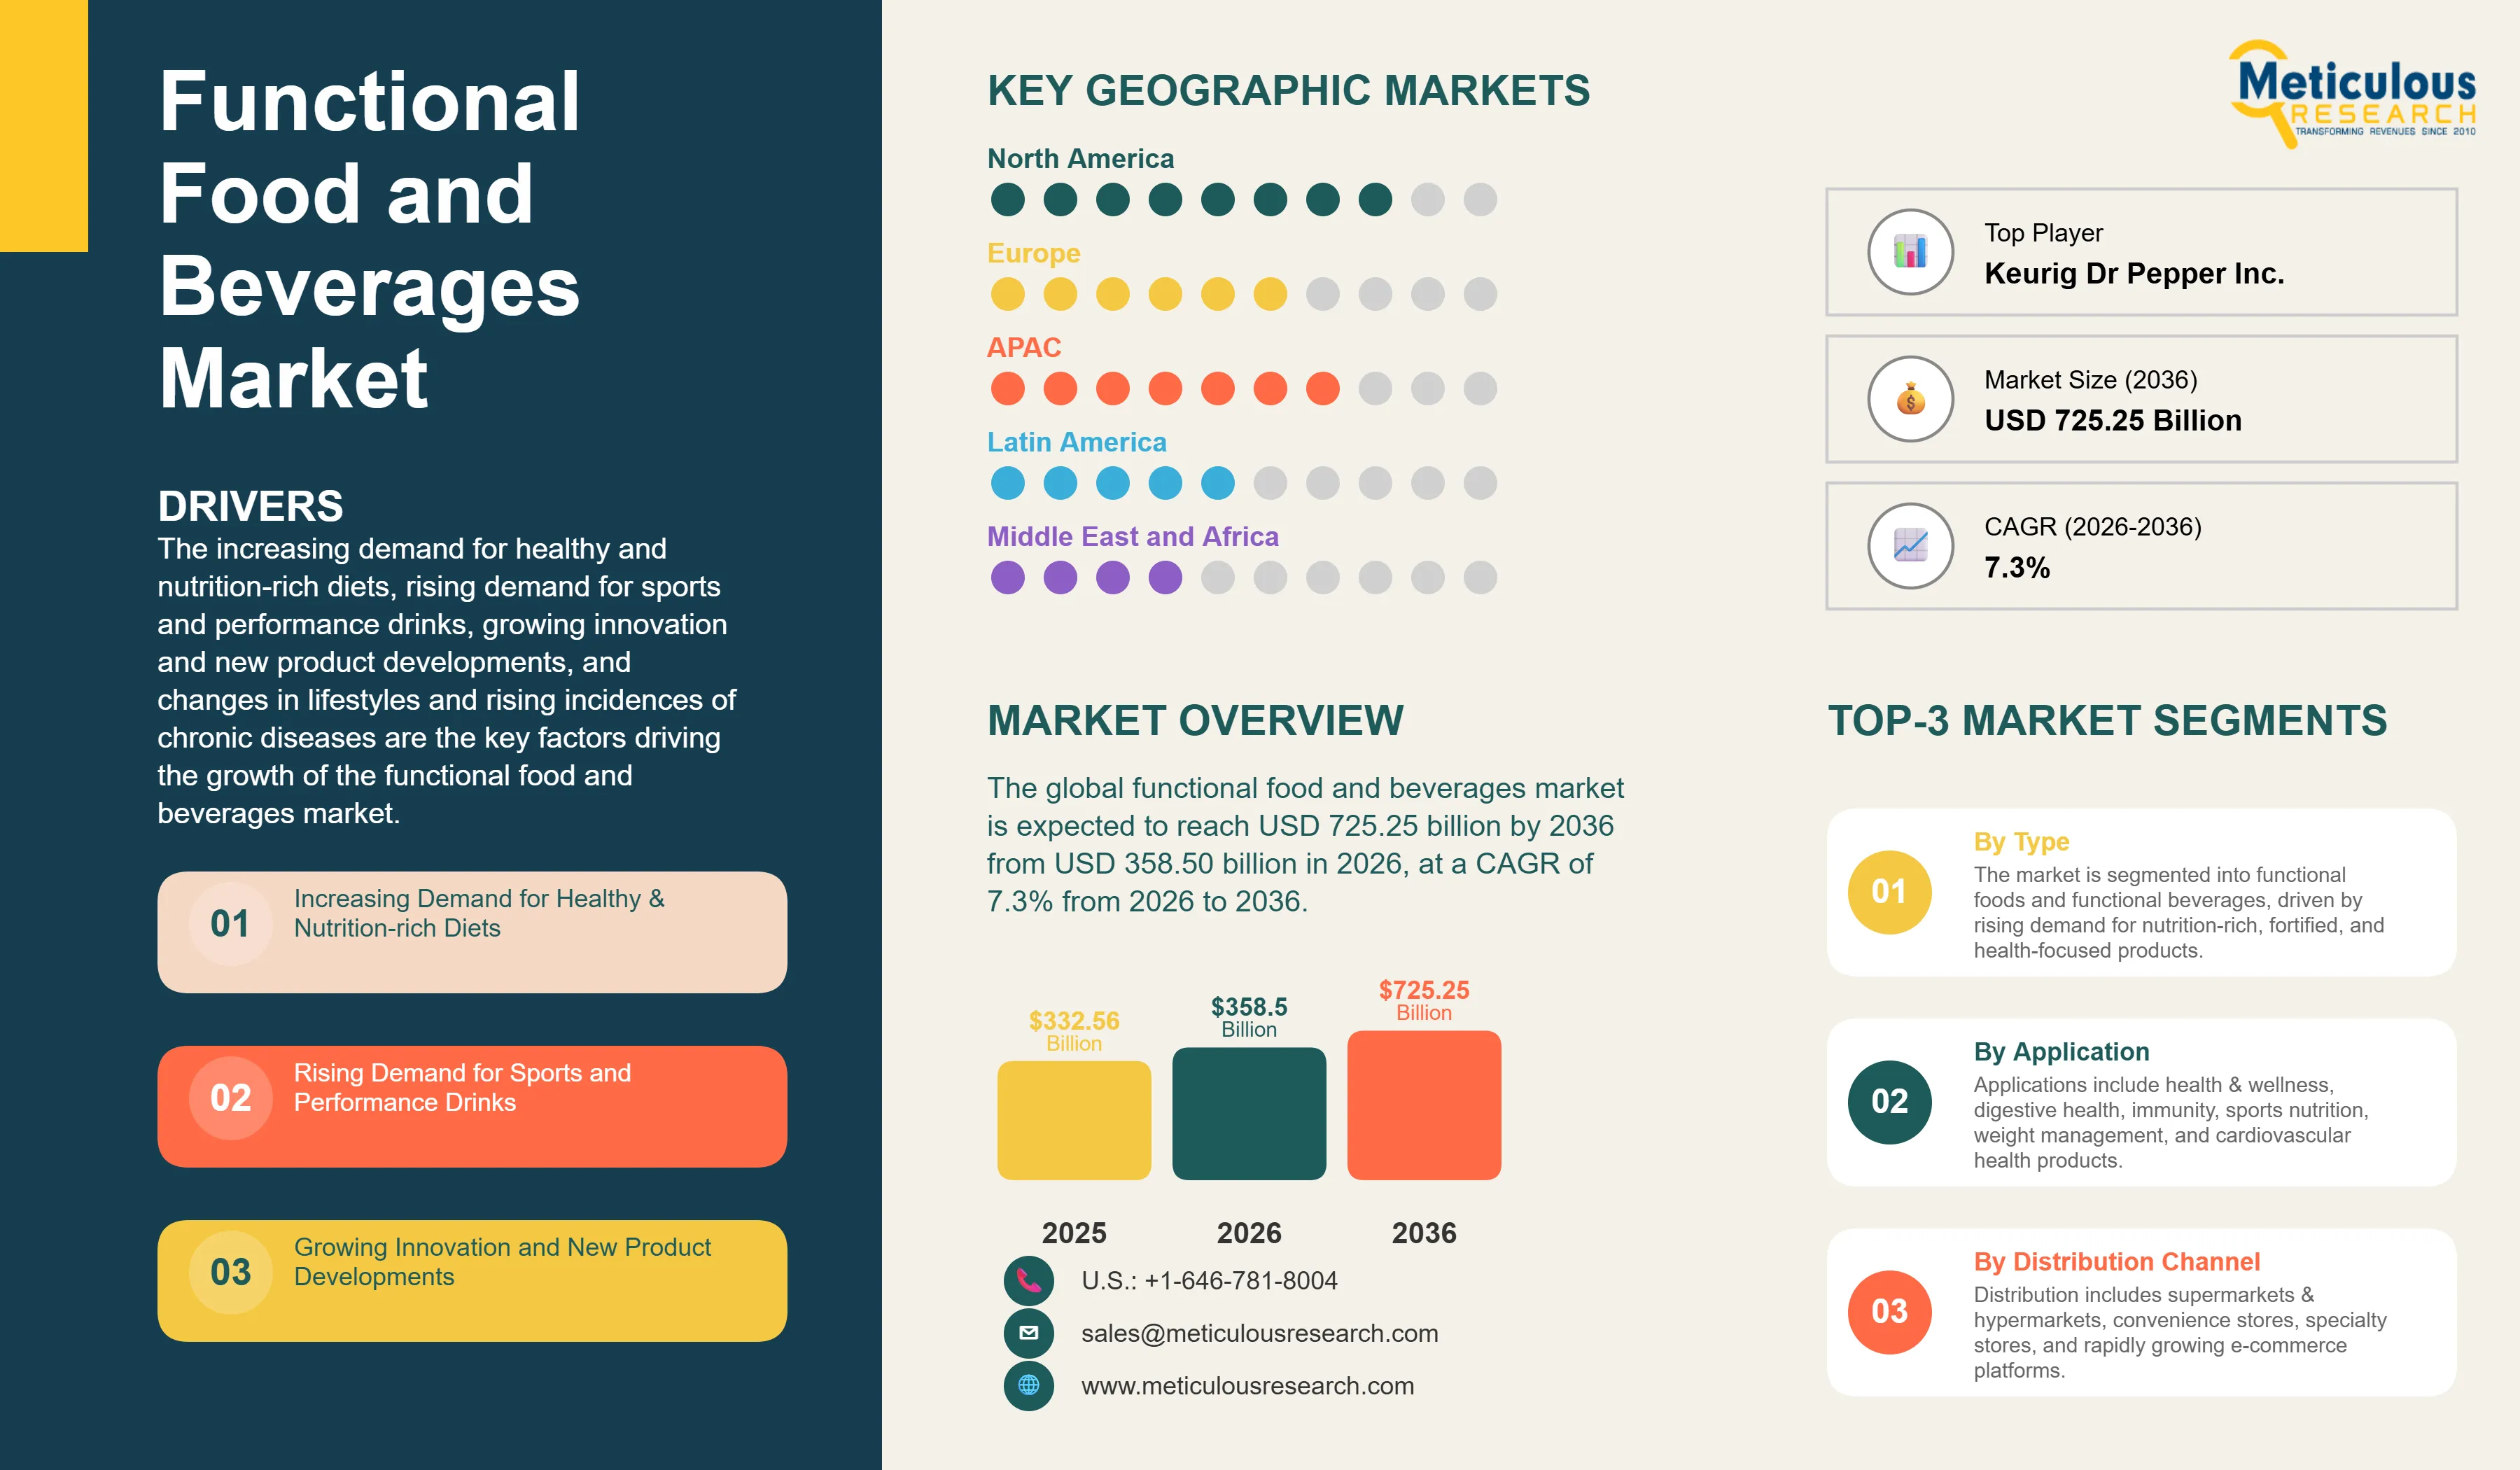
Report ID: MRFB - 104784 Pages: 226 Feb-2026 Formats*: PDF Category: Food and Beverages Delivery: 24 to 48 Hours Download Free Sample ReportThe global functional food and beverages market was valued at USD 332.56 billion in 2025. This market is expected to reach USD 725.25 billion by 2036 from USD 358.50 billion in 2026, at a CAGR of 7.3% from 2026 to 2036.
The increasing demand for healthy and nutrition-rich diets, rising demand for sports and performance drinks, growing innovation and new product developments, and changes in lifestyles and rising incidences of chronic diseases are the key factors driving the growth of the functional food and beverages market. Furthermore, the increased investment and expansions in the functional food and beverages industry and rapid growth in the retail sector are expected to offer significant opportunities for the players operating in this market.
 Click here to: Get Free Sample Pages of this Report
Functional food and beverages are food and drink products that are fortified or enriched with bioactive ingredients such as vitamins, minerals, probiotics, prebiotics, dietary fiber, omega-3 fatty acids, and antioxidants, beyond their basic nutritional value, in order to provide additional health benefits to consumers. Functional foods include fortified dairy products, enriched bakery and cereal products, functional snacks, and infant food products, among others. Functional beverages include energy drinks, sports and hydration drinks, fortified juices, probiotic and prebiotic drinks, dairy-based beverages, and plant-based beverages, among others.
Increasing consumer awareness about health and wellness, growing concern over the rising incidence of chronic diseases such as diabetes, cardiovascular disorders, and obesity, and a shift in consumer preference from conventional food and beverage products toward products that offer specific health benefits are driving demand for functional food and beverages globally. According to the International Diabetes Federation, approximately 537 million adults aged 20 to 79 years had diabetes in 2021. This number is expected to reach 783 million by 2045, of which 541 million will be at increased risk of developing type 2 diabetes. These rising disease burden statistics are increasing consumer interest in nutrition-rich and health-supporting food and beverage products.
The COVID-19 pandemic significantly accelerated awareness of health and wellness among consumers, normalizing preventive health practices and increasing demand for immunity-supporting, gut-health-targeting, and general wellness-oriented food and beverage products. Growing investment by major food and beverage companies in health-positioned product portfolios, expanding retail and e-commerce distribution infrastructure, and continuous product innovation combining science-backed functional ingredients with improving taste and convenience profiles are further supporting the growth of the functional food and beverages market.
Growing Adoption of Probiotic and Prebiotic Products Across Multiple Food and Beverage Categories
One of the significant trends driving the functional food and beverages market is the increasing adoption of probiotic and prebiotic ingredients across a wide range of food and beverage categories beyond traditional yogurt and fermented dairy formats. Probiotic and prebiotic products are now being launched across categories including carbonated beverages, snack bars, cereals, confectionery, and plant-based beverages. Growing consumer awareness of the role of the gut microbiome in immune function, digestive health, and overall well-being is increasing demand for gut-health-targeted functional food and beverage products.
Major food and beverage companies are actively expanding their presence in the probiotic and prebiotic product space through new product launches and acquisitions. For instance, in 2025, The Coca-Cola Company entered the prebiotic beverage segment with the launch of Simply Pop, a fruit-based sparkling beverage containing prebiotic fiber. Similarly, PepsiCo, Inc. acquired Poppi, a prebiotic soda brand, for approximately USD 1.95 billion in 2025. These developments reflect the growing commercial significance of gut-health-positioned functional beverages and the competitive priority that leading market participants are placing on this segment.
Rising Demand for Plant-Based Functional Beverages and Clean-Label Products
The growing interest of consumers in plant-based food and beverage products, combined with increasing preference for clean-label formulations with simple, recognizable ingredients, is creating demand for plant-based functional beverages. Consumers are increasingly seeking functional beverages made from plant-based ingredients that are free from artificial additives, preservatives, and high-fructose corn syrup while delivering specific health benefits such as energy support, immune enhancement, or digestive health. This trend is supporting innovation in categories including fortified plant milks, herbal and botanical RTD beverages, and plant-based protein drinks.
|
Report Coverage |
Details |
|
Market Size by 2036 |
USD 725.25 Billion |
|
Market Size in 2025 |
USD 332.56 Billion |
|
Market Size in 2026 |
USD 358.50 Billion |
|
Market Growth Rate (2026–2036) |
CAGR of 7.3% |
|
Dominating Region |
North America |
|
Fastest Growing Region |
Asia-Pacific |
|
Base Year |
2025 |
|
Forecast Period |
2026 to 2036 |
|
Segments Covered |
By Type: Functional Food, Functional Beverages |
|
Regions Covered |
North America, Europe, Asia-Pacific, Latin America, and Middle East & Africa |
Increasing Demand for Healthy & Nutrition-rich Diets to Drive the Growth of the Functional Food and Beverages Market
Consumers are becoming increasingly concerned about their health and paying more attention to their lifestyles and dietary habits. The global demand for healthy and nutrition-rich diets is rising with the growing world population. According to the Food and Agriculture Organization of the United Nations (FAO), global food demand is projected to increase by approximately 70% by 2050 to feed a population expected to reach 9.1 billion, with nutrient-rich foods anticipated to account for a significantly larger share of consumption.
In recent years, consumer awareness regarding health, nutrition-rich diets, calorie reduction, and food safety has grown globally, which is expected to transform the food and beverage sector and boost the growth of the functional food and beverages market. Furthermore, the incidence of type 2 diabetes has increased significantly in recent years and is expected to increase in the coming years. According to the International Diabetes Federation, approximately 589 million adults aged 20 to 79 years across the globe were living with diabetes in 2024. This number is projected to rise to 783 million by 2045, with hundreds of millions more at increased risk of developing type 2 diabetes. Thus, the increasing cases of diabetes and increased consumer interest in nutrition and health are expected to boost the demand for healthy and nutrition-rich diets, subsequently driving the demand for functional food and beverages.
Moreover, the growing health-conscious population has boosted the demand for nutritional bars and beverages, increasing the sales of functional food and beverages. Consumers are increasingly spending on value-added food categories to maintain healthier lifestyles, boosting the sales of functional food and beverages. Increasing awareness among consumers about strengthening their immunity to prevent risks of infections has led them to maintain healthy lifestyles and adopt proper dietary habits. These factors are expected to drive the growth of this market across the globe.
Rising Demand for Sports and Performance Drinks to Drive the Market
The increasing participation in sports and fitness activities and growing interest in active and healthy lifestyles, particularly among younger demographics including millennials and Gen Z, is driving demand for sports and performance drinks globally. Consumers are increasingly seeking beverages that support physical performance, recovery, and hydration. This is supporting demand for electrolyte drinks, protein-enriched beverages, and energy drinks with functional ingredients such as B-vitamins and amino acids.
The expansion of sports and performance beverages beyond professional athletes to a broader consumer base of fitness enthusiasts and health-conscious individuals is widening the addressable market for functional beverage manufacturers. The growing availability of sports and performance drinks through mainstream retail and e-commerce channels is further contributing to demand growth in this segment.
Increased Investment and Expansion in the Functional Food and Beverages Industry
Increased investment and expansions by leading players in the functional food and beverages industry are expected to offer significant opportunities for the players operating in this market. Major food and beverage companies are expanding their functional product portfolios through acquisitions, partnerships, and new product launches. For instance, in March 2025, PepsiCo, Inc. announced the acquisition of Poppi, a prebiotic soda brand, for approximately USD 1.95 billion, reflecting the growing strategic importance of functional beverage categories for large-cap food and beverage companies. Additionally, Mars, Incorporated completed its acquisition of Kellanova in December 2025 for around USD 35.9 billion, creating a broader portfolio that includes several snack and food brands with nutrition-oriented positioning.
The rapid growth of the retail sector, particularly e-commerce, is providing new channels for functional food and beverage manufacturers to reach health-conscious consumers. Online retail platforms are enabling brands to access a wider consumer base and provide personalized product offerings, expanding the commercial opportunity for players in this market. As the global functional food and beverages market is projected to reach USD 725.25 billion by 2036, growing at a CAGR of 7.3% from 2026 to 2036, continued investment and channel expansion are expected to further strengthen growth opportunities across the value chain.
Why Does the Functional Food Segment Dominate the Functional Food and Beverages Market?
Based on type, in 2026, the functional food segment is expected to account for the largest share of the functional food and beverages market. The large market share of this segment is attributed to the growing demand for nutritional and fortifying food products and rising awareness about the health benefits of consuming these products. Consumers are drawn to foods with functional ingredients that help lower the risk of specific health concerns such as obesity, weight loss, diabetes, and cardiovascular diseases, which contributes to the growth of this segment.
However, the functional beverages segment is expected to witness the fastest growth during the forecast period. The faster growth of this segment is driven by increasing consumer preference for convenient, on-the-go health and wellness solutions, growing demand for energy drinks and sports beverages, the rising popularity of probiotic and prebiotic drinks, and the entry of major beverage companies into functional beverage categories through new product launches and acquisitions.
Why Does the Health & Wellness Segment Dominate the Functional Food and Beverages Market?
Based on application, in 2026, the health & wellness segment is expected to account for the largest share of the functional food and beverages market. The large market share of this segment is attributed to the increasing health consciousness among consumers and the growing demand for clean-label and non-GMO food products. Consumers are increasingly seeking food and beverage products that support their overall health and wellness goals, driving demand across fortified and enriched product categories targeting energy, vitality, and general nutritional completeness.
The digestive health segment is expected to witness the fastest CAGR during the forecast period. The fast growth of this segment is driven by growing consumer awareness of the connection between gut health and overall well-being, increasing demand for probiotic and prebiotic products, and the proliferation of new product launches targeting gut health across food and beverage categories. Research supporting the role of the gut microbiome in immune function, mental health, and metabolic health is increasing consumer interest in digestive-health-positioned functional food and beverage products.
Why Do Supermarkets & Hypermarkets Lead the Functional Food and Beverages Market?
Based on distribution channel, in 2026, the supermarkets & hypermarkets segment is expected to account for the largest share of the functional food and beverages market. The large market share of this segment is attributed to the wide product selection available in these retail formats, the high consumer footfall in supermarkets and hypermarkets, and the competitive pricing offered through these channels. Supermarkets and hypermarkets provide functional food and beverage manufacturers with broad consumer reach and high product visibility, supporting strong sales volumes across this distribution channel.
However, the e-commerce segment is projected to register the fastest growth during the forecast period of 2026 to 2036. The rapid growth of this segment is driven by the growing preference for personalization, the convenience offered by e-commerce, the availability of greater discounts compared to offline stores, and a greater product selection experience. The increasing adoption of online shopping across all demographic groups and the ability of direct-to-consumer brands to reach health-conscious consumers through digital channels and influencer marketing are further supporting the growth of e-commerce as a distribution channel for functional food and beverages.
U.S. Functional Food and Beverages Market Size and Growth 2026 to 2036
The U.S. functional food and beverages market is projected to grow at a significant CAGR from 2026 to 2036, supported by high consumer awareness of health and wellness, a well-established functional food and beverage retail infrastructure, and continued product innovation by both established manufacturers and emerging brands.
How is North America Maintaining Dominance in the Functional Food and Beverages Market?
Based on geography, in 2026, North America is expected to account for the largest share of the functional food and beverages market. The major market share of this region is attributed to the well-established food and beverage industry, high awareness of the health benefits of functional food and beverages, growing popularity of protein bars, prebiotic drinks, and functional snacks among millennials as healthy options, and high demand for nutritional products across the region. The U.S. leads the North American market, driven by strong consumer spending on health and wellness products, wide availability of functional food and beverage products through supermarkets, specialty health stores, and e-commerce platforms, and a regulatory framework that enables manufacturers to communicate specific health and structure/function benefit claims to consumers.
Which Factors Support the Growth of the Asia-Pacific Functional Food and Beverages Market?
The functional food and beverages market in Asia-Pacific is expected to grow at the fastest CAGR during the forecast period. The growth of this market is driven by the rising awareness about the health benefits of functional food and beverages, increasing disposable incomes, rapid urbanization, the rising incidence rate of diabetes and obesity, the increasing adoption of low-carb and clean-label trends, the growing demand for sugar-free products, and the rising health and wellness trends in the region.
China, Japan, and India are the major markets in Asia-Pacific for functional food and beverages. Japan has a long-established functional food culture supported by a regulatory framework including Foods for Specified Health Uses (FOSHU) and Foods with Function Claims (FFC), which have enabled the commercialization of a wide range of functional food and beverage products. China's growing middle class and increasing health consciousness are driving strong demand growth for functional food and beverage products. India's market is supported by a strong traditional food culture, growing urban health awareness, and expanding modern retail and e-commerce channels.
The large and growing population of the Asia-Pacific region, particularly in China and India, provides significant market potential. Economic development across Southeast Asian countries including Indonesia, Vietnam, Thailand, and the Philippines is further expanding the addressable market for functional food and beverage products beyond the higher-income markets of Japan, South Korea, and Australia. The rapid growth of e-commerce across the region is further supporting market accessibility and growth.
The report includes a competitive landscape based on an extensive assessment of the key growth strategies adopted by leading market participants in the functional food and beverages market between 2023 and 2026. The key players profiled in this functional food and beverages market study are The Coca-Cola Company (U.S.), Danone S.A. (France), Glanbia plc (Ireland), Mars, Incorporated (U.S.), Meiji Holdings Co., Ltd. (Japan), Nestlé S.A. (Switzerland), Royal FrieslandCampina N.V. (Netherlands), The Kraft Heinz Company (U.S.), Arla Foods amba (Denmark), PepsiCo, Inc. (U.S.), Keurig Dr Pepper Inc. (U.S.), General Mills, Inc. (U.S.), Abbott Laboratories (U.S.), Yakult Honsha Co., Ltd. (Japan), Red Bull GmbH (Austria), and Monster Beverage Corporation (U.S.) among others.
Functional Food and Beverages Market, by Type
Functional Foods
Functional Beverages
Functional Food and Beverages Market, by Application
Functional Food and Beverages Market, by Distribution Channel
Functional Food and Beverages Market, by Geography
This report covers the market sizes and forecasts of the functional food and beverages market based on type, application, distribution channel, and geography. This report also provides the value analysis of various segments and subsegments of the functional food and beverages market at the regional and country levels.
The functional food and beverages market is projected to reach USD 725.25 billion by 2036, growing at a CAGR of 7.3% during the forecast period from 2026 to 2036.
Based on type, in 2026, the functional food segment is expected to account for the largest share of the functional food and beverages market. However, the functional beverages segment is expected to witness the fastest growth during the forecast period.
Based on distribution channel, in 2026, the supermarkets & hypermarkets segment is expected to account for the largest share of the functional food and beverages market. However, the e-commerce segment is projected to register the fastest growth rate during the forecast period. The growth of this segment is driven by the growing preference for personalization, the greater product selection experience and convenience offered by e-commerce, and the availability of greater discounts compared to offline stores.
The growth of this market is driven by the increasing demand for healthy and nutrition-rich diets, rising demand for sports and performance drinks, growing innovation and new product developments, and changes in lifestyles and rising incidences of chronic diseases. Furthermore, the increased investment and expansions in the functional food and beverages industry and rapid growth in the retail sector are expected to provide significant growth opportunities for players operating in this market.
The key players operating in the functional food and beverages market are The Coca-Cola Company (U.S.), Danone S.A. (France), Glanbia plc (Ireland), Mars, Incorporated (U.S.), Meiji Holdings Co., Ltd. (Japan), Nestlé S.A. (Switzerland), Royal FrieslandCampina N.V. (Netherlands), The Kraft Heinz Company (U.S.), Arla Foods amba (Denmark), PepsiCo, Inc. (U.S.), Keurig Dr Pepper Inc. (U.S.), General Mills, Inc. (U.S.), Abbott Laboratories (U.S.), Yakult Honsha Co., Ltd. (Japan), Red Bull GmbH (Austria), and Monster Beverage Corporation (U.S.) among others.
Countries from Asia-Pacific and Latin America are projected to offer significant growth opportunities for vendors in this market due to factors such as the growing population, the region’s growing food and beverage processing sector, increasing demand for fortified food, and growing focus on wellness trends.


Published Date: Jan-2025
Published Date: Jan-2025
Published Date: Nov-2022
Please enter your corporate email id here to view sample report.
Subscribe to get the latest industry updates