Resources
About Us
This market report examines the fast-changing waste heat recovery sector, assessing the impact of energy efficiency innovations and industrial decarbonization efforts on the capture and utilization of waste heat across diverse applications and geographic regions. It offers a strategic overview of market dynamics, growth forecasts through 2035, and competitive landscapes at both global and regional/country levels.
Key Market Drivers & Trends and Insights
Click here to: Get Free Sample Pages of this Report
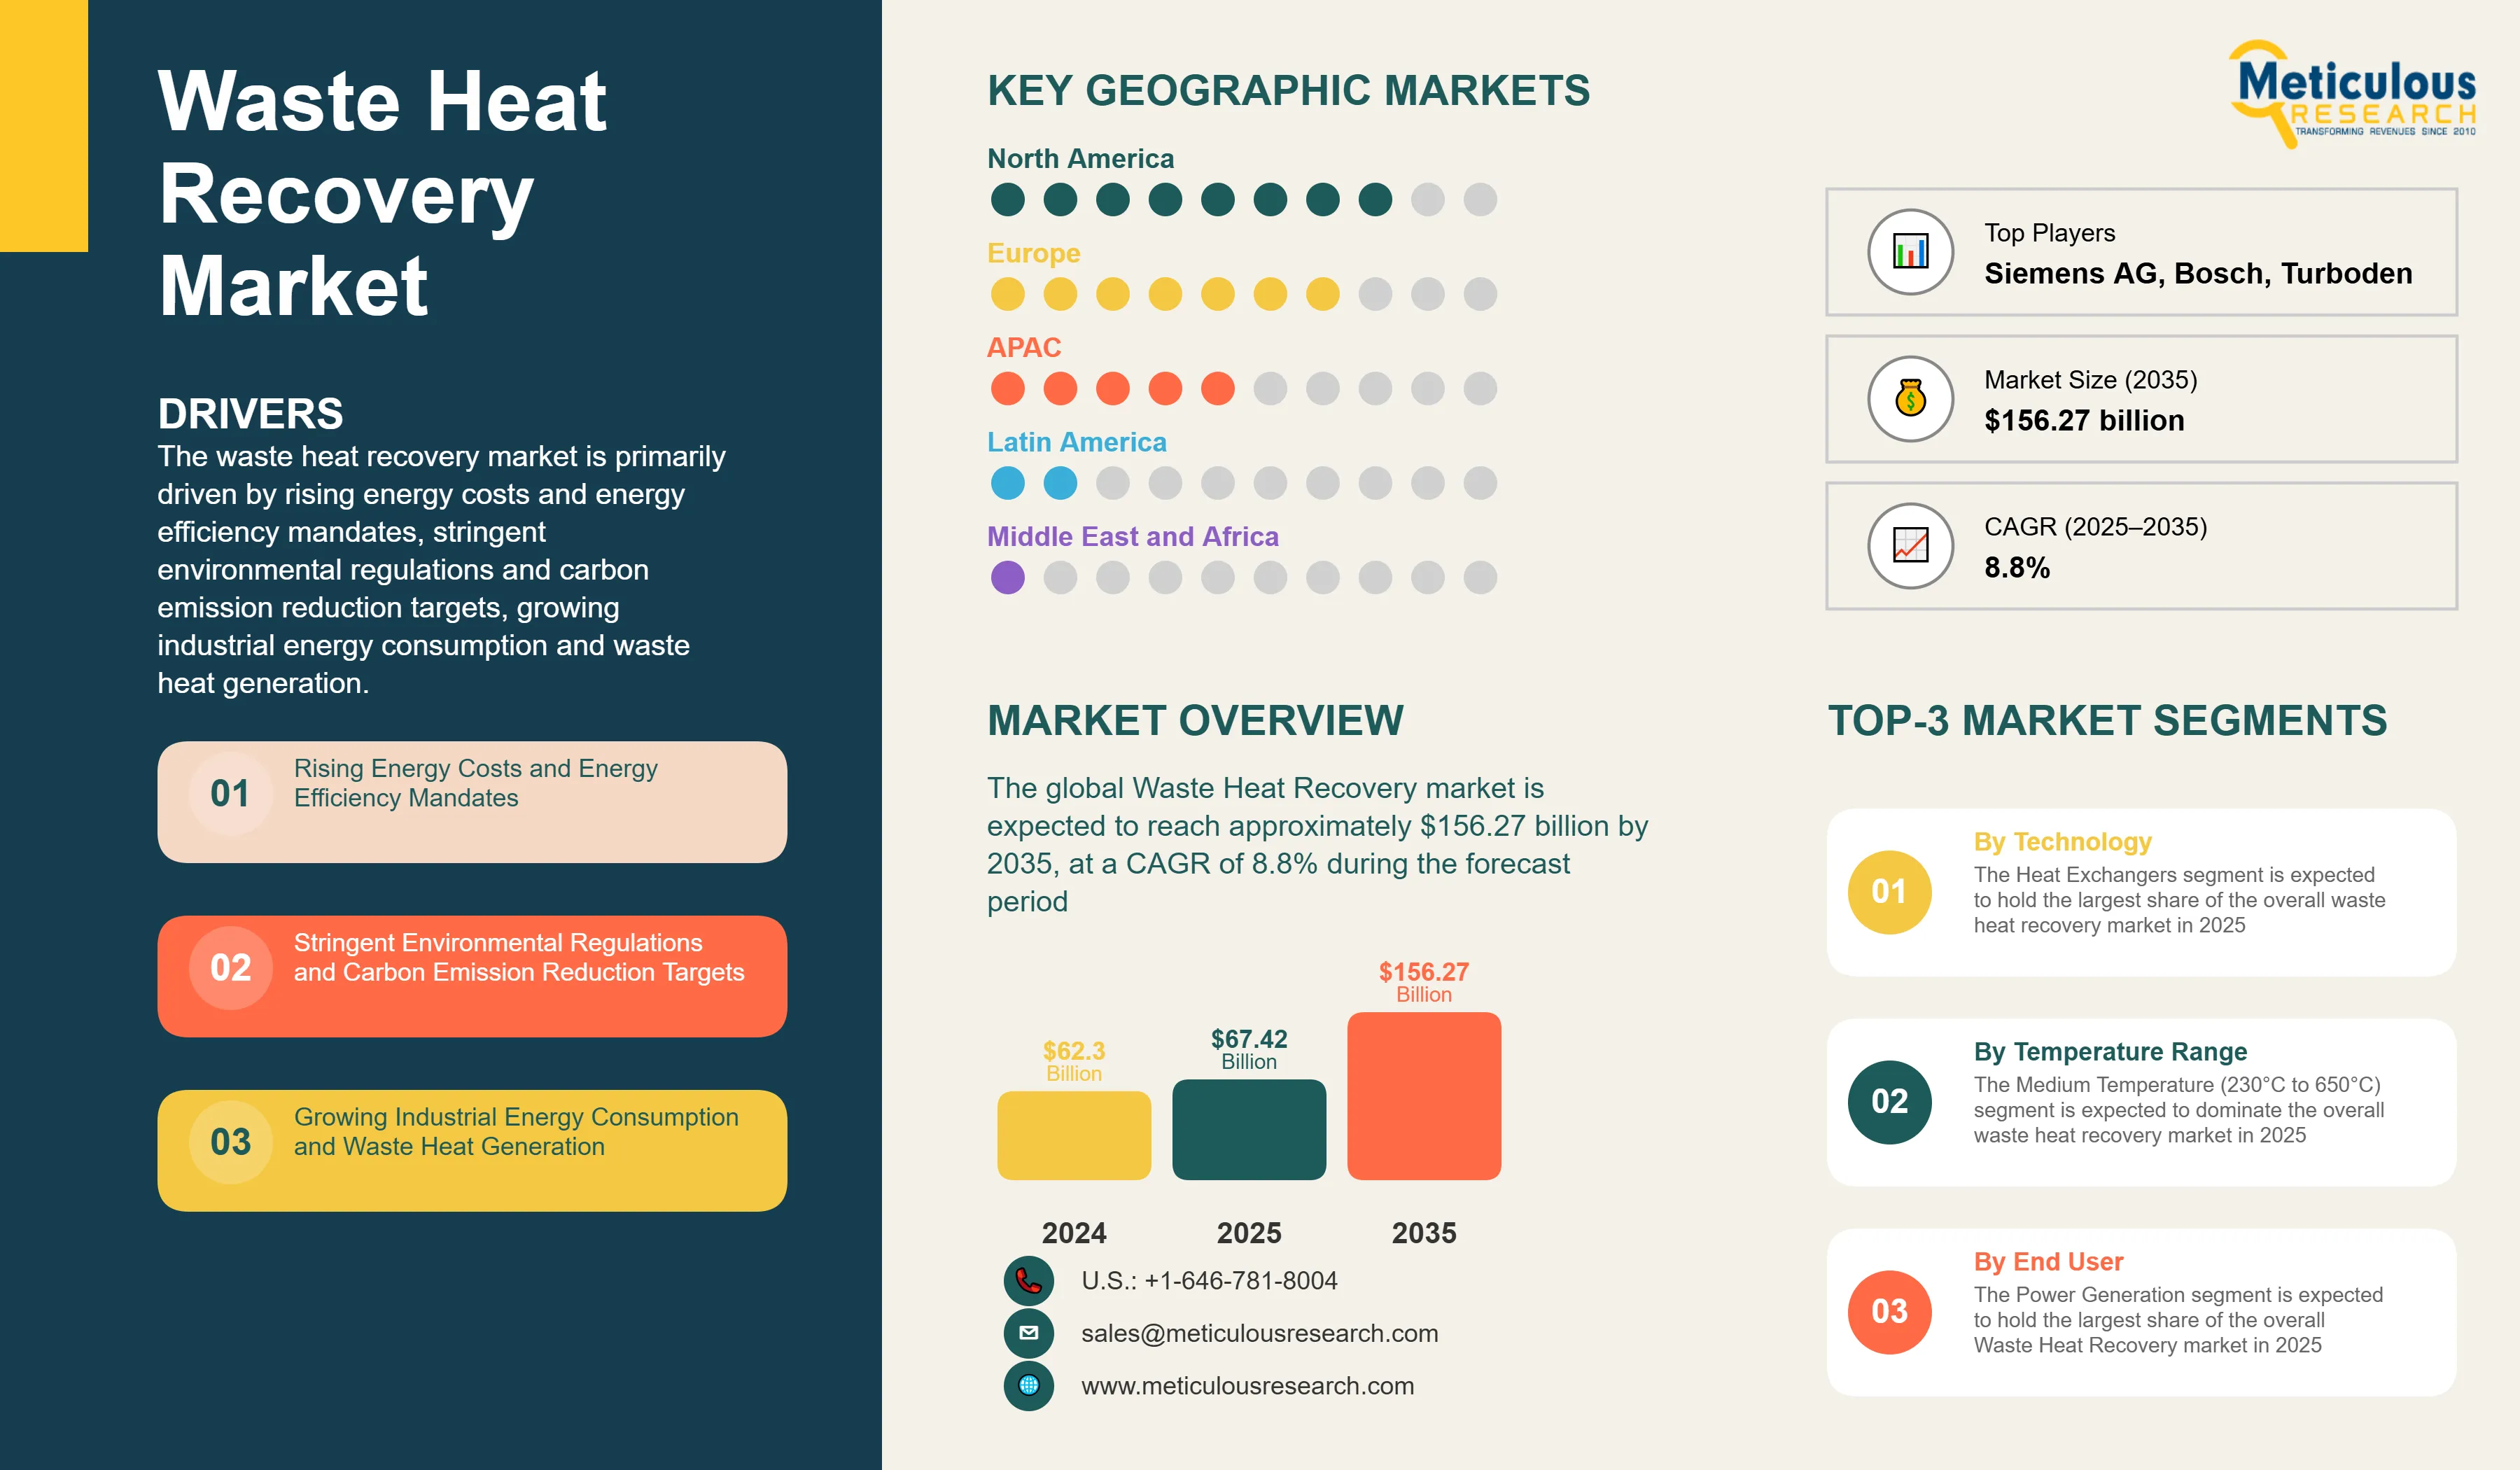
The waste heat recovery market is primarily driven by rising energy costs and energy efficiency mandates, stringent environmental regulations and carbon emission reduction targets, growing industrial energy consumption and waste heat generation, government incentives for energy recovery technologies, and technological advancements in heat recovery systems. The increasing adoption of Organic Rankine Cycle (ORC) systems is accelerating innovation, while the integration of AI and machine learning for system optimization is creating new operational efficiencies. Additionally, the development of modular and scalable heat recovery solutions, focus on industrial digitalization and energy management, and integration with renewable energy systems are further driving market growth, especially in North America and Europe regions.
Key Challenges
Despite its substantial growth potential, the Waste Heat Recovery market faces several challenges, including high upfront capital and installation costs, technical complexities related to system integration, ongoing maintenance demands, and concerns over system reliability. Limited awareness and a shortage of technical expertise further hinder market expansion. The complexity of integrating systems and retrofitting existing infrastructure—especially given the variability and quality of heat sources—pose significant obstacles to broader adoption. Addressing the shortage of skilled labor and enhancing technical support are critical. Moreover, maintaining cost competitiveness against traditional energy systems and ensuring access to specialized heat recovery equipment remain key barriers that could slow market penetration across various regions worldwide.
Growth Opportunities
The waste heat recovery market presents numerous high-growth opportunities. Integrating waste heat recovery with renewable energy systems offers a promising path to develop sustainable energy solutions. Advances in thermoelectric technologies have the potential to address efficiency challenges in heat recovery processes. Additionally, smart heat recovery systems equipped with IoT capabilities enable improved monitoring and optimization. Growth in emerging markets and expanding industrial sectors enhances accessibility and helps lower operational costs. Furthermore, the rise of energy-as-a-service models and specialized applications in industrial decarbonization unlocks new market potential, as organizations increasingly pursue innovative approaches to achieve their energy efficiency and sustainability goals.
Market Segmentation Highlights
By Technology
The Heat Exchangers segment is expected to hold the largest share of the overall waste heat recovery market in 2025, due to their proven reliability, cost-effectiveness, and widespread industrial acceptance across multiple applications. Organic Rankine Cycle (ORC) systems represent the second-largest segment as they offer high efficiency in converting low-grade waste heat to electricity and established commercial viability. However, Thermoelectric Generators are projected to grow at the fastest CAGR through 2035 as this technology offers maintenance-free operation and scalable deployment, making them increasingly attractive for distributed heat recovery applications.
By Temperature Range
The Medium Temperature (230°C to 650°C) segment is expected to dominate the overall waste heat recovery market in 2025, driven by its optimal balance between heat quality and recovery efficiency across diverse industrial processes. However, Low Temperature (Below 230°C) is expected to grow at the fastest CAGR during the forecast period as this segment offers the largest untapped potential with minimal retrofitting requirements and reduced operational complexity.
By End User
The Power Generation segment is expected to hold the largest share of the overall Waste Heat Recovery market in 2025, driven by combined heat and power applications and utility sector commitments to operational efficiency. However, the Chemical & Petrochemical Industry is projected to grow at the highest CAGR during the forecast period as chemical manufacturers increasingly integrate waste heat recovery for process optimization and energy security. The Cement Industry also shows strong growth potential as the sector seeks heat recovery solutions to offset energy-intensive production processes.
By Geography
North America is expected to hold the largest share of the global Waste Heat Recovery market in 2025, followed by Europe. Supportive policy frameworks, including energy efficiency mandates, substantial government incentives for industrial energy recovery, and strong industrial commitment to sustainability targets, drive this leadership position. The U.S. represents the largest market in North America, while Germany leads in Europe due to advanced manufacturing infrastructure and a favourable regulatory environment for energy efficiency. However, the Asia-Pacific region, particularly China, India, and Japan, is projected to witness the highest CAGR during the forecast period 2025-2035, driven by rapid industrial expansion, increasing energy costs, and significant investments in energy efficiency infrastructure. The Middle East region shows promising growth potential as countries like the UAE and Saudi Arabia leverage their industrial capabilities to develop large-scale waste heat recovery projects.
Competitive Landscape
The global waste heat recovery market is characterized by a diverse competitive landscape, where established engineering firms compete alongside specialized energy efficiency companies and industrial technology providers.
The broader ecosystem of solution providers can be divided into technology innovators, who focus on pioneering advanced heat recovery solutions, and industrial integrators, who develop scalable commercial systems. Each group employs unique strategies to sustain their competitive edge. Leading companies are concentrating on delivering integrated solutions that combine multiple heat recovery technologies with digital monitoring capabilities, while also creating specialized applications and adapting to evolving energy efficiency regulations.
The key players operating in the global Waste Heat Recovery market are General Electric Company, Siemens AG, Mitsubishi Heavy Industries, Ltd., Kawasaki Heavy Industries, Ltd., Babcock & Wilcox Enterprises, Inc., Bosch Thermotechnology GmbH, Ormat Technologies, Inc., Turboden S.r.l. (Mitsubishi Heavy Industries Group), Exergy International S.r.l., Climeon AB, ElectraTherm, Inc., Enertime SAS, Rank ORC, S.L, Kaishan USA, Inc., and CNBM International Corporation, among others.
|
Particulars |
Details |
|
Number of Pages |
210 |
|
Format |
PDF & Excel |
|
Forecast Period |
2025–2035 |
|
Base Year |
2024 |
|
CAGR (Value) |
8.8% |
|
Market Size (Value)in 2025 |
$67.42 billion |
|
Market Size (Value) in 2035 |
$156.27 billion |
|
Segments Covered |
By Technology
By Temperature Range
By End User
|
|
Countries Covered |
North America: United States (U.S.), Canada |
|
Key Companies |
Technology Leaders: General Electric Company, Siemens AG, Mitsubishi Heavy Industries, Ltd., Kawasaki Heavy Industries, Ltd., Babcock & Wilcox Enterprises, Inc. Specialized Solutions: Bosch Thermotechnology GmbH, Ormat Technologies, Inc., Turboden S.r.l., Exergy International S.r.l., Climeon AB Emerging Technology Players: ElectraTherm, Inc., Enertime SAS, Rank ORC, S.L, Kaishan USA, Inc., CNBM International Corporation |
The global Waste Heat Recovery market was valued at $62.3 billion in 2024 and is expected to reach approximately $156.27 billion by 2035, growing from an estimated $67.42 billion in 2025, at a CAGR of 8.8% during the forecast period of 2025–2035.
The global Waste Heat Recovery market is expected to grow at a CAGR of 8.8% during the forecast period of 2025–2035.
The global Waste Heat Recovery market is expected to reach approximately $156.27 billion by 2035, growing from an estimated $67.42 billion in 2025, at a CAGR of 8.8% during the forecast period of 2025–2035.
The key companies operating in this market include General Electric Company, Siemens AG, Mitsubishi Heavy Industries, Ltd., Kawasaki Heavy Industries, Ltd., Babcock & Wilcox Enterprises, Inc., Bosch Thermotechnology GmbH, Ormat Technologies, Inc., Turboden S.r.l. (Mitsubishi Heavy Industries Group), Exergy International S.r.l., Climeon AB, ElectraTherm, Inc., Enertime SAS, Rank ORC, S.L, Kaishan USA, Inc., and CNBM International Corporation, among others.
Major trends shaping the market include adoption of Organic Rankine Cycle (ORC) systems, integration of AI and machine learning for system optimization, development of modular and scalable heat recovery solutions, and focus on industrial digitalization and energy management.
• In 2025, the Heat Exchangers segment is expected to dominate the overall Waste Heat Recovery market by technology type.
• Based on temperature range, Medium Temperature (230°C to 650°C) is expected to hold the largest share of the overall Waste Heat Recovery market in 2025.
• Based on end user, the Power Generation segment is expected to hold the largest share of the global Waste Heat Recovery market in 2025.
• Steel & Metal Processing is expected to be the second-largest end-user segment in 2025.
• Thermoelectric Generators are projected to grow at the highest CAGR in the technology segment through 2035.
• Low Temperature (Below 230°C) is expected to grow at the highest CAGR during the forecast period among temperature ranges.
• Chemical & Petrochemical Industry applications are projected to grow at the highest CAGR during the forecast period.
North America is expected to hold the largest share of the global Waste Heat Recovery market in 2025, followed by Europe. This is driven by supportive policy frameworks including energy efficiency mandates, substantial government incentives for industrial energy recovery, and strong industrial commitment to sustainability targets. However, the Asia-Pacific region is projected to grow at the highest CAGR of 9.7% during the forecast period.
The growth of this market is driven by rising energy costs and energy efficiency mandates, stringent environmental regulations and carbon emission reduction targets, growing industrial energy consumption and waste heat generation, government incentives for energy recovery technologies, and technological advancements in heat recovery systems
1. Market Definition & Scope
1.1. Market Definition
1.2. Market Ecosystem
1.3. Currency & Pricing
1.4. Key Stakeholders
2. Research Methodology
2.1. Research Approach
2.2. Process of Data Collection and Validation
2.2.1. Secondary Research
2.2.2. Primary Research / Interviews with Key Opinion Leaders
2.3. Market Sizing and Forecast
2.3.1. Market Size Estimation Approach
2.3.2. Bottom-up Approach
2.3.3. Top-down Approach
2.3.4. Growth Forecast Approach
2.3.5. Assumptions for the Study
3. Executive Summary
3.1. Market Overview
3.2. Segmental Analysis
3.2.1. Waste Heat Recovery Market, by Technology
3.2.2. Waste Heat Recovery Market, by Temperature Range
3.2.3. Waste Heat Recovery Market, by End User
3.2.4. Waste Heat Recovery Market, by Geography
3.3. Competitive Landscape
4. Market Insights
4.1. Market Overview
4.2. Factors Affecting Market Growth
4.2.1. Drivers
4.2.1.1. Rising Energy Costs and Energy Efficiency Mandates
4.2.1.2. Stringent Environmental Regulations and Carbon Emission Reduction Targets
4.2.1.3. Growing Industrial Energy Consumption and Waste Heat Generation
4.2.1.4. Government Incentives for Energy Recovery Technologies
4.2.1.5. Technological Advancements in Heat Recovery Systems
4.2.2. Restraints
4.2.2.1. High Initial Capital Investment and Installation Costs
4.2.2.2. Technical Complexity and Integration Challenges
4.2.2.3. Maintenance Requirements and System Reliability Concerns
4.2.2.4. Limited Awareness and Technical Expertise
4.2.3. Opportunities
4.2.3.1. Integration with Renewable Energy Systems
4.2.3.2. Development of Advanced Thermoelectric Technologies
4.2.3.3. Smart Heat Recovery Systems with IoT Integration
4.2.3.4. Expansion in Emerging Markets and Industrial Sectors
4.2.4. Trends
4.2.4.1. Adoption of Organic Rankine Cycle (ORC) Systems
4.2.4.2. Integration of AI and Machine Learning for System Optimization
4.2.4.3. Development of Modular and Scalable Heat Recovery Solutions
4.2.4.4. Focus on Industrial Digitalization and Energy Management
4.2.5. Challenges
4.2.5.1. System Integration Complexity and Retrofitting Constraints
4.2.5.2. Heat Source Variability and Quality Issues
4.2.5.3. Skilled Workforce and Technical Support Limitations
4.3. Porter's Five Forces Analysis
4.3.1. Bargaining Power of Suppliers
4.3.2. Bargaining Power of Buyers
4.3.3. Threat of Substitutes
4.3.4. Threat of New Entrants
4.3.5. Degree of Competition
4.4. Impact of Energy Efficiency on the Waste Heat Recovery Market
4.4.1. Industrial Energy Efficiency Targets
4.4.2. Sustainable Manufacturing Practices
4.4.3. Life Cycle Assessment of Heat Recovery Systems
4.4.4. Circular Economy and Resource Optimization
4.5. ESG and Regulatory Compliance Landscape
4.6. Technology Roadmap and Innovation Trends
4.7. Customer Insights and Buyer Personas
4.8. Value Chain and Ecosystem Analysis
4.9. Scenario Analysis and Market Disruptions
4.10. Case Studies of Waste Heat Recovery System Deployment
4.11. Digitalization and Data Analytics in Waste Heat Recovery
4.12. Policy Landscape and Global Regulatory Benchmarking
4.13. Investment Trends and Funding Landscape
4.14. Supply Chain Resilience and Critical Materials
4.15. Startups, Scale-Ups, and Innovation Ecosystem
4.16. Social and Workforce Impacts
5. Waste Heat Recovery Market Assessment—by Technology
5.1. Heat Exchangers
5.2. Organic Rankine Cycle (ORC)
5.3. Thermoelectric Generators
5.4. Steam Rankine Cycle
5.5. Kalina Cycle
5.6. Heat Pumps
5.7. Other Technologies
6. Waste Heat Recovery Market Assessment—by Temperature Range
6.1. Low Temperature (Below 230°C)
6.2. Medium Temperature (230°C to 650°C)
6.3. High Temperature (Above 650°C)
7. Waste Heat Recovery Market Assessment—by End User
7.1. Power Generation
7.1.1. Coal-fired Power Plants
7.1.2. Natural Gas Power Plants
7.1.3. Combined Heat and Power (CHP)
7.1.4. Renewable Energy Integration
7.2. Oil & Gas Industry
7.3. Chemical & Petrochemical Industry
7.4. Steel & Metal Processing
7.5. Cement Industry
7.6. Pulp & Paper Industry
7.7. Food & Beverage Industry
7.8. Marine Industry
7.9. Other End Users
8. Waste Heat Recovery Market Assessment—by Geography
8.1. Overview
8.2. North America
8.2.1. U.S.
8.2.2. Canada
8.3. Europe
8.3.1. Germany
8.3.2. United Kingdom
8.3.3. France
8.3.4. Italy
8.3.5. Netherlands
8.3.6. Russia
8.3.7. Rest of Europe (RoE)
8.4. Asia-Pacific
8.4.1. China
8.4.2. Japan
8.4.3. India
8.4.4. South Korea
8.4.5. Australia
8.4.6. Southeast Asia
8.4.7. Rest of Asia-Pacific (RoAPAC)
8.5. Latin America
8.5.1. Brazil
8.5.2. Mexico
8.5.3. Argentina
8.5.4. Rest of Latin America (RoLATAM)
8.6. Middle East & Africa
8.6.1. United Arab Emirates (UAE)
8.6.2. Saudi Arabia
8.6.3. South Africa
8.6.4. Nigeria
8.6.5. Rest of Middle East & Africa (RoMEA)
8.7. Cross-Regional Collaboration and Trade Flows
9. Competitive Landscape
9.1. Overview
9.2. Key Growth Strategies
9.3. Competitive Benchmarking
9.4. Competitive Dashboard
9.4.1. Industry Leaders
9.4.2. Market Differentiators
9.4.3. Vanguards
9.4.4. Emerging Players
9.5. Market Share/Ranking Analysis, by Key Players, 2024
9.6. Innovation Scorecard and Patent Analysis
10. Company Profiles
Business Overview, Financial Overview, Product Portfolio, Strategic Developments, and SWOT Analysis
10.1. General Electric Company
10.2. Siemens AG
10.3. Mitsubishi Heavy Industries, Ltd.
10.4. Kawasaki Heavy Industries, Ltd.
10.5. Babcock & Wilcox Enterprises, Inc.
10.6. Bosch Thermotechnology GmbH
10.7. Ormat Technologies, Inc.
10.8. Turboden S.r.l. (Mitsubishi Heavy Industries Group)
10.9. Exergy International S.r.l.
10.10. Climeon AB
10.11. ElectraTherm, Inc.
10.12. Enertime SAS
10.13. Rank ORC, S.L
10.14. Kaishan USA, Inc.
10.15. CNBM International Corporation
10.16. Notable Startups and Disruptive Entrants
11. Appendix
11.1. Available Customizations
11.2. Related Reports
List of Tables
Global Market Overview
Table 1: Global Waste Heat Recovery Market, 2023–2035 (USD Million)
Table 2: Global Waste Heat Recovery Market, by Technology, 2023–2035 (USD Million)
Table 3: Global Waste Heat Recovery Market, by Temperature Range, 2023–2035 (USD Million)
Table 4: Global Waste Heat Recovery Market, by End User, 2023–2035 (USD Million)
Table 5: Global Waste Heat Recovery Market, by Region/Country, 2023–2035 (USD Million)
Technology Segment
Table 6: Global Heat Exchangers Market, by Region/Country, 2023–2035 (USD Million)
Table 7: Global Organic Rankine Cycle (ORC) Market, by Region/Country, 2023–2035 (USD Million)
Table 8: Global Thermoelectric Generators Market, by Region/Country, 2023–2035 (USD Million)
Table 9: Global Steam Rankine Cycle Market, by Region/Country, 2023–2035 (USD Million)
Table 10: Global Kalina Cycle Market, by Region/Country, 2023–2035 (USD Million)
Table 11: Global Heat Pumps Market, by Region/Country, 2023–2035 (USD Million)
Table 12: Global Other Technologies Market, by Region/Country, 2023–2035 (USD Million)
Temperature Range Segment
Table 13: Global Low Temperature Waste Heat Recovery Market, by Region/Country, 2023–2035 (USD Million)
Table 14: Global Medium Temperature Waste Heat Recovery Market, by Region/Country, 2023–2035 (USD Million)
Table 15: Global High Temperature Waste Heat Recovery Market, by Region/Country, 2023–2035 (USD Million)
End User Segment
Table 16: Global Waste Heat Recovery Market for Power Generation, by Region/Country, 2023–2035 (USD Million)
Table 17: Global Waste Heat Recovery Market for Power Generation, by Application, 2023–2035 (USD Million)
Table 18: Global Waste Heat Recovery Market for Coal-fired Power Plants, by Region/Country, 2023–2035 (USD Million)
Table 19: Global Waste Heat Recovery Market for Natural Gas Power Plants, by Region/Country, 2023–2035 (USD Million)
Table 20: Global Waste Heat Recovery Market for Combined Heat and Power (CHP), by Region/Country, 2023–2035 (USD Million)
Table 21: Global Waste Heat Recovery Market for Renewable Energy Integration, by Region/Country, 2023–2035 (USD Million)
Table 22: Global Waste Heat Recovery Market for Oil & Gas Industry, by Region/Country, 2023–2035 (USD Million)
Table 23: Global Waste Heat Recovery Market for Chemical & Petrochemical Industry, by Region/Country, 2023–2035 (USD Million)
Table 24: Global Waste Heat Recovery Market for Steel & Metal Processing, by Region/Country, 2023–2035 (USD Million)
Table 25: Global Waste Heat Recovery Market for Cement Industry, by Region/Country, 2023–2035 (USD Million)
Table 26: Global Waste Heat Recovery Market for Pulp & Paper Industry, by Region/Country, 2023–2035 (USD Million)
Table 27: Global Waste Heat Recovery Market for Food & Beverage Industry, by Region/Country, 2023–2035 (USD Million)
Table 28: Global Waste Heat Recovery Market for Marine Industry, by Region/Country, 2023–2035 (USD Million)
Table 29: Global Waste Heat Recovery Market for Other End Users, by Region/Country, 2023–2035 (USD Million)
North America Market
Table 30: North America Waste Heat Recovery Market, 2023–2035 (USD Million)
Table 31: North America Waste Heat Recovery Market, by Technology, 2023–2035 (USD Million)
Table 32: North America Waste Heat Recovery Market, by Temperature Range, 2023–2035 (USD Million)
Table 33: North America Waste Heat Recovery Market, by End User, 2023–2035 (USD Million)
Table 34: North America Waste Heat Recovery Market, by Country, 2023–2035 (USD Million)
U.S. Market
Table 35: U.S. Waste Heat Recovery Market, 2023–2035 (USD Million)
Table 36: U.S. Waste Heat Recovery Market, by Technology, 2023–2035 (USD Million)
Table 37: U.S. Waste Heat Recovery Market, by Temperature Range, 2023–2035 (USD Million)
Table 38: U.S. Waste Heat Recovery Market, by End User, 2023–2035 (USD Million)
Canada Market
Table 39: Canada Waste Heat Recovery Market, 2023–2035 (USD Million)
Table 40: Canada Waste Heat Recovery Market, by Technology, 2023–2035 (USD Million)
Table 41: Canada Waste Heat Recovery Market, by Temperature Range, 2023–2035 (USD Million)
Table 42: Canada Waste Heat Recovery Market, by End User, 2023–2035 (USD Million)
Europe Market
Table 43: Europe Waste Heat Recovery Market, 2023–2035 (USD Million)
Table 44: Europe Waste Heat Recovery Market, by Technology, 2023–2035 (USD Million)
Table 45: Europe Waste Heat Recovery Market, by Temperature Range, 2023–2035 (USD Million)
Table 46: Europe Waste Heat Recovery Market, by End User, 2023–2035 (USD Million)
Table 47: Europe Waste Heat Recovery Market, by Country, 2023–2035 (USD Million)
Germany Market
Table 48: Germany Waste Heat Recovery Market, 2023–2035 (USD Million)
Table 49: Germany Waste Heat Recovery Market, by Technology, 2023–2035 (USD Million)
Table 50: Germany Waste Heat Recovery Market, by Temperature Range, 2023–2035 (USD Million)
Table 51: Germany Waste Heat Recovery Market, by End User, 2023–2035 (USD Million)
United Kingdom Market
Table 52: United Kingdom Waste Heat Recovery Market, 2023–2035 (USD Million)
Table 53: United Kingdom Waste Heat Recovery Market, by Technology, 2023–2035 (USD Million)
Table 54: United Kingdom Waste Heat Recovery Market, by Temperature Range, 2023–2035 (USD Million)
Table 55: United Kingdom Waste Heat Recovery Market, by End User, 2023–2035 (USD Million)
France Market
Table 56: France Waste Heat Recovery Market, 2023–2035 (USD Million)
Table 57: France Waste Heat Recovery Market, by Technology, 2023–2035 (USD Million)
Table 58: France Waste Heat Recovery Market, by Temperature Range, 2023–2035 (USD Million)
Table 59: France Waste Heat Recovery Market, by End User, 2023–2035 (USD Million)
Italy Market
Table 60: Italy Waste Heat Recovery Market, 2023–2035 (USD Million)
Table 61: Italy Waste Heat Recovery Market, by Technology, 2023–2035 (USD Million)
Table 62: Italy Waste Heat Recovery Market, by Temperature Range, 2023–2035 (USD Million)
Table 63: Italy Waste Heat Recovery Market, by End User, 2023–2035 (USD Million)
Netherlands Market
Table 64: Netherlands Waste Heat Recovery Market, 2023–2035 (USD Million)
Table 65: Netherlands Waste Heat Recovery Market, by Technology, 2023–2035 (USD Million)
Table 66: Netherlands Waste Heat Recovery Market, by Temperature Range, 2023–2035 (USD Million)
Table 67: Netherlands Waste Heat Recovery Market, by End User, 2023–2035 (USD Million)
Russia Market
Table 68: Russia Waste Heat Recovery Market, 2023–2035 (USD Million)
Table 69: Russia Waste Heat Recovery Market, by Technology, 2023–2035 (USD Million)
Table 70: Russia Waste Heat Recovery Market, by Temperature Range, 2023–2035 (USD Million)
Table 71: Russia Waste Heat Recovery Market, by End User, 2023–2035 (USD Million)
Rest of Europe Market
Table 72: Rest of Europe Waste Heat Recovery Market, 2023–2035 (USD Million)
Table 73: Rest of Europe Waste Heat Recovery Market, by Technology, 2023–2035 (USD Million)
Table 74: Rest of Europe Waste Heat Recovery Market, by Temperature Range, 2023–2035 (USD Million)
Table 75: Rest of Europe Waste Heat Recovery Market, by End User, 2023–2035 (USD Million)
Asia-Pacific Market
Table 76: Asia-Pacific Waste Heat Recovery Market, 2023–2035 (USD Million)
Table 77: Asia-Pacific Waste Heat Recovery Market, by Technology, 2023–2035 (USD Million)
Table 78: Asia-Pacific Waste Heat Recovery Market, by Temperature Range, 2023–2035 (USD Million)
Table 79: Asia-Pacific Waste Heat Recovery Market, by End User, 2023–2035 (USD Million)
Table 80: Asia-Pacific Waste Heat Recovery Market, by Country, 2023–2035 (USD Million)
China Market
Table 81: China Waste Heat Recovery Market, 2023–2035 (USD Million)
Table 82: China Waste Heat Recovery Market, by Technology, 2023–2035 (USD Million)
Table 83: China Waste Heat Recovery Market, by Temperature Range, 2023–2035 (USD Million)
Table 84: China Waste Heat Recovery Market, by End User, 2023–2035 (USD Million)
Japan Market
Table 85: Japan Waste Heat Recovery Market, 2023–2035 (USD Million)
Table 86: Japan Waste Heat Recovery Market, by Technology, 2023–2035 (USD Million)
Table 87: Japan Waste Heat Recovery Market, by Temperature Range, 2023–2035 (USD Million)
Table 88: Japan Waste Heat Recovery Market, by End User, 2023–2035 (USD Million)
India Market
Table 89: India Waste Heat Recovery Market, 2023–2035 (USD Million)
Table 90: India Waste Heat Recovery Market, by Technology, 2023–2035 (USD Million)
Table 91: India Waste Heat Recovery Market, by Temperature Range, 2023–2035 (USD Million)
Table 92: India Waste Heat Recovery Market, by End User, 2023–2035 (USD Million)
South Korea Market
Table 93: South Korea Waste Heat Recovery Market, 2023–2035 (USD Million)
Table 94: South Korea Waste Heat Recovery Market, by Technology, 2023–2035 (USD Million)
Table 95: South Korea Waste Heat Recovery Market, by Temperature Range, 2023–2035 (USD Million)
Table 96: South Korea Waste Heat Recovery Market, by End User, 2023–2035 (USD Million)
Australia Market
Table 97: Australia Waste Heat Recovery Market, 2023–2035 (USD Million)
Table 98: Australia Waste Heat Recovery Market, by Technology, 2023–2035 (USD Million)
Table 99: Australia Waste Heat Recovery Market, by Temperature Range, 2023–2035 (USD Million)
Table 100: Australia Waste Heat Recovery Market, by End User, 2023–2035 (USD Million)
Southeast Asia Market
Table 101: Southeast Asia Waste Heat Recovery Market, 2023–2035 (USD Million)
Table 102: Southeast Asia Waste Heat Recovery Market, by Technology, 2023–2035 (USD Million)
Table 103: Southeast Asia Waste Heat Recovery Market, by Temperature Range, 2023–2035 (USD Million)
Table 104: Southeast Asia Waste Heat Recovery Market, by End User, 2023–2035 (USD Million)
Rest of Asia-Pacific Market
Table 105: Rest of Asia-Pacific Waste Heat Recovery Market, 2023–2035 (USD Million)
Table 106: Rest of Asia-Pacific Waste Heat Recovery Market, by Technology, 2023–2035 (USD Million)
Table 107: Rest of Asia-Pacific Waste Heat Recovery Market, by Temperature Range, 2023–2035 (USD Million)
Table 108: Rest of Asia-Pacific Waste Heat Recovery Market, by End User, 2023–2035 (USD Million)
Latin America Market
Table 109: Latin America Waste Heat Recovery Market, 2023–2035 (USD Million)
Table 110: Latin America Waste Heat Recovery Market, by Technology, 2023–2035 (USD Million)
Table 111: Latin America Waste Heat Recovery Market, by Temperature Range, 2023–2035 (USD Million)
Table 112: Latin America Waste Heat Recovery Market, by End User, 2023–2035 (USD Million)
Table 113: Latin America Waste Heat Recovery Market, by Country, 2023–2035 (USD Million)
Brazil Market
Table 114: Brazil Waste Heat Recovery Market, 2023–2035 (USD Million)
Table 115: Brazil Waste Heat Recovery Market, by Technology, 2023–2035 (USD Million)
Table 116: Brazil Waste Heat Recovery Market, by Temperature Range, 2023–2035 (USD Million)
Table 117: Brazil Waste Heat Recovery Market, by End User, 2023–2035 (USD Million)
Mexico Market
Table 118: Mexico Waste Heat Recovery Market, 2023–2035 (USD Million)
Table 119: Mexico Waste Heat Recovery Market, by Technology, 2023–2035 (USD Million)
Table 120: Mexico Waste Heat Recovery Market, by Temperature Range, 2023–2035 (USD Million)
Table 121: Mexico Waste Heat Recovery Market, by End User, 2023–2035 (USD Million)
Argentina Market
Table 122: Argentina Waste Heat Recovery Market, 2023–2035 (USD Million)
Table 123: Argentina Waste Heat Recovery Market, by Technology, 2023–2035 (USD Million)
Table 124: Argentina Waste Heat Recovery Market, by Temperature Range, 2023–2035 (USD Million)
Table 125: Argentina Waste Heat Recovery Market, by End User, 2023–2035 (USD Million)
Rest of Latin America Market
Table 126: Rest of Latin America Waste Heat Recovery Market, 2023–2035 (USD Million)
Table 127: Rest of Latin America Waste Heat Recovery Market, by Technology, 2023–2035 (USD Million)
Table 128: Rest of Latin America Waste Heat Recovery Market, by Temperature Range, 2023–2035 (USD Million)
Table 129: Rest of Latin America Waste Heat Recovery Market, by End User, 2023–2035 (USD Million)
Middle East & Africa Market
Table 130: Middle East & Africa Waste Heat Recovery Market, 2023–2035 (USD Million)
Table 131: Middle East & Africa Waste Heat Recovery Market, by Technology, 2023–2035 (USD Million)
Table 132: Middle East & Africa Waste Heat Recovery Market, by Temperature Range, 2023–2035 (USD Million)
Table 133: Middle East & Africa Waste Heat Recovery Market, by End User, 2023–2035 (USD Million)
Table 134: Middle East & Africa Waste Heat Recovery Market, by Country, 2023–2035 (USD Million)
United Arab Emirates (UAE) Market
Table 135: UAE Waste Heat Recovery Market, 2023–2035 (USD Million)
Table 136: UAE Waste Heat Recovery Market, by Technology, 2023–2035 (USD Million)
Table 137: UAE Waste Heat Recovery Market, by Temperature Range, 2023–2035 (USD Million)
Table 138: UAE Waste Heat Recovery Market, by End User, 2023–2035 (USD Million)
Saudi Arabia Market
Table 139: Saudi Arabia Waste Heat Recovery Market, 2023–2035 (USD Million)
Table 140: Saudi Arabia Waste Heat Recovery Market, by Technology, 2023–2035 (USD Million)
Table 141: Saudi Arabia Waste Heat Recovery Market, by Temperature Range, 2023–2035 (USD Million)
Table 142: Saudi Arabia Waste Heat Recovery Market, by End User, 2023–2035 (USD Million)
South Africa Market
Table 143: South Africa Waste Heat Recovery Market, 2023–2035 (USD Million)
Table 144: South Africa Waste Heat Recovery Market, by Technology, 2023–2035 (USD Million)
Table 145: South Africa Waste Heat Recovery Market, by Temperature Range, 2023–2035 (USD Million)
Table 146: South Africa Waste Heat Recovery Market, by End User, 2023–2035 (USD Million)
Nigeria Market
Table 147: Nigeria Waste Heat Recovery Market, 2023–2035 (USD Million)
Table 148: Nigeria Waste Heat Recovery Market, by Technology, 2023–2035 (USD Million)
Table 149: Nigeria Waste Heat Recovery Market, by Temperature Range, 2023–2035 (USD Million)
Table 150: Nigeria Waste Heat Recovery Market, by End User, 2023–2035 (USD Million)
Rest of Middle East & Africa Market
Table 151: Rest of Middle East & Africa Waste Heat Recovery Market, 2023–2035 (USD Million)
Table 152: Rest of Middle East & Africa Waste Heat Recovery Market, by Technology, 2023–2035 (USD Million)
Table 153: Rest of Middle East & Africa Waste Heat Recovery Market, by Temperature Range, 2023–2035 (USD Million)
Table 154: Rest of Middle East & Africa Waste Heat Recovery Market, by End User, 2023–2035 (USD Million)
List of Figures
Figure 1: Global Waste Heat Recovery Market Size, 2023–2035 (USD Million)
Figure 2: Global Waste Heat Recovery Market Growth, Y-o-Y % Growth, 2025-2035
Figure 3: Global Waste Heat Recovery Market, by Technology, 2025 vs. 2032 (%)
Figure 4: Global Waste Heat Recovery Market, by Temperature Range, 2025 vs. 2032 (%)
Figure 5: Global Waste Heat Recovery Market, by End User, 2025 vs. 2032 (%)
Figure 6: Global Waste Heat Recovery Market, by Region/Country, 2025 vs. 2032 (%)
Figure 7: Impact Assessment of Market Drivers on Global Waste Heat Recovery Market (2025-2032)
Figure 8: Impact Assessment of Market Restraints on Global Waste Heat Recovery Market (2025-2032)
Figure 9: Impact Assessment of Market Opportunities on Global Waste Heat Recovery Market (2025-2032)
Figure 10: Porter's Five Forces Analysis: Global Waste Heat Recovery Market
Figure 11: Waste Heat Recovery Technology Adoption Rate by Industry, 2024
Figure 12: Key Energy Efficiency Regulations for Industrial Heat Recovery by Region
Figure 13: Investment Trends in Waste Heat Recovery Technology, 2022-2025
Figure 14: Heat Recovery Technology Evolution and Efficiency Improvements, 2020-2030
Figure 15: Total Cost of Ownership Comparison: Waste Heat Recovery vs. Conventional Energy Systems
Figure 16: Industrial Heat Recovery Infrastructure Development Timeline, 2023–2035
Figure 17: Energy Savings Potential: Waste Heat Recovery Systems by Industry Sector
Figure 18: Global Industrial Heat Recovery Implementation Timeline by Technology, 2023–2035
Figure 19: Energy-as-a-Service Model Adoption in Waste Heat Recovery Market
Figure 20: Temperature-Wise Heat Recovery Potential Across Industrial Sectors
Figure 21: ORC System Efficiency Trends and Performance Benchmarks, 2020-2035
Figure 22: Thermoelectric Generator Market Penetration by Application, 2024-2035
Figure 23: Heat Exchanger Technology Market Share Evolution, 2020-2035
Figure 24: Digital Integration and IoT Adoption in Heat Recovery Systems
Figure 25: Circular Economy Impact of Waste Heat Recovery Technologies
Figure 26: North America Waste Heat Recovery Market Snapshot, 2025-2035 (USD Million)
Figure 27: North America Waste Heat Recovery Market Share, by Country, 2025 vs. 2035 (%)
Figure 28: Europe Waste Heat Recovery Market Snapshot, 2025-2035 (USD Million)
Figure 29: Europe Waste Heat Recovery Market Share, by Country, 2025 vs. 2035 (%)
Figure 30: Asia-Pacific Waste Heat Recovery Market Snapshot, 2025-2035 (USD Million)
Figure 31: Asia-Pacific Waste Heat Recovery Market Share, by Country, 2025 vs. 2035 (%)
Figure 32: Latin America Waste Heat Recovery Market Snapshot, 2025-2035 (USD Million)
Figure 33: Latin America Waste Heat Recovery Market Share, by Country, 2025 vs. 2035 (%)
Figure 34: Middle East & Africa Waste Heat Recovery Market Snapshot, 2025-2035 (USD Million)
Figure 35: Middle East & Africa Waste Heat Recovery Market Share, by Country, 2025 vs. 2035 (%)


Published Date: Feb-2026
Published Date: Sep-2025
Published Date: Jul-2025
Published Date: Oct-2025
Subscribe to get the latest industry updates