Resources
About Us
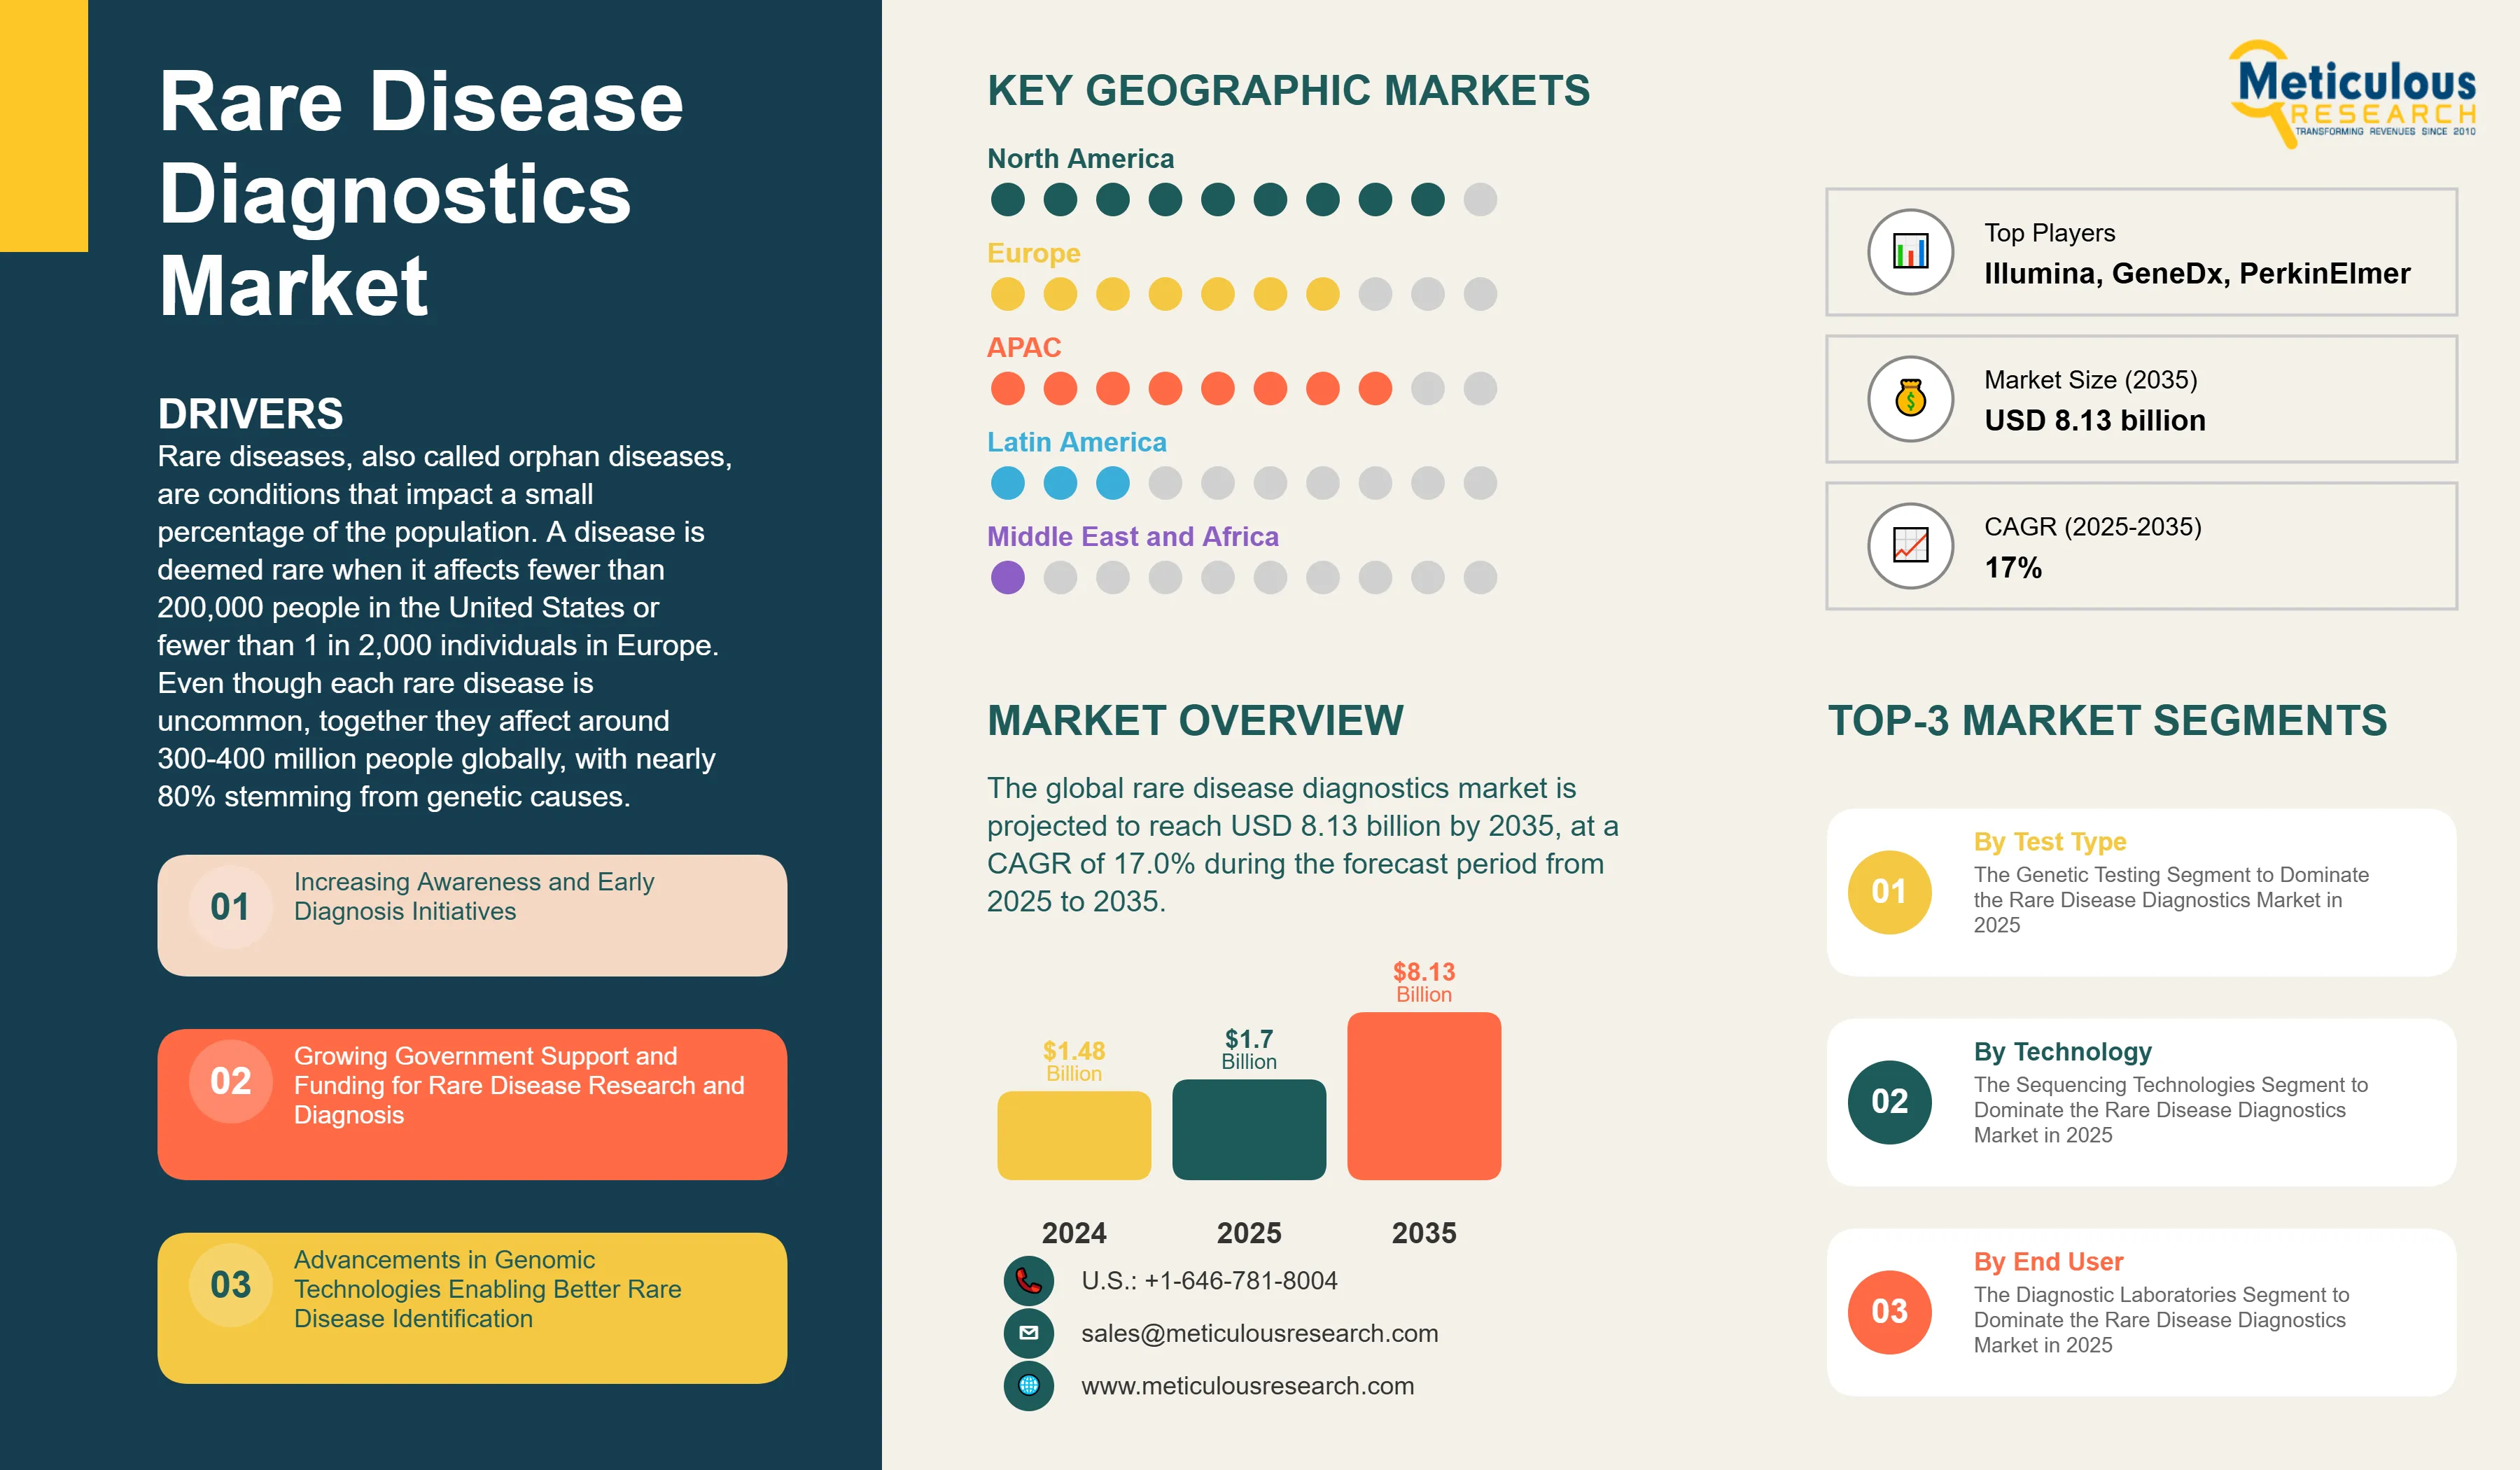
Rare Disease Diagnostics Market Size & Forecast
The global rare disease diagnostics market was valued at USD 1.48 billion in 2024. This market is projected to reach USD 8.13 billion by 2035 from an estimated USD 1.70 billion in 2025, at a CAGR of 17.0% during the forecast period from 2025 to 2035.
Rare diseases, also called orphan diseases, are conditions that impact a small percentage of the population. A disease is deemed rare when it affects fewer than 200,000 people in the United States or fewer than 1 in 2,000 individuals in Europe. Even though each rare disease is uncommon, together they affect around 300-400 million people globally, with nearly 80% stemming from genetic causes. Diagnosing rare diseases involves various testing methods, such as genetic testing, biochemical testing, and imaging diagnostics. These methods help accurately identify and understand these conditions.
Key factors driving this market include rising awareness and efforts for early diagnosis of rare diseases, increased government support and funding for research and diagnosis, improvements in genomic technologies that help identify rare diseases better, a growing number of rare genetic disorders worldwide, and the rising use of next-generation sequencing in clinical settings. Early and accurate diagnosis is essential as it can significantly shorten the diagnostic journey, which often takes 5-7 years, and allow for timely treatment, genetic counseling, and family planning.
The dramatic drop in the cost of DNA sequencing technologies over the past two decades—from about $100 million per genome in 2001 to under $1,000 now—has made thorough genomic testing affordable for clinical use. The shift from single-gene testing to comprehensive genomic analysis has significantly changed how we diagnose rare diseases. This new approach allows for the simultaneous evaluation of thousands of genes and greatly improves diagnostic outcomes.
With the growth of newborn screening programs around the world, a heightened focus on precision medicine and personalized treatment, the integration of artificial intelligence and machine learning in diagnostics, and better healthcare systems in emerging markets, the rare disease diagnostics market is expected to grow significantly. This growth is driven by the need for early detection, accurate molecular characterization, and treatment guidance in an increasingly complicated landscape of rare diseases.
Key Findings
Click here to: Get Free Sample Pages of this Report
Increasing Awareness and Early Diagnosis Initiatives
Increasing awareness and early diagnosis efforts for rare diseases drive the rare disease diagnostics market. Rare diseases affect an estimated 300 to 400 million people globally. However, the combined burden of over 7,000 identified rare diseases creates significant healthcare challenges and diagnostic needs. Growing awareness among healthcare professionals and the public is reducing the lengthy diagnostic journey that rare disease patients have historically faced.
Rare Disease Day, which takes place annually on the last day of February, has expanded to over 100 countries since it started in 2008. This day raises awareness about rare diseases and highlights the importance of early diagnosis. Patient advocacy organizations are crucial for education; they provide resources for patients, families, and healthcare providers while pushing for better diagnostic access. These organizations have become influential in raising awareness and promoting policy changes to enhance rare disease diagnosis and treatment.
Education initiatives for healthcare professionals are improving the recognition of rare diseases and the proper use of testing. Medical schools and continuing education programs are increasingly including rare disease content. This helps clinicians identify clinical patterns that suggest rare diseases and understand the diagnostic options available. Pediatricians, geneticists, and other specialists are becoming more aware of the signs that warrant genetic evaluation.
Early diagnosis initiatives stress the importance of quick molecular diagnosis to enable timely treatments. For many rare diseases, diagnosing early—before irreversible complications set in—greatly improves outcomes. Newborn screening programs are examples of effective early diagnosis strategies. They identify affected infants before symptoms appear, allowing for pre-symptomatic treatment. Expanding newborn screening panels and better screening methods are helping to detect more conditions earlier.
Clinical decision support tools that include rare disease differential diagnoses assist clinicians in considering rare diseases when assessing patients with unexplained symptoms. Computerized systems can alert doctors to possible rare diseases based on symptom patterns, lab findings, and clinical features. These tools help reduce missed diagnoses by encouraging consideration of conditions that clinicians might not think of otherwise. Telemedicine and virtual consultations also broaden access to rare disease expertise, allowing patients in underserved areas to consult with specialized geneticists and rare disease experts remotely.
Growing Government Support and Funding for Rare Disease Research and Diagnosis
Growing government support and funding for rare disease research and diagnosis drive market growth. Governments around the world are recognizing rare diseases as public health priorities. They are putting policies in place and allocating resources to improve diagnosis, treatment, and research. In the United States, the Orphan Drug Act of 1983 set up a system to encourage the development of therapies for rare diseases. It created the need for precise molecular diagnoses, which are often necessary to access targeted orphan drugs.
The National Institutes of Health (NIH) provides significant funding for rare disease research, exceeding $5 billion each year across various institutes. These funds support gene discovery, natural history studies, and the development of diagnostic methods. The NIH Undiagnosed Diseases Network showcases government investment in rare disease diagnosis. This network employs advanced genomic and phenotyping techniques to solve complex diagnostic cases. It has diagnosed hundreds of previously undiagnosed patients and identified many new disease genes, which enhances knowledge about rare diseases and aids future diagnostic efforts.
European governments are prioritizing rare diseases through coordinated initiatives. The European Union Rare Disease Action Program offers a framework for activities among member states. Many countries in Europe have developed national rare disease plans that outline strategies for diagnosis, treatment, research, and care coordination. These plans often include provisions for diagnostic access, specialized reference centers, and patient registries.
Asian nations are also increasing their investments in rare diseases. China has started initiatives focused on the development of diagnostics and therapies for rare diseases. Japan offers subsidies for rare disease diagnostics and treatments for specific conditions. India is creating policies addressing access to diagnosis and treatment for rare diseases. Government funding supports patient registries and natural history studies, which collect systematic data on disease manifestations, progression, and outcomes.
Public health newborn screening programs represent significant government investments in the early diagnosis of rare diseases. State and national programs screen millions of infants each year for treatable conditions using modern diagnostic technologies. The substantial and increasing government funding for rare disease research, diagnostic infrastructure, patient registries, and screening programs strongly supports market growth.
Rare Disease Diagnostics Market Opportunity
Integration of Artificial Intelligence and Machine Learning in Rare Disease Diagnosis
Artificial intelligence and machine learning applications in rare disease diagnosis present significant technological opportunities. They improve diagnostic capabilities, boost efficiency, and increase access to expertise. AI algorithms can analyze complex clinical and genomic data, recognize subtle patterns, and support diagnostic decision-making in ways that complement human abilities.
Facial recognition systems using deep learning identify distinct facial features linked to genetic syndromes. These AI tools examine patient photographs and suggest possible diagnoses based on facial characteristics. This helps clinicians consider relevant rare diseases they might not have thought about. Diagnostic accuracy for well-known syndromes with clear facial features is similar to or even better than that of experienced clinical geneticists. Tools like Face2Gene have been trained on thousands of images covering hundreds of genetic syndromes. Clinicians around the world use them as diagnostic aids.
Variant interpretation greatly benefits from machine learning. Figuring out whether genetic variants found through sequencing are harmful, harmless, or uncertain is a major challenge. Machine learning algorithms bring together various sources of evidence, including population allele frequencies, predictions from computational tools, conservation scores, and phenotype data to classify variants. These tools enhance interpretation consistency across laboratories and help manage the significant issue of uncertain significance variants.
Clinical decision support systems that use AI help with rare disease diagnosis by analyzing clinical features and proposing differential diagnoses. These systems can evaluate patient symptoms, physical examination results, lab results, and imaging data to create lists of possible rare diseases for doctors to consider. By widening the differential diagnosis, these tools help reduce missed diagnoses and shorten diagnostic journeys.
Natural language processing applied to electronic health records and medical literature supports rare disease identification. NLP algorithms can pull relevant clinical information from unstructured text, spot patterns that indicate rare diseases, and link patient characteristics to disease descriptions in databases. Phenotype matching algorithms use AI to compare clinical features of patients with databases that describe known genetic diseases, allowing for effective matching between patient characteristics and disease-related profiles.
Rare Disease Diagnostics Market Analysis: Top Market Opportunities
By Test Type: The Genetic Testing Segment to Dominate the Rare Disease Diagnostics Market in 2025
Based on test type, the rare disease diagnostics market is segmented into genetic testing, biochemical testing, imaging diagnostics, and other diagnostic tests. In 2025, the genetic testing segment is expected to account for the largest share of ~81.0% of the rare disease diagnostics market. The large share of this segment is attributed to the genetic etiology of approximately 80% of rare diseases, dramatic cost reductions in DNA sequencing technologies over the past two decades, expanding clinical adoption of comprehensive genomic testing approaches, and growing insurance coverage for genetic diagnostic procedures.
The evolution from single-gene sequential testing to comprehensive genomic analysis has fundamentally transformed rare disease diagnostic paradigms, enabling simultaneous evaluation of thousands of genes and improving diagnostic yields substantially. Within the genetic testing segment, next-generation sequencing is expected to dominate, driven by its ability to simultaneously analyze multiple genes or entire genomes, providing comprehensive diagnostic information.
Moreover, the genetic testing segment is also expected to register the highest CAGR of 18.3% during the forecast period of 2025–2035, driven by continuous technological improvements in sequencing platforms delivering enhanced accuracy and throughput, increasing physician comfort with ordering comprehensive genetic tests, expanding evidence base demonstrating clinical utility and cost-effectiveness, and rising insurer acceptance based on demonstrated diagnostic value.
By Disease Type: The Neurological Disorders Segment to Dominate the Rare Disease Diagnostics Market in 2025
Based on disease type, the rare disease diagnostics market is segmented into neurological disorders, metabolic disorders, hematological disorders, immunological disorders, endocrine disorders, cardiovascular disorders, and other rare diseases. In 2025, the neurological disorders segment is expected to account for the largest share of ~32% of the rare disease diagnostics market. The segment's large share is attributed to neurological rare diseases frequently having a strong genetic basis, disorders such as epilepsy syndromes, neuromuscular disorders, leukodystrophies, and mitochondrial disorders having highly heterogeneous presentations making advanced diagnostics essential, and high diagnostic odyssey rates leading clinicians to rely more heavily on specialized genomic and metabolic testing.
Moreover, this segment is also expected to register the highest CAGR of 20% during the forecast period, driven by accelerating adoption of next-generation sequencing, exome sequencing, and targeted gene panels for neurological conditions.
By Technology: The Sequencing Technologies Segment to Dominate the Rare Disease Diagnostics Market in 2025
Based on technology, the rare disease diagnostics market is segmented into sequencing technologies, PCR-based technologies, microarray technologies, mass spectrometry, immunoassays, and other technologies. In 2025, the sequencing technologies segment is expected to account for the largest share of ~58% of the rare disease diagnostics market. The large share is attributed to the capability for comprehensive genetic analysis enabling simultaneous evaluation of thousands of genes, dramatic cost reductions making sequencing economically feasible for clinical applications (costs declining from approximately $3 billion per genome in 2003 to under $1,000 currently), detection of virtually all variant types, and expanding clinical evidence demonstrating diagnostic utility and cost-effectiveness.
The transformation from research tool to routine clinical diagnostic has fundamentally altered rare disease diagnostic paradigms. Moreover, the sequencing technologies segment is also expected to register the highest CAGR during the forecast period, driven by continuous technological improvements, accumulating clinical evidence, expanding insurance coverage, and integration of artificial intelligence and machine learning enhancing variant interpretation.
By Sample Type: The Blood Samples Segment to Dominate the Rare Disease Diagnostics Market in 2025
Based on sample type, the rare disease diagnostics market is segmented into blood samples, urine samples, saliva samples, tissue samples, amniotic fluid, and other sample types. In 2025, the blood samples segment is expected to account for the largest share of the rare disease diagnostics market. The large share is attributed to blood samples' versatility supporting the broadest range of diagnostic testing approaches including genetic testing from DNA extracted from leukocytes, biochemical testing from plasma or serum, hematological testing from whole blood, and immunological testing from various blood components.
Well-established infrastructure for blood collection exists in healthcare facilities from tertiary medical centers to primary care clinics. Blood contains or reflects information about virtually all organ systems, making it suitable for diagnosing diverse systemic diseases. Moreover, this segment is also expected to register the highest CAGR of during the forecast period, driven by expanding applications of blood-based genetic testing, growing adoption of dried blood spot sampling, and technological advances enabling extraction of more information from smaller blood volumes.
By End User: The Diagnostic Laboratories Segment to Dominate the Rare Disease Diagnostics Market in 2025
Based on end user, the rare disease diagnostics market is segmented into diagnostic laboratories, hospital laboratories, academic & research institutes, pharmaceutical & biotechnology companies, and other end users. In 2025, the diagnostic laboratories segment is expected to account for the largest share of ~52% of the rare disease diagnostics market. The large share is attributed to diagnostic laboratories' role as specialized reference facilities concentrating rare disease testing expertise that individual hospitals cannot economically maintain, achievement of economies of scale through sample aggregation from multiple healthcare systems, substantial investments in advanced technologies including latest-generation sequencing platforms, and employment of specialized personnel including medical geneticists, genetic counselors, and metabolic specialists.
Moreover, this segment is also expected to register the highest CAGR during the forecast period, driven by increasing test referrals from hospitals and clinics, expanding test menus, and growing adoption of comprehensive genomic testing.
Geographical Analysis
North America Dominates the Rare Disease Diagnostics Market in 2025
Based on geography, the global rare disease diagnostics market is segmented into North America, Europe, Asia-Pacific, Latin America, and the Middle East & Africa. In 2025, North America is expected to account for the largest share of ~46% of the global rare disease diagnostics market.
The large market share of North America is attributed to the region's most developed rare disease testing infrastructure including leading genetic testing companies and advanced academic medical centers, comprehensive newborn screening programs testing approximately 3.8 million infants annually in the United States alone, expanding insurance coverage for genetic testing removing financial barriers to access, substantial government research funding through the National Institutes of Health exceeding $5 billion annually for rare disease research, and favorable regulatory environment for orphan drug development creating diagnostic demand.
The region benefits from well-established reimbursement frameworks compared to other regions, high healthcare expenditure enabling adoption of advanced diagnostic technologies, and concentration of pharmaceutical companies developing rare disease therapeutics requiring companion diagnostics.
However, Asia-Pacific is expected to register the highest CAGR of 22.7% during the forecast period. The rapid growth is driven by rapid healthcare infrastructure development in major economies particularly China and India, rising middle-class populations with increasing healthcare purchasing power, government investments in genomics and precision medicine programs, expanding insurance coverage improving diagnostic access, increasing awareness of genetic diseases and available testing, and large population bases creating substantial absolute numbers of rare disease patients despite lower per-capita prevalence.
Key Companies
Major companies in the global rare disease diagnostics market have implemented various strategies to expand their product offerings and augment their market shares. The key strategies followed by most companies include partnerships, agreements & collaborations, product launches & enhancements, and expansions. Partnerships and collaborations accounted for a major share of strategic developments from key players between 2023 and 2025.
Some of the prominent players operating in the global rare disease diagnostics market include Illumina, Inc. (U.S.), Thermo Fisher Scientific Inc. (U.S.), F. Hoffmann-La Roche Ltd (Switzerland), QIAGEN N.V. (Netherlands), PerkinElmer, Inc. (U.S.), Bio-Rad Laboratories, Inc. (U.S.), Agilent Technologies, Inc. (U.S.), CENTOGENE N.V. (Germany), GeneDx, LLC (U.S.), Invitae Corporation (U.S.), Blueprint Genetics (Finland/U.S.), Eurofins Scientific (Luxembourg), Fulgent Genetics, Inc. (U.S.), OPKO Health, Inc. (U.S.), and Strand Life Sciences Pvt. Ltd. (India).
Rare Disease Diagnostics Market Industry Overview: Latest Developments from Key Industry Players
|
Particulars |
Details |
|
Number of Pages |
413 |
|
Format |
|
|
Forecast Period |
2025–2035 |
|
Base Year |
2024 |
|
CAGR (Value) |
17.0% |
|
Market Size (Value) in 2025 |
USD 1.70 billion |
|
Market Size (Value) in 2035 |
USD 8.13 billion |
|
Segments Covered |
By Test Type
|
|
Countries Covered |
North America (U.S., Canada), Europe (Germany, France, U.K., Italy, Spain, and Rest of Europe), Asia-Pacific (China, India, Japan, Australia, South Korea, and Rest of Asia-Pacific), Latin America (Brazil, Mexico, Argentina, and Rest of Latin America), and the Middle East & Africa (Saudi Arabia, UAE, South Africa, and Rest of Middle East & Africa) |
|
Key Companies |
Illumina, Inc. (U.S.), Thermo Fisher Scientific Inc. (U.S.), F. Hoffmann-La Roche Ltd (Switzerland), QIAGEN N.V. (Netherlands), PerkinElmer, Inc. (U.S.), Bio-Rad Laboratories, Inc. (U.S.), Agilent Technologies, Inc. (U.S.), CENTOGENE N.V. (Germany), GeneDx, LLC (U.S.), Invitae Corporation (U.S.), Blueprint Genetics (Finland/U.S.), Eurofins Scientific (Luxembourg), Fulgent Genetics, Inc. (U.S.), OPKO Health, Inc. (U.S.), and Strand Life Sciences Pvt. Ltd. (India) |
The global rare disease diagnostics market size is projected to reach USD 1.70 billion in 2025.
The market is projected to grow from USD 1.70 billion in 2025 to USD 8.13 billion by 2035, at a CAGR of 17.0%.
The rare disease diagnostics market analysis indicates substantial growth, with projections indicating the market will reach USD 8.13 million by 2035, at a compound annual growth rate (CAGR) of 17.0% from 2025 to 2035.
The key companies operating in this market include Illumina, Inc. (U.S.), Thermo Fisher Scientific Inc. (U.S.), F. Hoffmann-La Roche Ltd (Switzerland), QIAGEN N.V. (Netherlands), PerkinElmer, Inc. (U.S.), Bio-Rad Laboratories, Inc. (U.S.), Agilent Technologies, Inc. (U.S.), CENTOGENE N.V. (Germany), GeneDx, LLC (U.S.), Invitae Corporation (U.S.), Blueprint Genetics (Finland/U.S.), Eurofins Scientific (Luxembourg), Fulgent Genetics, Inc. (U.S.), OPKO Health, Inc. (U.S.), and Strand Life Sciences Pvt. Ltd. (India).
Integration of genomic sequencing into newborn screening, artificial intelligence and machine learning in rare disease diagnosis, and expanding focus on precision medicine and personalized treatment approaches are prominent trends in the rare disease diagnostics market.
By test type, the genetic testing segment is forecasted to hold the largest market share during 2025-2035; by disease type, the neurological disorders segment is expected to dominate the market during 2025-2035; by technology, the sequencing technologies segment is expected to hold the largest share during 2025-2035; by sample type, the blood samples segment is expected to dominate during 2025-2035; by end user, the diagnostic laboratories segment is expected to hold the largest share during 2025-2035; and by geography, North America is expected to hold the largest share of the market during 2025-2035.
By region, North America is expected to hold the largest share of the rare disease diagnostics market in 2025. The large share is attributed to the region's most developed rare disease testing infrastructure, comprehensive newborn screening programs, expanding insurance coverage for genetic testing, and substantial government research funding. However, Asia-Pacific is expected to register the highest growth rate during the forecast period, driven by rapid healthcare infrastructure development and government investments in genomics programs.
Key drivers include increasing awareness and early diagnosis initiatives for rare diseases, growing government support and funding for rare disease research and diagnosis, advancements in genomic technologies enabling better rare disease identification, rising prevalence of rare genetic disorders globally, and increasing adoption of next-generation sequencing in clinical settings. These factors are collectively driving the adoption of rare disease diagnostic technologies across clinical and research applications.
1. Introduction
1.1. Market Definition & Scope
1.2. Currency & Limitations
2. Research Methodology
2.1. Research Approach
2.2. Data Collection & Validation
2.2.1. Secondary Research
2.2.2. Primary Research
2.3. Market Assessment
2.3.1. Market Size Estimation
2.3.2. Bottom-Up Approach
2.3.3. Top-Down Approach
2.3.4. Growth Forecast
2.4. Assumptions for the Study
3. Executive Summary
4. Market Insights
4.1. Overview
4.2. Factors Affecting Market Growth
4.2.1. Drivers
4.2.1.1. Increasing Awareness and Early Diagnosis Initiatives
4.2.1.2. Growing Government Support and Funding for Rare Disease Research and Diagnosis
4.2.1.3. Advancements in Genomic Technologies Enabling Better Rare Disease Identification
4.2.1.4. Rising Prevalence of Rare Genetic Disorders Globally
4.2.1.5. Increasing Adoption of Next-Generation Sequencing in Clinical Settings
4.2.2. Restraints
4.2.2.1. High Cost of Rare Disease Diagnostic Tests Limiting Accessibility
4.2.2.2. Limited Awareness Among Healthcare Professionals in Developing Regions
4.2.2.3. Complex Regulatory Pathways for Rare Disease Diagnostics
4.2.3. Opportunities
4.2.3.1. Expanding Newborn Screening Programs Worldwide Offer Significant Growth Opportunities
4.2.3.2. Growing Focus on Precision Medicine and Personalized Treatment Approaches
4.2.3.3. Increasing Strategic Collaborations Between Diagnostic Companies and Pharmaceutical Firms
4.2.3.4. Emerging Markets with Improving Healthcare Infrastructure
4.2.4. Challenges
4.2.4.1. Long Diagnostic Odyssey for Rare Disease Patients
4.2.4.2. Limited Reimbursement Coverage for Rare Disease Testing
4.3. Industry & Technology Trends
4.3.1. Integration of Genomic Sequencing into Newborn Screening
4.3.2. Artificial Intelligence and Machine Learning in Rare Disease Diagnosis
4.4. Regulatory Analysis
4.4.1. International Organization for Standardization (ISO)
4.4.2. North America
4.4.3. Europe
4.4.4. Asia-Pacific
4.4.5. Latin America
4.4.6. Middle East & Africa
4.5. Value Chain Analysis
4.5.1. Raw Material Suppliers
4.5.2. Component Manufacturers
4.5.3. Diagnostic Manufacturers
4.5.4. Testing Laboratories and Service Providers
4.5.5. Healthcare Providers and End Users
4.5.6. Value Addition At Each Stage
5. Global Rare Disease Diagnostics Market Assessment – By Type
5.1. Overview
5.2. Genetic Testing
5.2.1. Next-Generation Sequencing (NGS)
5.2.1.1. Whole Exome Sequencing (WES)
5.2.1.2. Whole Genome Sequencing (WGS)
5.2.1.3. Targeted Gene Panels
5.2.2. Sanger Sequencing
5.2.3. Chromosomal Microarray Analysis
5.2.4. Karyotyping
5.2.5. Fluorescence in Situ Hybridization (FISH)
5.2.6. PCR-Based Testing
5.3. Biochemical Testing
5.3.1. Enzyme Assays
5.3.2. Metabolite Analysis
5.3.3. Protein Analysis
5.4. Imaging Diagnostics
5.5. Other Diagnostic Tests
6. Global Rare Disease Diagnostics Market Assessment – By Disease Type
6.1. Overview
6.2. Neurological Disorders
6.3. Metabolic Disorders
6.4. Hematological Disorders
6.5. Immunological Disorders
6.6. Endocrine Disorders
6.7. Cardiovascular Disorders
6.8. Other Rare Diseases
7. Global Rare Disease Diagnostics Market Assessment – By Technology
7.1. Overview
7.2. Sequencing Technologies
7.2.1. Next-Generation Sequencing
7.2.2. Sanger Sequencing
7.3. PCR-Based Technologies
7.3.1. Real-Time PCR
7.3.2. Digital PCR
7.3.3. Multiplex PCR
7.4. Microarray Technologies
7.5. Mass Spectrometry
7.6. Immunoassays
7.7. Other Technologies
8. Global Rare Disease Diagnostics Market Assessment – By Sample Type
8.1. Overview
8.2. Blood Samples
8.2.1. Whole Blood
8.2.2. Plasma
8.2.3. Serum
8.2.4. Dried Blood Spots
8.3. Urine Samples
8.4. Saliva Samples
8.5. Tissue Samples
8.6. Amniotic Fluid
8.7. Other Sample Types
9. Global Rare Disease Diagnostics Market Assessment – By End User
9.1. Overview
9.2. Hospital Laboratories
9.3. Diagnostic Laboratories
9.3.1. Reference Laboratories
9.3.2. Clinical Laboratories
9.4. Academic & Research Institutes
9.5. Pharmaceutical & Biotechnology Companies
9.6. Other End Users
10. Rare Disease Diagnostics Market Assessment – By Geography
10.1. Overview
10.2. North America
10.2.1. U.S.
10.2.2. Canada
10.3. Europe
10.3.1. Germany
10.3.2. France
10.3.3. U.K.
10.3.4. Italy
10.3.5. Spain
10.3.6. Switzerland
10.3.7. Belgium
10.3.8. Rest of Europe
10.4. Asia-Pacific
10.4.1. China
10.4.2. Japan
10.4.3. India
10.4.4. Australia
10.4.5. South Korea
10.4.6. Rest of Asia-Pacific
10.5. Latin America
10.5.1. Brazil
10.5.2. Mexico
10.5.3. Rest of Latin America
10.6. Middle East & Africa
10.6.1. Saudi Arabia
10.6.2. UAE
10.6.3. South Africa
10.6.4. Rest of Middle East & Africa
11. Competitive Landscape
11.1. Introduction
11.2. Key Growth Strategies
11.3. Competitive Benchmarking
11.4. Competitive Dashboard
11.4.1. Industry Leaders
11.4.2. Market Differentiators
11.4.3. Vanguards
11.4.4. Emerging Companies
11.5. Market Share/Position Analysis
12. Company Profiles
12.1. Illumina, Inc. (U.S.)
12.1.1. Company Overview
12.1.2. Financial Overview
12.1.3. Product Portfolio
12.1.4. Strategic Developments
12.2. Thermo Fisher Scientific, Inc.
12.2.1. Company Overview
12.2.2. Financial Overview
12.2.3. Product Portfolio
12.2.4. Strategic Developments
12.3. Agilent Technologies, Inc.
12.3.1. Company Overview
12.3.2. Financial Overview
12.3.3. Product Portfolio
12.4. Qiagen N.V.
12.4.1. Company Overview
12.4.2. Financial Overview
12.4.3. Product Portfolio
12.4.4. Strategic Developments
12.5. Bio-Rad Laboratories, Inc.
12.5.1. Company Overview
12.5.2. Financial Overview
12.5.3. Product Portfolio
12.5.4. Strategic Developments
12.6. F. Hoffmann-La Roche Ltd. (U.S.)
12.6.1. Company Overview
12.6.2. Financial Overview
12.6.3. Product Portfolio
12.6.4. Strategic Developments
12.7. Centogene N.V.
12.7.1. Company Overview
12.7.2. Product Portfolio
12.7.3. Strategic Developments
12.8. Blueprint Genetics
12.8.1. Company Overview
12.8.2. Product Portfolio
12.9. Invitae Corporation
12.9.1. Company Overview
12.9.2. Product Portfolio
12.9.3. Strategic Developments
12.10. Strand Life Sciences Pvt. Ltd.
12.10.1. Company Overview
12.10.2. Product Portfolio
12.10.3. Strategic Developments
12.11. OPKO Health, Inc.
12.11.1. Company Overview
12.11.2. Financial Overview
12.11.3. Product Portfolio
12.12. Fulgent Genetics, Inc.
12.12.1. Company Overview
12.12.2. Financial Overview
12.12.3. Product Portfolio
12.13. GeneDx, LLC
12.13.1. Company Overview
12.13.2. Financial Overview
12.13.3. Product Portfolio
12.14. Eurofins Scientific
12.14.1. Company Overview
12.14.2. Financial Overview
12.14.3. Product Portfolio
13. Appendix
13.1. Available Customization
13.2. Related Reports
List of Tables
Table 1 Global Rare Disease Diagnostics Market, By Type, 2025 Vs. 2035 (USD Million)
Table 2 Global Rare Disease Diagnostics Market for Genetic Testing, By Type, 2023-2035 (Million)
Table 3 Global Rare Disease Diagnostics Market for Genetic Testing, By Region/Country, 2023–2035 (USD Million)
Table 4 Global Rare Disease Diagnostics Market for Next-Generation Sequencing (NGS), By Type, 2023-2035 (USD Million)
Table 5 Global Rare Disease Diagnostics Market for Nest Generation Sequencing (NGS), By Region/Country, 2023–2035 (USD Million)
Table 6 Global Rare Disease Diagnostics Market for Whole Exome Sequencing (WES), By Region/Country, 2023–2035 (USD Million)
Table 7 Global Rare Disease Diagnostics Market for Whole Genome Sequencing (WGS), By Region/Country, 2023–2035 (USD Million)
Table 8 Global Rare Disease Diagnostics Market for Targeted Gene Panels, By Region/Country, 2023–2035 (USD Million)
Table 9 Global Rare Disease Diagnostics Market for Sanger Sequencing, By Region/Country, 2023–2035 (USD Million)
Table 10 Global Rare Disease Diagnostics Market for Chromosomal Microarray Analysis (CMA), By Region/Country, 2023–2035 (USD Million)
Table 11 Global Rare Disease Diagnostics Market for Karyotyping By Region/Country, 2023–2035 (USD Million)
Table 12 Global Rare Disease Diagnostics Market for Fluorescence in Situ Hybridization (Fish), By Region/Country, 2023–2035 (USD Million)
Table 13 Global Rare Disease Diagnostics Market for PCR-Based Testing, By Region/Country, 2023–2035 (USD Million)
Table 14 Global Rare Disease Diagnostics Market for Biochemical Testing, By Type, 2023-2035 (USD Million)
Table 15 Global Rare Disease Diagnostics Market for Biochemical Testing, By Region/Country, 2023–2035 (USD Million)
Table 16 Global Rare Disease Diagnostics Market for Enzyme Assays, By Region/Country, 2023–2035 (USD Million)
Table 17 Global Rare Disease Diagnostics Market for Metabolite Analysis, By Region/Country, 2023–2035 (USD Million)
Table 18 Global Rare Disease Diagnostics Market for Protein Analysis, By Region/Country, 2023–2035 (USD Million)
Table 19 Global Rare Disease Diagnostics Market for Imaging Diagnostics, By Region/Country, 2023–2035 (USD Million)
Table 20 Global Rare Disease Diagnostics Market for Other Diagnostic Tests, By Region/Country, 2023–2035 (USD Million)
Table 21 Global Rare Disease Diagnostics Market, By Disease Type, 2025-2035 (USD Million)
Table 22 Global Rare Disease Diagnostics Market for Neurological Disorders, By Region/Country, 2023–2035 (USD Million)
Table 23 Global Rare Disease Diagnostics Market for Metabolic Disorders, By Region/Country, 2023–2035 (USD Million)
Table 24 Global Rare Disease Diagnostics Market for Hematological Disorders, By Region/Country, 2023–2035 (USD Million)
Table 25 Global Rare Disease Diagnostics Market for Immunological Disorders, By Region/Country, 2023–2035 (USD Million)
Table 26 Global Rare Disease Diagnostics Market for Endocrine Disorders, By Region/Country, 2023–2035 (USD Million)
Table 27 Global Rare Disease Diagnostics Market for Cardiovascular Rare Disorders, By Region/Country, 2023–2035 (USD Million)
Table 28 Global Rare Disease Diagnostics Market for Other Rare Diseases, By Region/Country, 2023–2035 (USD Million)
Table 29 Global Rare Disease Diagnostics Market, By Technology, 2025–2035 (USD Million)
Table 30 Global Rare Disease Diagnostics Market for Sequencing Technologies, By Type, 2025-2035 (USD Million)
Table 31 Global Rare Disease Diagnostics Market for Sequencing Technologies, By Region/Country, 2023–2035 (USD Million)
Table 32 Global Rare Disease Diagnostics Market for Nest Generation Sequencing (NGS), By Region/Country, 2023–2035 (USD Million)
Table 33 Global Rare Disease Diagnostics Market for Sanger Sequencing, By Region/Country, 2023–2035 (USD Million)
Table 34 Global Rare Disease Diagnostics Market for PCR-Based Technologies, By Type, 2025-2035 (USD Million)
Table 35 Global Rare Disease Diagnostics Market for PCR-Based Technologies, By Region/Country, 2023–2035 (USD Million)
Table 36 Global Rare Disease Diagnostics Market for Real-Time PCR (qRT-PCR), By Region/Country, 2023–2035 (USD Million)
Table 37 Global Rare Disease Diagnostics Market for Digital PCR (DPCR), By Region/Country, 2023–2035 (USD Million)
Table 38 Global Rare Disease Diagnostics Market for Multiplex PCR, By Region/Country, 2023–2035 (USD Million)
Table 39 Global Rare Disease Diagnostics Market for Microarray Technologies, By Region/Country, 2023–2035 (USD Million)
Table 40 Global Rare Disease Diagnostics Market for Mass Spectrometry, By Region/Country, 2023–2035 (USD Million)
Table 41 Global Rare Disease Diagnostics Market for Immunoassays, By Region/Country, 2023–2035 (USD Million)
Table 42 Global Rare Disease Diagnostics Market for Other Technologies, By Region/Country, 2023–2035 (USD Million)
Table 43 Global Rare Disease Diagnostics Market, By Sample Type, 2025–2035 (USD Million)
Table 44 Global Rare Disease Diagnostics Market Blood Sample, By Type, 2025–2035 (USD Million)
Table 45 Global Rare Disease Diagnostics Market for Blood Samples, By Region/Country, 2023–2035 (USD Million)
Table 46 Global Rare Disease Diagnostics Market for Whole Blood, By Region/Country, 2023–2035 (USD Million)
Table 47 Global Rare Disease Diagnostics Market for Plasma, By Region/Country, 2023–2035 (USD Million)
Table 48 Global Rare Disease Diagnostics Market for Serum, By Region/Country, 2023–2035 (USD Million)
Table 49 Global Rare Disease Diagnostics Market for Dried Blood Spots (Dbs), By Region/Country, 2023–2035 (USD Million)
Table 50 Global Rare Disease Diagnostics Market for Urine Samples, By Region/Country, 2023–2035 (USD Million)
Table 51 Global Rare Disease Diagnostics Market for Saliva Samples, By Region/Country, 2023–2035 (USD Million)
Table 52 Global Rare Disease Diagnostics Market for Tissue Samples, By Region/Country, 2023–2035 (USD Million)
Table 53 Global Rare Disease Diagnostics Market for Amniotic Fluid, By Region/Country, 2023–2035 (USD Million)
Table 54 Global Rare Disease Diagnostics Market for Other Sample Types, By Region/Country, 2023–2035 (USD Million)
Table 55 Global Rare Disease Diagnostics Market, By End User, 2025–2035 (USD Million)
Table 56 Global Rare Disease Diagnostics Market for Hospital Laboratories, By Region/Country, 2023–2035 (USD Million)
Table 57 Global Rare Disease Diagnostics Market for Diagnostic Laboratories, By Type, 2025–2035 (USD Million)
Table 58 Global Rare Disease Diagnostics Market for Diagnostic Laboratories, By Region/Country, 2023–2035 (USD Million)
Table 59 Global Rare Disease Diagnostics Market for Reference Laboratories, By Region/Country, 2023–2035 (USD Million)
Table 60 Global Rare Disease Diagnostics Market for Clinical Laboratories, By Region/Country, 2023–2035 (USD Million)
Table 61 Global Rare Disease Diagnostics Market for Academic & Research Institutes, By Region/Country, 2023–2035 (USD Million)
Table 62 Global Rare Disease Diagnostics Market for Pharmaceutical & Biotechnology Companies, By Region/Country, 2023–2035 (USD Million)
Table 63 Global Rare Disease Diagnostics Market for Other End User, By Region/Country, 2023–2035 (USD Million)
Table 64 North America: Rare Disease Diagnostics Market, By Country, 2023-2035 (USD Million)
Table 65 North America: Rare Disease Diagnostics Market, By Type, 2023-2035 (USD Million)
Table 66 North America: Rare Disease Diagnostics Market for Genetic Testing, By Type, 2023-2035 (USD Million)
Table 67 North America: Rare Disease Diagnostics Market for Next-Generation Sequencing (NGS), By Type, 2023-2035 (USD Million)
Table 68 North America: Rare Disease Diagnostics Market for Biochemical Testing, By Type, 2023-2035 (USD Million)
Table 69 North America: Rare Disease Diagnostics Market, By Disease Type, 2025-2035 (USD Million)
Table 70 North America: Rare Disease Diagnostics Market, By Technology, 2025–2035 (USD Million)
Table 71 North America: Rare Disease Diagnostics Market for Sequencing Technologies, By Type, 2025-2035 (USD Million)
Table 72 North America: Rare Disease Diagnostics Market for PCR-Based Technologies, By Type, 2025-2035 (USD Million)
Table 73 North America: Rare Disease Diagnostics Market, By Sample Type, 2025–2035 (USD Million)
Table 74 North America: Rare Disease Diagnostics Market for Blood Sample, By Type, 2025–2035 (USD Million)
Table 75 North America: Rare Disease Diagnostics Market, By End User, 2025–2035 (USD Million)
Table 76 North America: Rare Disease Diagnostics Market for Diagnostic Laboratories, By Type, 2025–2035 (USD Million)
Table 77 U.S.: Rare Disease Diagnostics Market, By Type, 2023-2035 (USD Million)
Table 78 U.S.: Rare Disease Diagnostics Market for Genetic Testing, By Type, 2023-2035 (USD Million)
Table 79 U.S.: Rare Disease Diagnostics Market for Next-Generation Sequencing (NGS), By Type, 2023-2035 (USD Million)
Table 80 U.S.: Rare Disease Diagnostics Market for Biochemical Testing, By Type, 2023-2035 (USD Million)
Table 81 U.S.: Rare Disease Diagnostics Market, By Disease Type, 2025-2035 (USD Million)
Table 82 U.S.: Rare Disease Diagnostics Market, By Technology, 2025–2035 (USD Million)
Table 83 U.S.: Rare Disease Diagnostics Market for Sequencing Technologies, By Type, 2025-2035 (USD Million)
Table 84 U.S.: Rare Disease Diagnostics Market for PCR-Based Technologies, By Type, 2025-2035 (USD Million)
Table 85 U.S.: Rare Disease Diagnostics Market, By Sample Type, 2025–2035 (USD Million)
Table 86 U.S.: Rare Disease Diagnostics Market for Blood Sample, By Type, 2025–2035 (USD Million)
Table 87 U.S.: Rare Disease Diagnostics Market, By End User, 2025–2035 (USD Million)
Table 88 U.S.: Rare Disease Diagnostics Market for Diagnostic Laboratories, By Type, 2025–2035 (USD Million)
Table 89 Canada: Rare Disease Diagnostics Market, By Type, 2023-2035 (USD Million)
Table 90 Canada: Rare Disease Diagnostics Market for Genetic Testing, By Type, 2023-2035 (USD Million)
Table 91 Canada: Rare Disease Diagnostics Market for Next-Generation Sequencing (NGS), By Type, 2023-2035 (USD Million)
Table 92 Canada: Rare Disease Diagnostics Market for Biochemical Testing, By Type, 2023-2035 (USD Million)
Table 93 Canada: Rare Disease Diagnostics Market, By Disease Type, 2025-2035 (USD Million)
Table 94 Canada: Rare Disease Diagnostics Market, By Technology, 2025–2035 (USD Million)
Table 95 Canada: Rare Disease Diagnostics Market for Sequencing Technologies, By Type, 2025-2035 (USD Million)
Table 96 Canada: Rare Disease Diagnostics Market for PCR-Based Technologies, By Type, 2025-2035 (USD Million)
Table 97 Canada: Rare Disease Diagnostics Market, By Sample Type, 2025–2035 (USD Million)
Table 98 Canada: Rare Disease Diagnostics Market for Blood Sample, By Type, 2025–2035 (USD Million)
Table 99 Canada: Rare Disease Diagnostics Market, By End User, 2025–2035 (USD Million)
Table 100 Canada: Rare Disease Diagnostics Market for Diagnostic Laboratories, By Type, 2025–2035 (USD Million)
Table 101 Europe: Rare Disease Diagnostics Market, By Country, 2023-2035 (USD Million)
Table 102 Europe: Rare Disease Diagnostics Market, By Type, 2023-2035 (USD Million)
Table 103 Europe: Rare Disease Diagnostics Market for Genetic Testing, By Type, 2023-2035 (USD Million)
Table 104 Europe: Rare Disease Diagnostics Market for Next-Generation Sequencing (NGS), By Type, 2023-2035 (USD Million)
Table 105 Europe: Rare Disease Diagnostics Market for Biochemical Testing, By Type, 2023-2035 (USD Million)
Table 106 Europe: Rare Disease Diagnostics Market, By Disease Type, 2025-2035 (USD Million)
Table 107 Europe: Rare Disease Diagnostics Market, By Technology, 2025–2035 (USD Million)
Table 108 Europe: Rare Disease Diagnostics Market for Sequencing Technologies, By Type, 2025-2035 (USD Million)
Table 109 Europe: Rare Disease Diagnostics Market for PCR-Based Technologies, By Type, 2025-2035 (USD Million)
Table 110 Europe: Rare Disease Diagnostics Market, By Sample Type, 2025–2035 (USD Million)
Table 111 Europe: Rare Disease Diagnostics Market for Blood Sample, By Type, 2025–2035 (USD Million)
Table 112 Europe: Rare Disease Diagnostics Market, By End User, 2025–2035 (USD Million)
Table 113 Europe: Rare Disease Diagnostics Market for Diagnostic Laboratories, By Type, 2025–2035 (USD Million)
Table 114 Germany: Rare Disease Diagnostics Market, By Type, 2023-2035 (USD Million)
Table 115 Germany: Rare Disease Diagnostics Market for Genetic Testing, By Type, 2023-2035 (USD Million)
Table 116 Germany: Rare Disease Diagnostics Market for Next-Generation Sequencing (NGS), By Type, 2023-2035 (USD Million)
Table 117 Germany: Rare Disease Diagnostics Market for Biochemical Testing, By Type, 2023-2035 (USD Million)
Table 118 Germany: Rare Disease Diagnostics Market, By Disease Type, 2025-2035 (USD Million)
Table 119 Germany: Rare Disease Diagnostics Market, By Technology, 2025–2035 (USD Million)
Table 120 Germany: Rare Disease Diagnostics Market for Sequencing Technologies, By Type, 2025-2035 (USD Million)
Table 121 Germany: Rare Disease Diagnostics Market for PCR-Based Technologies, By Type, 2025-2035 (USD Million)
Table 122 Germany: Rare Disease Diagnostics Market, By Sample Type, 2025–2035 (USD Million)
Table 123 Germany: Rare Disease Diagnostics Market for Blood Sample, By Type, 2025–2035 (USD Million)
Table 124 Germany: Rare Disease Diagnostics Market, By End User, 2025–2035 (USD Million)
Table 125 Germany: Rare Disease Diagnostics Market for Diagnostic Laboratories, By Type, 2025–2035 (USD Million)
Table 126 France: Rare Disease Diagnostics Market, By Type, 2023-2035 (USD Million)
Table 127 France: Rare Disease Diagnostics Market for Genetic Testing, By Type, 2023-2035 (USD Million)
Table 128 France: Rare Disease Diagnostics Market for Next-Generation Sequencing (NGS), By Type, 2023-2035 (USD Million)
Table 129 France: Rare Disease Diagnostics Market for Biochemical Testing, By Type, 2023-2035 (USD Million)
Table 130 France: Rare Disease Diagnostics Market, By Disease Type, 2025-2035 (USD Million)
Table 131 France: Rare Disease Diagnostics Market, By Technology, 2025–2035 (USD Million)
Table 132 France: Rare Disease Diagnostics Market for Sequencing Technologies, By Type, 2025-2035 (USD Million)
Table 133 France: Rare Disease Diagnostics Market for PCR-Based Technologies, By Type, 2025-2035 (USD Million)
Table 134 France: Rare Disease Diagnostics Market, By Sample Type, 2025–2035 (USD Million)
Table 135 France: Rare Disease Diagnostics Market for Blood Sample, By Type, 2025–2035 (USD Million)
Table 136 France: Rare Disease Diagnostics Market, By End User, 2025–2035 (USD Million)
Table 137 France: Rare Disease Diagnostics Market for Diagnostic Laboratories, By Type, 2025–2035 (USD Million)
Table 138 U.K.: Rare Disease Diagnostics Market, By Type, 2023-2035 (USD Million)
Table 139 U.K.: Rare Disease Diagnostics Market for Genetic Testing, By Type, 2023-2035 (USD Million)
Table 140 U.K.: Rare Disease Diagnostics Market for Next-Generation Sequencing (NGS), By Type, 2023-2035 (USD Million)
Table 141 U.K.: Rare Disease Diagnostics Market for Biochemical Testing, By Type, 2023-2035 (USD Million)
Table 142 U.K.: Rare Disease Diagnostics Market, By Disease Type, 2025-2035 (USD Million)
Table 143 U.K.: Rare Disease Diagnostics Market, By Technology, 2025–2035 (USD Million)
Table 144 U.K.: Rare Disease Diagnostics Market for Sequencing Technologies, By Type, 2025-2035 (USD Million)
Table 145 U.K.: Rare Disease Diagnostics Market for PCR-Based Technologies, By Type, 2025-2035 (USD Million)
Table 146 U.K.: Rare Disease Diagnostics Market, By Sample Type, 2025–2035 (USD Million)
Table 147 U.K.: Rare Disease Diagnostics Market for Blood Sample, By Type, 2025–2035 (USD Million)
Table 148 U.K.: Rare Disease Diagnostics Market, By End User, 2025–2035 (USD Million)
Table 149 U.K.: Rare Disease Diagnostics Market for Diagnostic Laboratories, By Type, 2025–2035 (USD Million)
Table 150 Italy: Rare Disease Diagnostics Market, By Type, 2023-2035 (USD Million)
Table 151 Italy: Rare Disease Diagnostics Market for Genetic Testing, By Type, 2023-2035 (USD Million)
Table 152 Italy: Rare Disease Diagnostics Market for Next-Generation Sequencing (NGS), By Type, 2023-2035 (USD Million)
Table 153 Italy: Rare Disease Diagnostics Market for Biochemical Testing, By Type, 2023-2035 (USD Million)
Table 154 Italy: Rare Disease Diagnostics Market, By Disease Type, 2025-2035 (USD Million)
Table 155 Italy: Rare Disease Diagnostics Market, By Technology, 2025–2035 (USD Million)
Table 156 Italy: Rare Disease Diagnostics Market for Sequencing Technologies, By Type, 2025-2035 (USD Million)
Table 157 Italy: Rare Disease Diagnostics Market for PCR-Based Technologies, By Type, 2025-2035 (USD Million)
Table 158 Italy: Rare Disease Diagnostics Market, By Sample Type, 2025–2035 (USD Million)
Table 159 Italy: Rare Disease Diagnostics Market for Blood Sample, By Type, 2025–2035 (USD Million)
Table 160 Italy: Rare Disease Diagnostics Market, By End User, 2025–2035 (USD Million)
Table 161 Italy: Rare Disease Diagnostics Market for Diagnostic Laboratories, By Type, 2025–2035 (USD Million)
Table 162 Spain: Rare Disease Diagnostics Market, By Type, 2023-2035 (USD Million)
Table 163 Spain: Rare Disease Diagnostics Market for Genetic Testing, By Type, 2023-2035 (USD Million)
Table 164 Spain: Rare Disease Diagnostics Market for Next-Generation Sequencing (NGS), By Type, 2023-2035 (USD Million)
Table 165 Spain: Rare Disease Diagnostics Market for Biochemical Testing, By Type, 2023-2035 (USD Million)
Table 166 Spain: Rare Disease Diagnostics Market, By Disease Type, 2025-2035 (USD Million)
Table 167 Spain: Rare Disease Diagnostics Market, By Technology, 2025–2035 (USD Million)
Table 168 Spain: Rare Disease Diagnostics Market for Sequencing Technologies, By Type, 2025-2035 (USD Million)
Table 169 Spain: Rare Disease Diagnostics Market for PCR-Based Technologies, By Type, 2025-2035 (USD Million)
Table 170 Spain: Rare Disease Diagnostics Market, By Sample Type, 2025–2035 (USD Million)
Table 171 Spain: Rare Disease Diagnostics Market for Blood Sample, By Type, 2025–2035 (USD Million)
Table 172 Spain: Rare Disease Diagnostics Market, By End User, 2025–2035 (USD Million)
Table 173 Spain: Rare Disease Diagnostics Market for Diagnostic Laboratories, By Type, 2025–2035 (USD Million)
Table 174 Switzerland: Rare Disease Diagnostics Market, By Type, 2023-2035 (USD Million)
Table 175 Switzerland: Rare Disease Diagnostics Market for Genetic Testing, By Type, 2023-2035 (USD Million)
Table 176 Switzerland: Rare Disease Diagnostics Market for Next-Generation Sequencing (NGS), By Type, 2023-2035 (USD Million)
Table 177 Switzerland: Rare Disease Diagnostics Market for Biochemical Testing, By Type, 2023-2035 (USD Million)
Table 178 Switzerland: Rare Disease Diagnostics Market, By Disease Type, 2025-2035 (USD Million)
Table 179 Switzerland: Rare Disease Diagnostics Market, By Technology, 2025–2035 (USD Million)
Table 180 Switzerland: Rare Disease Diagnostics Market for Sequencing Technologies, By Type, 2025-2035 (USD Million)
Table 181 Switzerland: Rare Disease Diagnostics Market for PCR-Based Technologies, By Type, 2025-2035 (USD Million)
Table 182 Switzerland: Rare Disease Diagnostics Market, By Sample Type, 2025–2035 (USD Million)
Table 183 Switzerland: Rare Disease Diagnostics Market for Blood Sample, By Type, 2025–2035 (USD Million)
Table 184 Switzerland: Rare Disease Diagnostics Market, By End User, 2025–2035 (USD Million)
Table 185 Switzerland: Rare Disease Diagnostics Market for Diagnostic Laboratories, By Type, 2025–2035 (USD Million)
Table 186 Belgium: Rare Disease Diagnostics Market, By Type, 2023-2035 (USD Million)
Table 187 Belgium: Rare Disease Diagnostics Market for Genetic Testing, By Type, 2023-2035 (USD Million)
Table 188 Belgium: Rare Disease Diagnostics Market for Next-Generation Sequencing (NGS), By Type, 2023-2035 (USD Million)
Table 189 Belgium: Rare Disease Diagnostics Market for Biochemical Testing, By Type, 2023-2035 (USD Million)
Table 190 Belgium: Rare Disease Diagnostics Market, By Disease Type, 2025-2035 (USD Million)
Table 191 Belgium: Rare Disease Diagnostics Market, By Technology, 2025–2035 (USD Million)
Table 192 Belgium: Rare Disease Diagnostics Market for Sequencing Technologies, By Type, 2025-2035 (USD Million)
Table 193 Belgium: Rare Disease Diagnostics Market for PCR-Based Technologies, By Type, 2025-2035 (USD Million)
Table 194 Belgium: Rare Disease Diagnostics Market, By Sample Type, 2025–2035 (USD Million)
Table 195 Belgium: Rare Disease Diagnostics Market for Blood Sample, By Type, 2025–2035 (USD Million)
Table 196 Belgium: Rare Disease Diagnostics Market, By End User, 2025–2035 (USD Million)
Table 197 Belgium: Rare Disease Diagnostics Market for Diagnostic Laboratories, By Type, 2025–2035 (USD Million)
Table 198 Rest of Europe: Rare Disease Diagnostics Market, By Type, 2023-2035 (USD Million)
Table 199 Rest of Europe: Rare Disease Diagnostics Market for Genetic Testing, By Type, 2023-2035 (USD Million)
Table 200 Rest of Europe: Rare Disease Diagnostics Market for Next-Generation Sequencing (NGS), By Type, 2023-2035 (USD Million)
Table 201 Rest of Europe: Rare Disease Diagnostics Market for Biochemical Testing, By Type, 2023-2035 (USD Million)
Table 202 Rest of Europe: Rare Disease Diagnostics Market, By Disease Type, 2025-2035 (USD Million)
Table 203 Rest of Europe: Rare Disease Diagnostics Market, By Technology, 2025–2035 (USD Million)
Table 204 Rest of Europe: Rare Disease Diagnostics Market for Sequencing Technologies, By Type, 2025-2035 (USD Million)
Table 205 Rest of Europe: Rare Disease Diagnostics Market for PCR-Based Technologies, By Type, 2025-2035 (USD Million)
Table 206 Rest of Europe: Rare Disease Diagnostics Market, By Sample Type, 2025–2035 (USD Million)
Table 207 Rest of Europe: Rare Disease Diagnostics Market for Blood Sample, By Type, 2025–2035 (USD Million)
Table 208 Rest of Europe: Rare Disease Diagnostics Market, By End User, 2025–2035 (USD Million)
Table 209 Rest of Europe: Rare Disease Diagnostics Market for Diagnostic Laboratories, By Type, 2025–2035 (USD Million)
Table 210 Asia-Pacific: Rare Disease Diagnostics Market, By Country, 2023-2035 (USD Million)
Table 211 Asia-Pacific: Rare Disease Diagnostics Market, By Type, 2023-2035 (USD Million)
Table 212 Asia-Pacific: Rare Disease Diagnostics Market for Genetic Testing, By Type, 2023-2035 (USD Million)
Table 213 Asia-Pacific: Rare Disease Diagnostics Market for Next-Generation Sequencing (NGS), By Type, 2023-2035 (USD Million)
Table 214 Asia-Pacific: Rare Disease Diagnostics Market for Biochemical Testing, By Type, 2023-2035 (USD Million)
Table 215 Asia-Pacific: Rare Disease Diagnostics Market, By Disease Type, 2025-2035 (USD Million)
Table 216 Asia-Pacific: Rare Disease Diagnostics Market, By Technology, 2025–2035 (USD Million)
Table 217 Asia-Pacific: Rare Disease Diagnostics Market for Sequencing Technologies, By Type, 2025-2035 (USD Million)
Table 218 Asia-Pacific: Rare Disease Diagnostics Market for PCR-Based Technologies, By Type, 2025-2035 (USD Million)
Table 219 Asia-Pacific: Rare Disease Diagnostics Market, By Sample Type, 2025–2035 (USD Million)
Table 220 Asia-Pacific: Rare Disease Diagnostics Market for Blood Sample, By Type, 2025–2035 (USD Million)
Table 221 Asia-Pacific: Rare Disease Diagnostics Market, By End User, 2025–2035 (USD Million)
Table 222 Asia-Pacific: Rare Disease Diagnostics Market for Diagnostic Laboratories, By Type, 2025–2035 (USD Million)
Table 223 China: Rare Disease Diagnostics Market, By Type, 2023-2035 (USD Million)
Table 224 China: Rare Disease Diagnostics Market for Genetic Testing, By Type, 2023-2035 (USD Million)
Table 225 China: Rare Disease Diagnostics Market for Next-Generation Sequencing (NGS), By Type, 2023-2035 (USD Million)
Table 226 China: Rare Disease Diagnostics Market for Biochemical Testing, By Type, 2023-2035 (USD Million)
Table 227 China: Rare Disease Diagnostics Market, By Disease Type, 2025-2035 (USD Million)
Table 228 China: Rare Disease Diagnostics Market, By Technology, 2025–2035 (USD Million)
Table 229 China: Rare Disease Diagnostics Market for Sequencing Technologies, By Type, 2025-2035 (USD Million)
Table 230 China: Rare Disease Diagnostics Market for PCR-Based Technologies, By Type, 2025-2035 (USD Million)
Table 231 China: Rare Disease Diagnostics Market, By Sample Type, 2025–2035 (USD Million)
Table 232 China: Rare Disease Diagnostics Market for Blood Sample, By Type, 2025–2035 (USD Million)
Table 233 China: Rare Disease Diagnostics Market, By End User, 2025–2035 (USD Million)
Table 234 China: Rare Disease Diagnostics Market for Diagnostic Laboratories, By Type, 2025–2035 (USD Million)
Table 235 Japan: Rare Disease Diagnostics Market, By Type, 2023-2035 (USD Million)
Table 236 Japan: Rare Disease Diagnostics Market for Genetic Testing, By Type, 2023-2035 (USD Million)
Table 237 Japan: Rare Disease Diagnostics Market for Next-Generation Sequencing (NGS), By Type, 2023-2035 (USD Million)
Table 238 Japan: Rare Disease Diagnostics Market for Biochemical Testing, By Type, 2023-2035 (USD Million)
Table 239 Japan: Rare Disease Diagnostics Market, By Disease Type, 2025-2035 (USD Million)
Table 240 Japan: Rare Disease Diagnostics Market, By Technology, 2025–2035 (USD Million)
Table 241 Japan: Rare Disease Diagnostics Market for Sequencing Technologies, By Type, 2025-2035 (USD Million)
Table 242 Japan: Rare Disease Diagnostics Market for PCR-Based Technologies, By Type, 2025-2035 (USD Million)
Table 243 Japan: Rare Disease Diagnostics Market, By Sample Type, 2025–2035 (USD Million)
Table 244 Japan: Rare Disease Diagnostics Market for Blood Sample, By Type, 2025–2035 (USD Million)
Table 245 Japan: Rare Disease Diagnostics Market, By End User, 2025–2035 (USD Million)
Table 246 Japan: Rare Disease Diagnostics Market for Diagnostic Laboratories, By Type, 2025–2035 (USD Million)
Table 247 India: Rare Disease Diagnostics Market, By Type, 2023-2035 (USD Million)
Table 248 India: Rare Disease Diagnostics Market for Genetic Testing, By Type, 2023-2035 (USD Million)
Table 249 India: Rare Disease Diagnostics Market for Next-Generation Sequencing (NGS), By Type, 2023-2035 (USD Million)
Table 250 India: Rare Disease Diagnostics Market for Biochemical Testing, By Type, 2023-2035 (USD Million)
Table 251 India: Rare Disease Diagnostics Market, By Disease Type, 2025-2035 (USD Million)
Table 252 India: Rare Disease Diagnostics Market, By Technology, 2025–2035 (USD Million)
Table 253 India: Rare Disease Diagnostics Market for Sequencing Technologies, By Type, 2025-2035 (USD Million)
Table 254 India: Rare Disease Diagnostics Market for PCR-Based Technologies, By Type, 2025-2035 (USD Million)
Table 255 India: Rare Disease Diagnostics Market, By Sample Type, 2025–2035 (USD Million)
Table 256 India: Rare Disease Diagnostics Market for Blood Sample, By Type, 2025–2035 (USD Million)
Table 257 India: Rare Disease Diagnostics Market, By End User, 2025–2035 (USD Million)
Table 258 India: Rare Disease Diagnostics Market for Diagnostic Laboratories, By Type, 2025–2035 (USD Million)
Table 259 Australia: Rare Disease Diagnostics Market, By Type, 2023-2035 (USD Million)
Table 260 Australia: Rare Disease Diagnostics Market for Genetic Testing, By Type, 2023-2035 (USD Million)
Table 261 Australia: Rare Disease Diagnostics Market for Next-Generation Sequencing (NGS), By Type, 2023-2035 (USD Million)
Table 262 Australia: Rare Disease Diagnostics Market for Biochemical Testing, By Type, 2023-2035 (USD Million)
Table 263 Australia: Rare Disease Diagnostics Market, By Disease Type, 2025-2035 (USD Million)
Table 264 Australia: Rare Disease Diagnostics Market, By Technology, 2025–2035 (USD Million)
Table 265 Australia: Rare Disease Diagnostics Market for Sequencing Technologies, By Type, 2025-2035 (USD Million)
Table 266 Australia: Rare Disease Diagnostics Market for PCR-Based Technologies, By Type, 2025-2035 (USD Million)
Table 267 Australia: Rare Disease Diagnostics Market, By Sample Type, 2025–2035 (USD Million)
Table 268 Australia: Rare Disease Diagnostics Market for Blood Sample, By Type, 2025–2035 (USD Million)
Table 269 Australia: Rare Disease Diagnostics Market, By End User, 2025–2035 (USD Million)
Table 270 Australia: Rare Disease Diagnostics Market for Diagnostic Laboratories, By Type, 2025–2035 (USD Million)
Table 271 South Korea: Rare Disease Diagnostics Market, By Type, 2023-2035 (USD Million)
Table 272 South Korea: Rare Disease Diagnostics Market for Genetic Testing, By Type, 2023-2035 (USD Million)
Table 273 South Korea: Rare Disease Diagnostics Market for Next-Generation Sequencing (NGS), By Type, 2023-2035 (USD Million)
Table 274 South Korea: Rare Disease Diagnostics Market for Biochemical Testing, By Type, 2023-2035 (USD Million)
Table 275 South Korea: Rare Disease Diagnostics Market, By Disease Type, 2025-2035 (USD Million)
Table 276 South Korea: Rare Disease Diagnostics Market, By Technology, 2025–2035 (USD Million)
Table 277 South Korea: Rare Disease Diagnostics Market for Sequencing Technologies, By Type, 2025-2035 (USD Million)
Table 278 South Korea: Rare Disease Diagnostics Market for PCR-Based Technologies, By Type, 2025-2035 (USD Million)
Table 279 South Korea: Rare Disease Diagnostics Market, By Sample Type, 2025–2035 (USD Million)
Table 280 South Korea: Rare Disease Diagnostics Market for Blood Sample, By Type, 2025–2035 (USD Million)
Table 281 South Korea: Rare Disease Diagnostics Market, By End User, 2025–2035 (USD Million)
Table 282 South Korea: Rare Disease Diagnostics Market for Diagnostic Laboratories, By Type, 2025–2035 (USD Million)
Table 283 Rest of Asia-Pacific: Rare Disease Diagnostics Market, By Type, 2023-2035 (USD Million)
Table 284 Rest of Asia-Pacific: Rare Disease Diagnostics Market for Genetic Testing, By Type, 2023-2035 (USD Million)
Table 285 Rest of Asia-Pacific: Rare Disease Diagnostics Market for Next-Generation Sequencing (NGS), By Type, 2023-2035 (USD Million)
Table 286 Rest of Asia-Pacific: Rare Disease Diagnostics Market for Biochemical Testing, By Type, 2023-2035 (USD Million)
Table 287 Rest of Asia-Pacific: Rare Disease Diagnostics Market, By Disease Type, 2025-2035 (USD Million)
Table 288 Rest of Asia-Pacific: Rare Disease Diagnostics Market, By Technology, 2025–2035 (USD Million)
Table 289 Rest of Asia-Pacific: Rare Disease Diagnostics Market for Sequencing Technologies, By Type, 2025-2035 (USD Million)
Table 290 Rest of Asia-Pacific: Rare Disease Diagnostics Market for PCR-Based Technologies, By Type, 2025-2035 (USD Million)
Table 291 Rest of Asia-Pacific: Rare Disease Diagnostics Market, By Sample Type, 2025–2035 (USD Million)
Table 292 Rest of Asia-Pacific: Rare Disease Diagnostics Market for Blood Sample, By Type, 2025–2035 (USD Million)
Table 293 Rest of Asia-Pacific: Rare Disease Diagnostics Market, By End User, 2025–2035 (USD Million)
Table 294 Rest of Asia-Pacific: Rare Disease Diagnostics Market for Diagnostic Laboratories, By Type, 2025–2035 (USD Million)
Table 295 Latin America: Rare Disease Diagnostics Market, By Country, 2023-2035 (USD Million)
Table 296 Latin America: Rare Disease Diagnostics Market, By Type, 2023-2035 (USD Million)
Table 297 Latin America: Rare Disease Diagnostics Market for Genetic Testing, By Type, 2023-2035 (USD Million)
Table 298 Latin America: Rare Disease Diagnostics Market for Next-Generation Sequencing (NGS), By Type, 2023-2035 (USD Million)
Table 299 Latin America: Rare Disease Diagnostics Market for Biochemical Testing, By Type, 2023-2035 (USD Million)
Table 300 Latin America: Rare Disease Diagnostics Market, By Disease Type, 2025-2035 (USD Million)
Table 301 Latin America: Rare Disease Diagnostics Market, By Technology, 2025–2035 (USD Million)
Table 302 Latin America: Rare Disease Diagnostics Market for Sequencing Technologies, By Type, 2025-2035 (USD Million)
Table 303 Latin America: Rare Disease Diagnostics Market for PCR-Based Technologies, By Type, 2025-2035 (USD Million)
Table 304 Latin America: Rare Disease Diagnostics Market, By Sample Type, 2025–2035 (USD Million)
Table 305 Latin America: Rare Disease Diagnostics Market for Blood Sample, By Type, 2025–2035 (USD Million)
Table 306 Latin America: Rare Disease Diagnostics Market, By End User, 2025–2035 (USD Million)
Table 307 Latin America: Rare Disease Diagnostics Market for Diagnostic Laboratories, By Type, 2025–2035 (USD Million)
Table 308 Brazil: Rare Disease Diagnostics Market, By Type, 2023-2035 (USD Million)
Table 309 Brazil: Rare Disease Diagnostics Market for Genetic Testing, By Type, 2023-2035 (USD Million)
Table 310 Brazil: Rare Disease Diagnostics Market for Next-Generation Sequencing (NGS), By Type, 2023-2035 (USD Million)
Table 311 Brazil: Rare Disease Diagnostics Market for Biochemical Testing, By Type, 2023-2035 (USD Million)
Table 312 Brazil: Rare Disease Diagnostics Market, By Disease Type, 2025-2035 (USD Million)
Table 313 Brazil: Rare Disease Diagnostics Market, By Technology, 2025–2035 (USD Million)
Table 314 Brazil: Rare Disease Diagnostics Market for Sequencing Technologies, By Type, 2025-2035 (USD Million)
Table 315 Brazil: Rare Disease Diagnostics Market for PCR-Based Technologies, By Type, 2025-2035 (USD Million)
Table 316 Brazil: Rare Disease Diagnostics Market, By Sample Type, 2025–2035 (USD Million)
Table 317 Brazil: Rare Disease Diagnostics Market for Blood Sample, By Type, 2025–2035 (USD Million)
Table 318 Brazil: Rare Disease Diagnostics Market, By End User, 2025–2035 (USD Million)
Table 319 Brazil: Rare Disease Diagnostics Market for Diagnostic Laboratories, By Type, 2025–2035 (USD Million)
Table 320 Mexico: Rare Disease Diagnostics Market, By Type, 2023-2035 (USD Million)
Table 321 Mexico: Rare Disease Diagnostics Market for Genetic Testing, By Type, 2023-2035 (USD Million)
Table 322 Mexico: Rare Disease Diagnostics Market for Next-Generation Sequencing (NGS), By Type, 2023-2035 (USD Million)
Table 323 Mexico: Rare Disease Diagnostics Market for Biochemical Testing, By Type, 2023-2035 (USD Million)
Table 324 Mexico: Rare Disease Diagnostics Market, By Disease Type, 2025-2035 (USD Million)
Table 325 Mexico: Rare Disease Diagnostics Market, By Technology, 2025–2035 (USD Million)
Table 326 Mexico: Rare Disease Diagnostics Market for Sequencing Technologies, By Type, 2025-2035 (USD Million)
Table 327 Mexico: Rare Disease Diagnostics Market for PCR-Based Technologies, By Type, 2025-2035 (USD Million)
Table 328 Mexico: Rare Disease Diagnostics Market, By Sample Type, 2025–2035 (USD Million)
Table 329 Mexico: Rare Disease Diagnostics Market for Blood Sample, By Type, 2025–2035 (USD Million)
Table 330 Mexico: Rare Disease Diagnostics Market, By End User, 2025–2035 (USD Million)
Table 331 Mexico: Rare Disease Diagnostics Market for Diagnostic Laboratories, By Type, 2025–2035 (USD Million)
Table 332 Rest of Latin America: Rare Disease Diagnostics Market, By Type, 2023-2035 (USD Million)
Table 333 Rest of Latin America: Rare Disease Diagnostics Market for Genetic Testing, By Type, 2023-2035 (USD Million)
Table 334 Rest of Latin America: Rare Disease Diagnostics Market for Next-Generation Sequencing (NGS), By Type, 2023-2035 (USD Million)
Table 335 Rest of Latin America: Rare Disease Diagnostics Market for Biochemical Testing, By Type, 2023-2035 (USD Million)
Table 336 Rest of Latin America: Rare Disease Diagnostics Market, By Disease Type, 2025-2035 (USD Million)
Table 337 Rest of Latin America: Rare Disease Diagnostics Market, By Technology, 2025–2035 (USD Million)
Table 338 Rest of Latin America: Rare Disease Diagnostics Market for Sequencing Technologies, By Type, 2025-2035 (USD Million)
Table 339 Rest of Latin America: Rare Disease Diagnostics Market for PCR-Based Technologies, By Type, 2025-2035 (USD Million)
Table 340 Rest of Latin America: Rare Disease Diagnostics Market, By Sample Type, 2025–2035 (USD Million)
Table 341 Rest of Latin America: Rare Disease Diagnostics Market for Blood Sample, By Type, 2025–2035 (USD Million)
Table 342 Rest of Latin America: Rare Disease Diagnostics Market, By End User, 2025–2035 (USD Million)
Table 343 Rest of Latin America: Rare Disease Diagnostics Market for Diagnostic Laboratories, By Type, 2025–2035 (USD Million)
Table 344 Middle East & Africa: Rare Disease Diagnostics Market, By Country, 2023-2035 (USD Million)
Table 345 Middle East & Africa: Rare Disease Diagnostics Market, By Type, 2023-2035 (USD Million)
Table 346 Middle East & Africa: Rare Disease Diagnostics Market for Genetic Testing, By Type, 2023-2035 (USD Million)
Table 347 Middle East & Africa: Rare Disease Diagnostics Market for Next-Generation Sequencing (NGS), By Type, 2023-2035 (USD Million)
Table 348 Middle East & Africa: Rare Disease Diagnostics Market for Biochemical Testing, By Type, 2023-2035 (USD Million)
Table 349 Middle East & Africa: Rare Disease Diagnostics Market, By Disease Type, 2025-2035 (USD Million)
Table 350 Middle East & Africa: Rare Disease Diagnostics Market, By Technology, 2025–2035 (USD Million)
Table 351 Middle East & Africa: Rare Disease Diagnostics Market for Sequencing Technologies, By Type, 2025-2035 (USD Million)
Table 352 Middle East & Africa: Rare Disease Diagnostics Market for PCR-Based Technologies, By Type, 2025-2035 (USD Million)
Table 353 Middle East & Africa: Rare Disease Diagnostics Market, By Sample Type, 2025–2035 (USD Million)
Table 354 Middle East & Africa: Rare Disease Diagnostics Market for Blood Sample, By Type, 2025–2035 (USD Million)
Table 355 Middle East & Africa: Rare Disease Diagnostics Market, By End User, 2025–2035 (USD Million)
Table 356 Middle East & Africa: Rare Disease Diagnostics Market for Diagnostic Laboratories, By Type, 2025–2035 (USD Million)
Table 357 Saudi Arabia: Rare Disease Diagnostics Market, By Type, 2023-2035 (USD Million)
Table 358 Saudi Arabia: Rare Disease Diagnostics Market for Genetic Testing, By Type, 2023-2035 (USD Million)
Table 359 Saudi Arabia: Rare Disease Diagnostics Market for Next-Generation Sequencing (NGS), By Type, 2023-2035 (USD Million)
Table 360 Saudi Arabia: Rare Disease Diagnostics Market for Biochemical Testing, By Type, 2023-2035 (USD Million)
Table 361 Saudi Arabia: Rare Disease Diagnostics Market, By Disease Type, 2025-2035 (USD Million)
Table 362 Saudi Arabia: Rare Disease Diagnostics Market, By Technology, 2025–2035 (USD Million)
Table 363 Saudi Arabia: Rare Disease Diagnostics Market for Sequencing Technologies, By Type, 2025-2035 (USD Million)
Table 364 Saudi Arabia: Rare Disease Diagnostics Market for PCR-Based Technologies, By Type, 2025-2035 (USD Million)
Table 365 Saudi Arabia: Rare Disease Diagnostics Market, By Sample Type, 2025–2035 (USD Million)
Table 366 Saudi Arabia: Rare Disease Diagnostics Market for Blood Sample, By Type, 2025–2035 (USD Million)
Table 367 Saudi Arabia: Rare Disease Diagnostics Market, By End User, 2025–2035 (USD Million)
Table 368 Saudi Arabia: Rare Disease Diagnostics Market for Diagnostic Laboratories, By Type, 2025–2035 (USD Million)
Table 369 UAE: Rare Disease Diagnostics Market, By Type, 2023-2035 (USD Million)
Table 370 UAE: Rare Disease Diagnostics Market for Genetic Testing, By Type, 2023-2035 (USD Million)
Table 371 UAE: Rare Disease Diagnostics Market for Next-Generation Sequencing (NGS), By Type, 2023-2035 (USD Million)
Table 372 UAE: Rare Disease Diagnostics Market for Biochemical Testing, By Type, 2023-2035 (USD Million)
Table 373 UAE: Rare Disease Diagnostics Market, By Disease Type, 2025-2035 (USD Million)
Table 374 UAE: Rare Disease Diagnostics Market, By Technology, 2025–2035 (USD Million)
Table 375 UAE: Rare Disease Diagnostics Market for Sequencing Technologies, By Type, 2025-2035 (USD Million)
Table 376 UAE: Rare Disease Diagnostics Market for PCR-Based Technologies, By Type, 2025-2035 (USD Million)
Table 377 UAE: Rare Disease Diagnostics Market, By Sample Type, 2025–2035 (USD Million)
Table 378 UAE: Rare Disease Diagnostics Market for Blood Sample, By Type, 2025–2035 (USD Million)
Table 379 UAE: Rare Disease Diagnostics Market, By End User, 2025–2035 (USD Million)
Table 380 UAE: Rare Disease Diagnostics Market for Diagnostic Laboratories, By Type, 2025–2035 (USD Million)
Table 381 South Africa: Rare Disease Diagnostics Market, By Type, 2023-2035 (USD Million)
Table 382 South Africa: Rare Disease Diagnostics Market for Genetic Testing, By Type, 2023-2035 (USD Million)
Table 383 South Africa: Rare Disease Diagnostics Market for Next-Generation Sequencing (NGS), By Type, 2023-2035 (USD Million)
Table 384 South Africa: Rare Disease Diagnostics Market for Biochemical Testing, By Type, 2023-2035 (USD Million)
Table 385 South Africa: Rare Disease Diagnostics Market, By Disease Type, 2025-2035 (USD Million)
Table 386 South Africa: Rare Disease Diagnostics Market, By Technology, 2025–2035 (USD Million)
Table 387 South Africa: Rare Disease Diagnostics Market for Sequencing Technologies, By Type, 2025-2035 (USD Million)
Table 388 South Africa: Rare Disease Diagnostics Market for PCR-Based Technologies, By Type, 2025-2035 (USD Million)
Table 389 South Africa: Rare Disease Diagnostics Market, By Sample Type, 2025–2035 (USD Million)
Table 390 South Africa: Rare Disease Diagnostics Market for Blood Sample, By Type, 2025–2035 (USD Million)
Table 391 South Africa: Rare Disease Diagnostics Market, By End User, 2025–2035 (USD Million)
Table 392 South Africa: Rare Disease Diagnostics Market for Diagnostic Laboratories, By Type, 2025–2035 (USD Million)
Table 393 Rest of Middle East & Africa: Rare Disease Diagnostics Market, By Type, 2023-2035 (USD Million)
Table 394 Rest of Middle East & Africa: Rare Disease Diagnostics Market for Genetic Testing, By Type, 2023-2035 (USD Million)
Table 395 Rest of Middle East & Africa: Rare Disease Diagnostics Market for Next-Generation Sequencing (NGS), By Type, 2023-2035 (USD Million)
Table 396 Rest of Middle East & Africa: Rare Disease Diagnostics Market for Biochemical Testing, By Type, 2023-2035 (USD Million)
Table 397 Rest of Middle East & Africa: Rare Disease Diagnostics Market, By Disease Type, 2025-2035 (USD Million)
Table 398 Rest of Middle East & Africa: Rare Disease Diagnostics Market, By Technology, 2025–2035 (USD Million)
Table 399 Rest of Middle East & Africa: Rare Disease Diagnostics Market for Sequencing Technologies, By Type, 2025-2035 (USD Million)
Table 400 Rest of Middle East & Africa: Rare Disease Diagnostics Market for PCR-Based Technologies, By Type, 2025-2035 (USD Million)
Table 401 Rest of Middle East & Africa: Rare Disease Diagnostics Market, By Sample Type, 2025–2035 (USD Million)
Table 402 Rest of Middle East & Africa: Rare Disease Diagnostics Market for Blood Sample, By Type, 2025–2035 (USD Million)
Table 403 Rest of Middle East & Africa: Rare Disease Diagnostics Market, By End User, 2025–2035 (USD Million)
Table 404 Rest of Middle East & Africa: Rare Disease Diagnostics Market for Diagnostic Laboratories, By Type, 2025–2035 (USD Million)
Table 405 Recent Developments, By Company, 2023-2025
List of Figures
Figure 1 Research Process
Figure 2 Key Secondary Sources
Figure 3 Primary Research Techniques
Figure 4 Key Executives Interviewed
Figure 5 Breakdown of Primary Interviews (Supply-Side & Demand-Side)
Figure 6 Market Sizing and Growth Forecast Approach
Figure 7 Global Rare Disease Diagnostics Market, By Test Type, 2025 Vs. 2035 (USD Million)
Figure 8 Global Rare Disease Diagnostics Market, By Disease, 2025 Vs. 2035 (USD Million)
Figure 9 Global Rare Disease Diagnostics Market, By Technology, 2025 Vs. 2035 (USD Million)
Figure 10 Global Rare Disease Diagnostics Market, By Sample Type, 2025 Vs. 2035 (USD Million)
Figure 11 Global Rare Disease Diagnostics Market, By End User, 2025 Vs. 2035 (USD Million)
Figure 12 Rare Disease Diagnostics Market, By Geography
Figure 13 Factors Affecting Market Growth
Figure 14 Value Chain Analysis
Figure 15 Global Rare Disease Diagnostics Market, By Type, 2025 Vs. 2035 (USD Million)
Figure 16 Global Rare Disease Diagnostics Market for Genetic Testing, By Type, 2023 Vs 2035 (USD Million)
Figure 17 Global Rare Disease Diagnostics Market for Next-Generation Sequencing (NGS), By Type, 2023 Vs 2035 (USD Million)
Figure 18 Global Rare Disease Diagnostics Market for Biochemical Testing, By Type, 2023 Vs 2035 (USD Million)
Figure 19 Global Rare Disease Diagnostics Market, By Disease Type, 2025 Vs. 2035 (USD Million)
Figure 20 Global Rare Disease Diagnostics Market, By Technology, 2025 Vs. 2035 (USD Million)
Figure 21 Global Rare Disease Diagnostics Market for Sequencing Technologies, By Type, 2025 Vs. 2035 (USD Million)
Figure 22 Global Rare Disease Diagnostics Market for PCR-Based Technologies, By Type, 2025 Vs. 2035 (USD Million)
Figure 23 Global Rare Disease Diagnostics Market, By Sample Type, 2025 Vs. 2035 (USD Million)
Figure 24 Global Rare Disease Diagnostics Market for Blood Sample, By Type, 2025 Vs. 2035 (USD Million)
Figure 25 Global Rare Disease Diagnostics Market, By End User, 2025 Vs. 2035 (USD Million)
Figure 26 Global Rare Disease Diagnostics Market for Diagnostic Laboratories, By Type, 2025 Vs. 2035 (USD Million)
Figure 27 Global Rare Disease Diagnostics Market, By Region, 2025 Vs. 2035 (USD Million)
Figure 28 North America: Rare Disease Diagnostics Market Snapshot
Figure 29 Europe: Rare Disease Diagnostics Market Snapshot
Figure 30 Asia-Pacific: Rare Disease Diagnostics Market Snapshot
Figure 31 Latin America: Rare Disease Diagnostics Market Snapshot
Figure 32 Middle East and Africa: Rare Disease Diagnostics Market Snapshot
Figure 33 Key Growth Strategies Adopted By Leading Players, 2023-2025
Figure 34 Rare Disease Diagnostics: Competitive Benchmarking, By Region
Figure 35 Competitive Dashboard: Rare Disease Diagnostics Market
Figure 36 Rare Disease Diagnostics Market Position Analysis, 2024
Figure 37 Illumina Inc.: Financial Overview (2024)
Figure 38 Thermo Fisher Scientific, Inc.: Financial Overview (2024)
Figure 39 Agilent Technologies Inc.: Financial Overview (2024)
Figure 40 Qiagen N.V.: Financial Overview (2024)
Figure 41 Bio-Rad Laboratories Inc.: Financial Overview (2024)
Figure 42 F. Hoffmann-La Roche Ltd.: Financial Overview (2024)
Figure 43 Quest Diagnostics Incorporated: Financial Overview (2024)
Figure 44 OPKO Health, Inc.: Financial Overview (2024)
Figure 45 Fulgent Genetics, Inc.: Financial Overview (2024)
Figure 46 GeneDx, LLC: Financial Overview (2024)
Figure 47 Eurofins Scientific: Financial Overview (2024)


Published Date: Jan-2025
Published Date: Jan-2025
Published Date: Jan-2025
Subscribe to get the latest industry updates