Resources
About Us
This report examines the global peer-to-peer energy trading platforms market, exploring how solution providers are responding to the increasing adoption of distributed energy resources, the expanding focus on energy democratization, and shifting energy trading demands across different regions. It offers a strategic evaluation of market dynamics, forecasts growth through 2035, and assesses competitive positioning at both global and regional/country levels.
Key Market Drivers & Trends and Insights
Click here to: Get Free Sample Pages of this Report
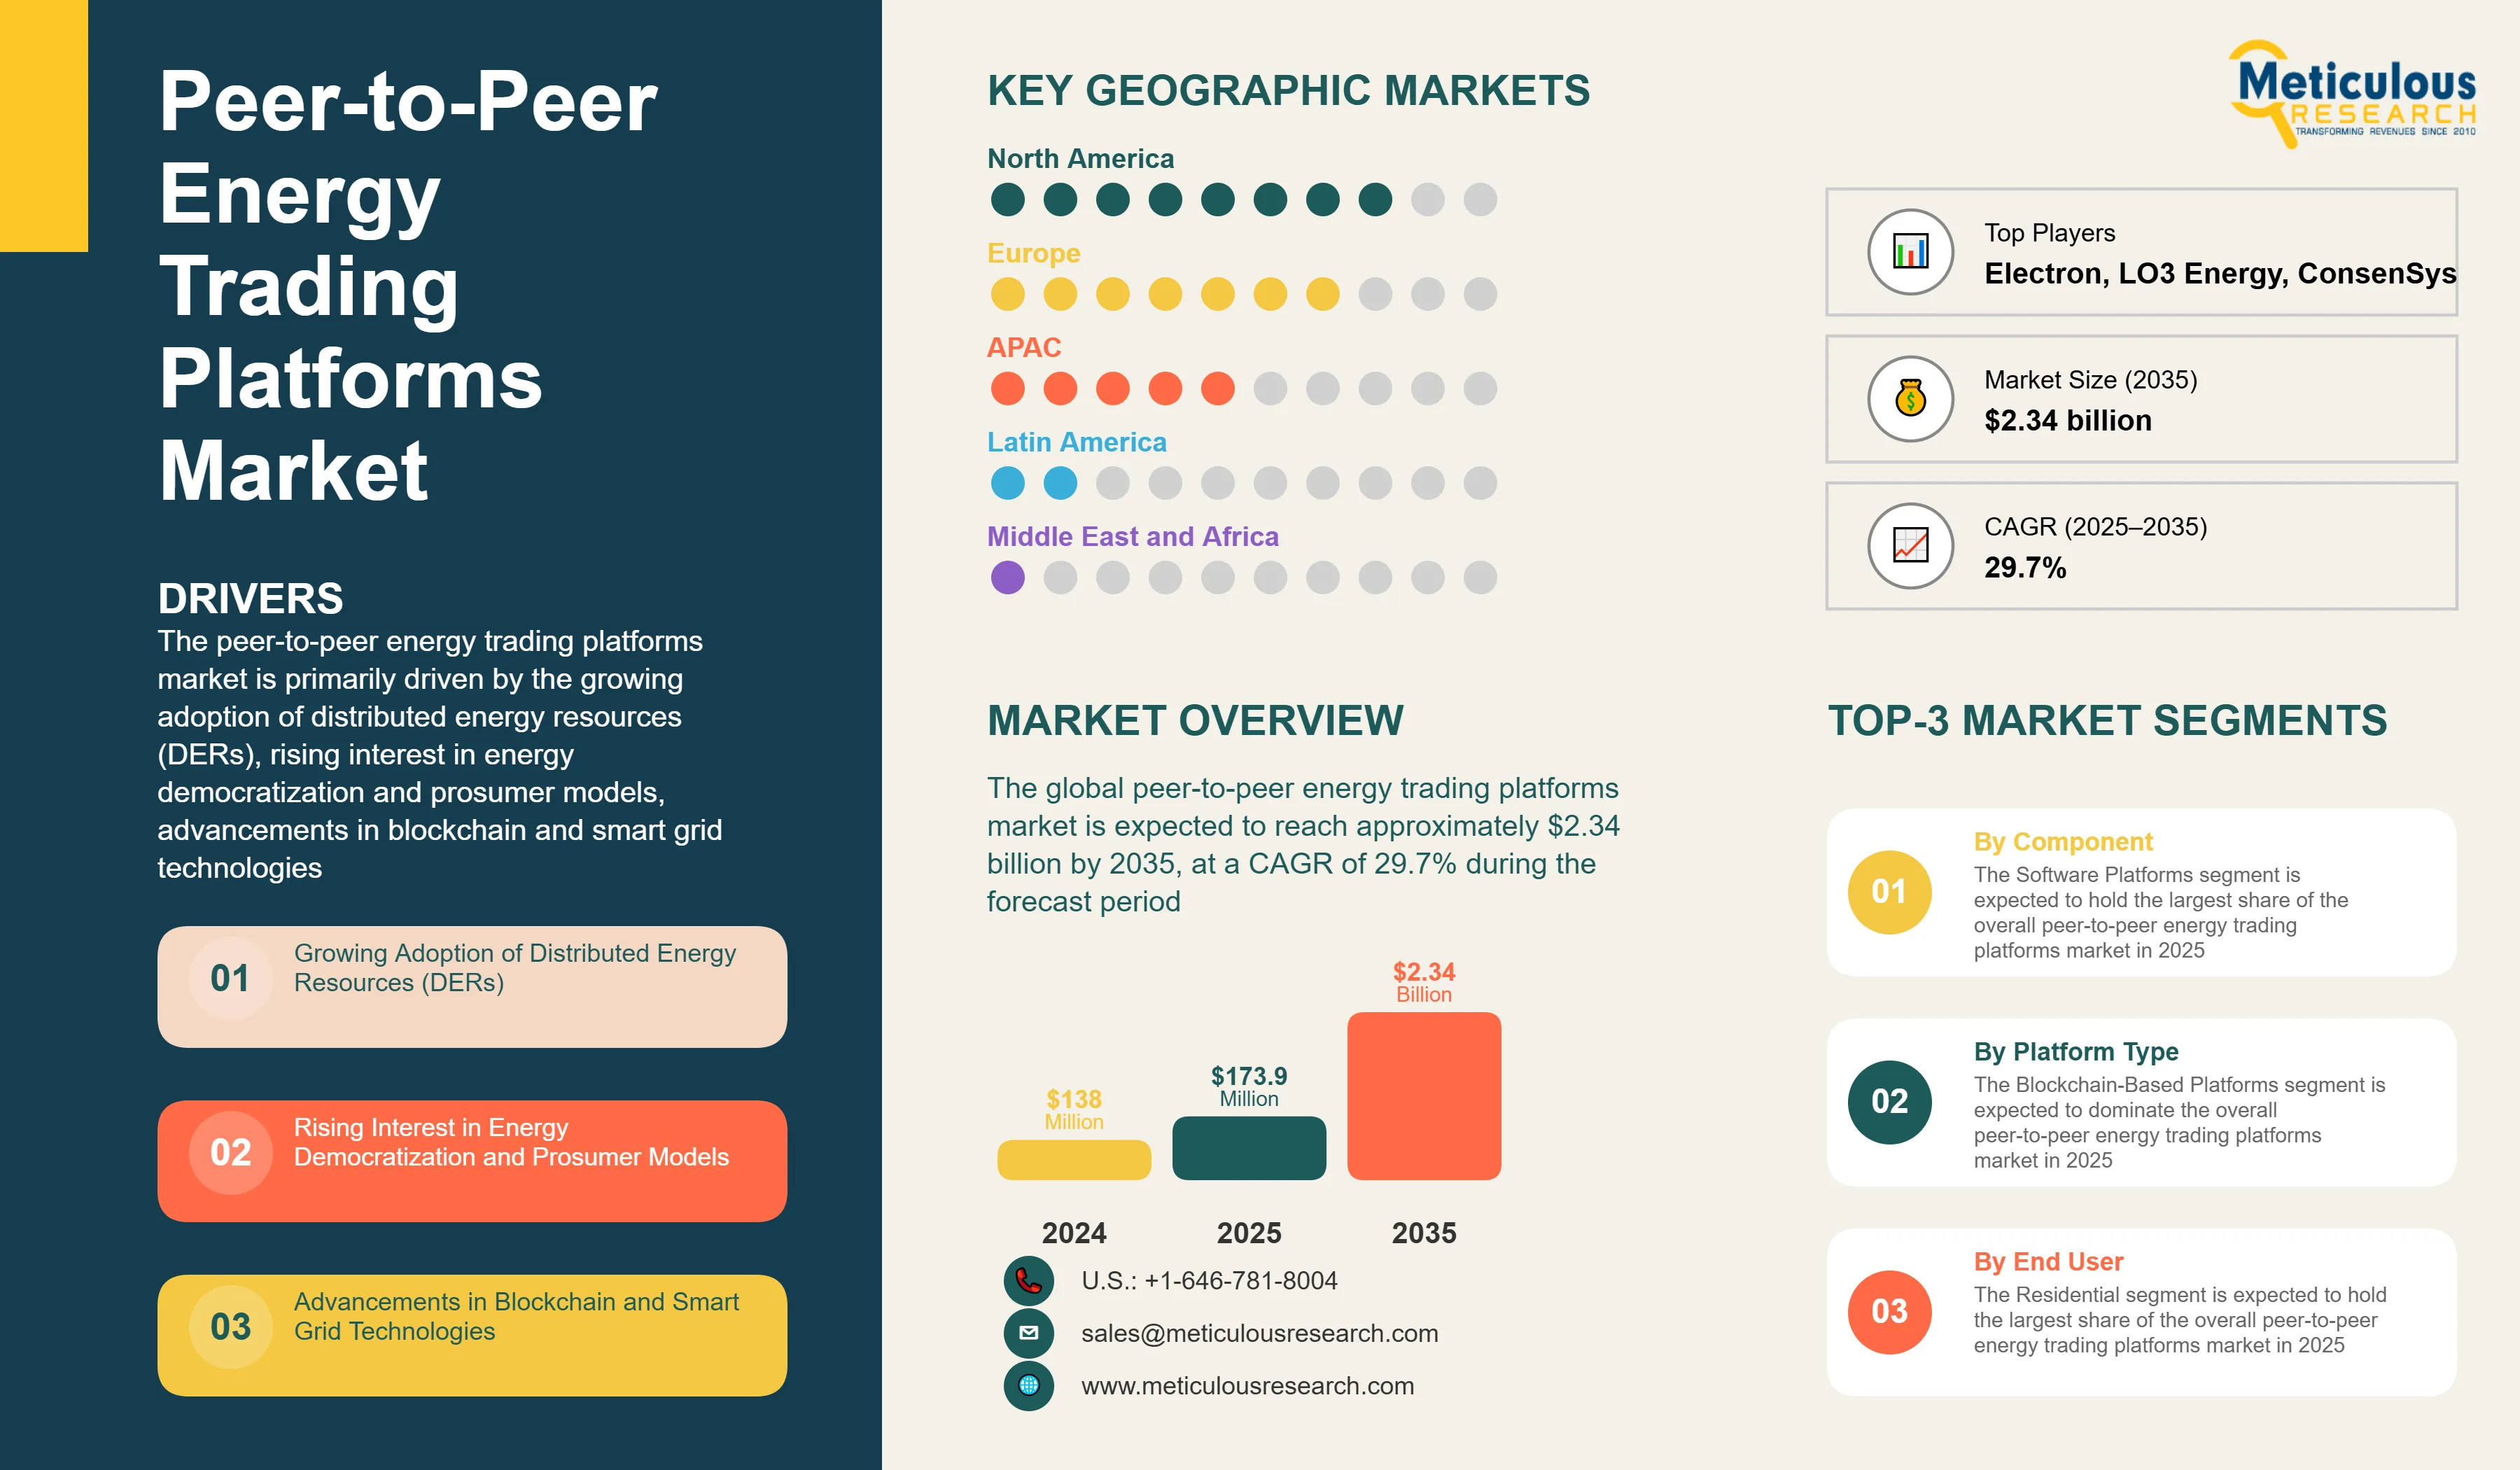
The peer-to-peer energy trading platforms market is primarily driven by the growing adoption of distributed energy resources (DERs), rising interest in energy democratization and prosumer models, advancements in blockchain and smart grid technologies, and supportive regulatory frameworks for decentralized energy. The integration with virtual power plants (VPPs) and focus on grid resilience and energy independence are reshaping the industry, while tokenization of energy assets and community-based energy trading projects are gaining significant traction. Additionally, microgrid-as-a-service business models and integration with smart home and IoT ecosystems are further driving market growth, especially in developed markets with advanced energy infrastructure.
Key Challenges
Despite its substantial growth potential, the overall peer-to-peer energy trading platforms market encounters several challenges including regulatory uncertainties and policy barriers, grid integration challenges, high initial implementation costs, and cybersecurity and data privacy concerns. Additionally, technology scalability issues, user adoption and behavioral change requirements, and market liquidity and trading volume concerns present significant obstacles, potentially slowing down market adoption in different regions across the globe.
Growth Opportunities
The peer-to-peer energy trading platforms market offers several high-growth opportunities. Integration with virtual power plants (VPPs) is driving innovation across multiple segments. Another major opportunity lies in expansion into emerging markets with growing renewable energy adoption. Additionally, combination with electric vehicle charging infrastructure and integration of AI and machine learning for trading optimization are creating new revenue streams for solution providers, as organizations increasingly seek efficient alternatives to traditional centralized energy trading methods.
Market Segmentation Highlights
By Component
The Software Platforms segment is expected to hold the largest share of the overall peer-to-peer energy trading platforms market in 2025, due to its critical role in facilitating energy transactions and growing adoption of digital trading solutions across the globe. The adoption of Hardware Infrastructure is increased particularly in regions with advanced smart grid deployment. However, the Services segment is expected to grow at the fastest CAGR during the forecast period, driven by increasing demand for consulting, implementation, and maintenance services, technological complexity, and the push for operational efficiency in energy trading operations.
By Platform Type
The Blockchain-Based Platforms segment is expected to dominate the overall peer-to-peer energy trading platforms market in 2025, primarily due to the high transparency and security requirements in energy trading globally. However, the Hybrid Solutions segment is expected to grow at the fastest CAGR through the forecast period, driven by increasing demand for flexible platform architectures, focus on scalability and performance optimization, and the need for integrated trading capabilities.
By Energy Type
The Solar segment is expected to hold the largest share of the overall peer-to-peer energy trading platforms market in 2025, due to the widespread adoption of distributed solar installations and increasing number of prosumers globally. However, the Storage-Based Trading segment is expected to experience the fastest growth rate during the forecast period, driven by the increasing deployment of energy storage systems, focus on grid stability and energy arbitrage, and adoption of advanced battery technologies for energy trading purposes.
By End User
The Residential segment is expected to hold the largest share of the overall peer-to-peer energy trading platforms market in 2025, due to the high number of residential prosumers globally and increasing adoption of rooftop solar and home energy management systems. However, the Microgrid Communities segment is expected to experience the fastest growth rate during the forecast period, driven by the increasing focus on energy resilience, community-based energy projects, and adoption of localized energy trading solutions for collective energy management.
By Geography
North America is expected to hold the largest share of the global peer-to-peer energy trading platforms market in 2025, driven by advanced smart grid infrastructure, high adoption of distributed energy resources, and supportive regulatory frameworks for energy innovation. Additionally, significant investments in renewable energy and favorable policies for prosumer participation contribute significantly to market dominance. Europe follows as the second-largest market, bolstered by strong renewable energy policies and increasing focus on energy independence and sustainability. However, Asia-Pacific is witnessing the fastest growth rate during the forecast period, primarily driven by expanding renewable energy capacity, increasing energy demand, government initiatives for smart grid development, and the advantages peer-to-peer energy trading platforms offer in optimizing distributed energy resource utilization.
Competitive Landscape
The global peer-to-peer energy trading platforms market is characterized by a diverse competitive environment, comprising established energy technology firms, blockchain experts, smart grid solution providers, and innovative startups, each adopting different strategies for implementing peer-to-peer energy trading.
The broader landscape of solution providers is segmented into industry leaders, market differentiators, pioneers, and emerging players, with each category leveraging unique approaches to sustain their competitive edge. Leading companies are prioritizing integrated solutions that blend advanced blockchain and AI technologies with comprehensive energy management services, while also navigating region-specific regulatory and infrastructure challenges
The key players operating in the global peer-to-peer energy trading platforms market are Power Ledger Ltd, LO3 Energy Inc., ConsenSys AG, Energy Web Foundation, Electron Ltd, Next Kraftwerke GmbH, Enel X Global Retail S.r.l., Piclo Ltd, Tibber AS, SunContract d.o.o., Ponton GmbH, Grid Singularity GmbH, Powerpeers B.V., Voltus Inc., and Lition Energy GmbH among others.
|
Particulars |
Details |
|
Number of Pages |
167 |
|
Format |
PDF & Excel |
|
Forecast Period |
2025–2035 |
|
Base Year |
2024 |
|
CAGR (Value) |
29.7% |
|
Market Size (Value) in 2025 |
USD 173.9 Million |
|
Market Size (Value) in 2035 |
USD 2.34 Billion |
|
Segments Covered |
Market Assessment By Component
By Platform Type
By Energy Type
By End User
|
|
Countries Covered |
North America (U.S., Canada), Europe (Germany, U.K., France, Netherlands, Sweden, Italy, Rest of Europe), Asia-Pacific (Japan, Australia, Singapore, India, China, South Korea, Rest of Asia-Pacific), Latin America (Brazil, Chile, Mexico, Rest of Latin America), Middle East & Africa (UAE, Saudi Arabia, South Africa, Israel, Rest of Middle East & Africa) |
|
Key Companies |
Power Ledger Ltd, LO3 Energy Inc., ConsenSys AG, Energy Web Foundation, Electron Ltd, Next Kraftwerke GmbH, Enel X Global Retail S.r.l., Piclo Ltd, Tibber AS, SunContract d.o.o., Ponton GmbH, Grid Singularity GmbH, Powerpeers B.V., Voltus Inc., Lition Energy GmbH |
The global peer-to-peer energy trading platforms market was valued at $138 million in 2024. This market is expected to reach approximately $2.34 billion by 2035, growing from an estimated $173.9 million in 2025, at a CAGR of 29.7% during the forecast period of 2025–2035.
The global peer-to-peer energy trading platforms market is expected to grow at a CAGR of 29.7% during the forecast period of 2025–2035.
The global peer-to-peer energy trading platforms market is expected to reach approximately $2.34 billion by 2035, growing from an estimated $173.9 million in 2025, at a CAGR of 29.7% during the forecast period of 2025–2035.
The key companies operating in this market include Power Ledger Ltd, LO3 Energy Inc., ConsenSys AG, Energy Web Foundation, Electron Ltd, Next Kraftwerke GmbH, Enel X Global Retail S.r.l., Piclo Ltd, Tibber AS, SunContract d.o.o., and others.
Major trends shaping the market include tokenization of energy assets, community-based energy trading projects, microgrid-as-a-service business models, and integration with smart home and IoT ecosystems.
• In 2025, the Software Platforms segment is expected to dominate the overall peer-to-peer energy trading platforms market by component
• Based on platform type, the Blockchain-Based Platforms segment is expected to hold the largest share of the overall peer-to-peer energy trading platforms market in 2025
• Based on energy type, the Solar segment is expected to hold the largest share of the overall peer-to-peer energy trading platforms market in 2025
• Based on end user, the Residential segment is expected to hold the largest share of the global peer-to-peer energy trading platforms market in 2025
North America is expected to hold the largest share of the global peer-to-peer energy trading platforms market in 2025, driven by advanced smart grid infrastructure, high adoption of distributed energy resources, and supportive regulatory frameworks for energy innovation. Asia-Pacific is witnessing the fastest growth rate during the forecast period.
The growth of this market is driven by growing adoption of distributed energy resources (DERs), rising interest in energy democratization and prosumer models, advancements in blockchain and smart grid technologies, and supportive regulatory frameworks for decentralized energy.
1. Market Definition & Scope
1.1. Market Definition
1.2. Market Ecosystem
1.3. Currency & Pricing
1.4. Key Stakeholders
2. Research Methodology
2.1. Research Approach
2.2. Process of Data Collection and Validation
2.2.1. Secondary Research
2.2.2. Primary Research/Interviews with Key Opinion Leaders
2.3. Market Sizing and Forecast
2.3.1. Market Size Estimation Approach
2.3.2. Bottom-up Approach
2.3.3. Top-down Approach
2.3.4. Growth Forecast Approach
2.3.5. Assumptions for the Study
3. Executive Summary
3.1. Market Overview
3.2. Segmental Analysis
3.2.1. Peer-to-Peer Energy Trading Platforms Market, by Component
3.2.2. Peer-to-Peer Energy Trading Platforms Market, by Platform Type
3.2.3. Peer-to-Peer Energy Trading Platforms Market, by Energy Type
3.2.4. Peer-to-Peer Energy Trading Platforms Market, by End User
3.2.5. Peer-to-Peer Energy Trading Platforms Market, by Geography
3.3. Competitive Landscape
4. Market Insights
4.1. Market Overview
4.2. Factors Affecting Market Growth
4.2.1. Drivers
4.2.1.1. Growing Adoption of Distributed Energy Resources (DERs)
4.2.1.2. Rising Interest in Energy Democratization and Prosumer Models
4.2.1.3. Advancements in Blockchain and Smart Grid Technologies
4.2.1.4. Supportive Regulatory Frameworks for Decentralized Energy
4.2.1.5. Increasing Focus on Grid Resilience and Energy Independence
4.2.2. Restraints
4.2.2.1. Regulatory Uncertainties and Policy Barriers
4.2.2.2. Grid Integration Challenges
4.2.2.3. High Initial Implementation Costs
4.2.2.4. Cybersecurity and Data Privacy Concerns
4.2.3. Opportunities
4.2.3.1. Integration with Virtual Power Plants (VPPs)
4.2.3.2. Expansion into Emerging Markets
4.2.3.3. Combination with Electric Vehicle Charging Infrastructure
4.2.3.4. Integration of AI and Machine Learning for Trading Optimization
4.2.4. Trends
4.2.4.1. Tokenization of Energy Assets
4.2.4.2. Community-Based Energy Trading Projects
4.2.4.3. Microgrid-as-a-Service Business Models
4.2.4.4. Integration with Smart Home and IoT Ecosystems
4.2.5. Challenges
4.2.5.1. Technology Scalability Issues
4.2.5.2. User Adoption and Behavioral Change Requirements
4.2.5.3. Market Liquidity and Trading Volume Concerns
4.3. Porter's Five Forces Analysis
4.3.1. Bargaining Power of Suppliers
4.3.2. Bargaining Power of Buyers
4.3.3. Threat of Substitutes
4.3.4. Threat of New Entrants
4.3.5. Degree of Competition
4.4. Impact of Sustainability on the Peer-to-Peer Energy Trading Platforms Market
4.4.1. Carbon Reduction Potential
4.4.2. Renewable Energy Integration
4.4.3. Energy Equity and Access
4.4.4. Smart Grid Resilience Enhancement
5. Peer-to-Peer Energy Trading Platforms Market Assessment—by Component
5.1. Software Platforms
5.2. Hardware Infrastructure
5.3. Services
5.4. Other Components
6. Peer-to-Peer Energy Trading Platforms Market Assessment—by Platform Type
6.1. Blockchain-Based Platforms
6.2. Non-Blockchain Platforms
6.3. Hybrid Solutions
6.4. Exchange-Based Platforms
7. Peer-to-Peer Energy Trading Platforms Market Assessment—by Energy Type
7.1. Solar
7.2. Wind
7.3. Bioenergy
7.4. Combined Heat and Power (CHP)
7.5. Storage-Based Trading
8. Peer-to-Peer Energy Trading Platforms Market Assessment—by End User
8.1. Residential
8.2. Commercial
8.3. Industrial
8.4. Microgrid Communities
8.5. Utilities and Energy Suppliers
9. Peer-to-Peer Energy Trading Platforms Market Assessment—by Geography
9.1. Overview
9.2. North America
9.2.1. U.S.
9.2.2. Canada
9.3. Europe
9.3.1. Germany
9.3.2. U.K.
9.3.3. France
9.3.4. Netherlands
9.3.5. Sweden
9.3.6. Italy
9.3.7. Rest of Europe (RoE)
9.4. Asia-Pacific
9.4.1. Japan
9.4.2. Australia
9.4.3. Singapore
9.4.4. India
9.4.5. China
9.4.6. South Korea
9.4.7. Rest of Asia-Pacific (RoAPAC)
9.5. Latin America
9.5.1. Brazil
9.5.2. Chile
9.5.3. Mexico
9.5.4. Rest of Latin America (RoLATAM)
9.6. Middle East & Africa
9.6.1. United Arab Emirates (UAE)
9.6.2. Saudi Arabia
9.6.3. South Africa
9.6.4. Israel
9.6.5. Rest of Middle East & Africa (RoMEA)
10. Competitive Landscape
10.1. Overview
10.2. Key Growth Strategies
10.3. Competitive Benchmarking
10.4. Competitive Dashboard
10.4.1. Industry Leaders
10.4.2. Market Differentiators
10.4.3. Vanguards
10.4.4. Emerging Players
10.5. Market Share/Ranking Analysis, by Key Players, 2024
11. Company Profiles (Business Overview, Financial Overview, Product Portfolio, Strategic Developments, and SWOT Analysis)
11.1. Power Ledger Ltd
11.2. LO3 Energy Inc.
11.3. ConsenSys AG
11.4. Energy Web Foundation
11.5. Electron Ltd
11.6. Next Kraftwerke GmbH
11.7. Enel X Global Retail S.r.l.
11.8. Piclo Ltd
11.9. Tibber AS
11.10. SunContract d.o.o.
11.11. Ponton GmbH
11.12. Grid Singularity GmbH
11.13. Powerpeers B.V.
11.14. Voltus Inc.
11.15. Lition Energy GmbH
12. Appendix
12.1. Available Customizations
12.2. Related Reports
List of Tables
Global Market Overview
Table 1: Global Peer-to-Peer Energy Trading Platforms Market, 2023–2035 (USD Million)
Table 2: Global Peer-to-Peer Energy Trading Platforms Market, by Component, 2023–2035 (USD Million)
Table 3: Global Peer-to-Peer Energy Trading Platforms Market, by Platform Type, 2023–2035 (USD Million)
Table 4: Global Peer-to-Peer Energy Trading Platforms Market, by Energy Type, 2023–2035 (USD Million)
Table 5: Global Peer-to-Peer Energy Trading Platforms Market, by End User, 2023–2035 (USD Million)
Table 6: Global Peer-to-Peer Energy Trading Platforms Market, by Region/Country, 2023–2035 (USD Million)
Component Segment
Table 7: Global Peer-to-Peer Energy Trading Software Platforms Market, by Region/Country, 2023–2035 (USD Million)
Table 8: Global Peer-to-Peer Energy Trading Hardware Infrastructure Market, by Region/Country, 2023–2035 (USD Million)
Table 9: Global Peer-to-Peer Energy Trading Services Market, by Region/Country, 2023–2035 (USD Million)
Table 10: Other Peer-to-Peer Energy Trading Components Market, by Region/Country, 2023–2035 (USD Million)
Platform Type Segment
Table 11: Global Blockchain-Based Peer-to-Peer Energy Trading Platforms Market, by Region/Country, 2023–2035 (USD Million)
Table 12: Global Non-Blockchain Peer-to-Peer Energy Trading Platforms Market, by Region/Country, 2023–2035 (USD Million)
Table 13: Global Hybrid Peer-to-Peer Energy Trading Solutions Market, by Region/Country, 2023–2035 (USD Million)
Table 14: Global Exchange-Based Peer-to-Peer Energy Trading Platforms Market, by Region/Country, 2023–2035 (USD Million)
Energy Type Segment
Table 15: Global Peer-to-Peer Energy Trading Platforms Market for Solar, by Region/Country, 2023–2035 (USD Million)
Table 16: Global Peer-to-Peer Energy Trading Platforms Market for Wind, by Region/Country, 2023–2035 (USD Million)
Table 17: Global Peer-to-Peer Energy Trading Platforms Market for Bioenergy, by Region/Country, 2023–2035 (USD Million)
Table 18: Global Peer-to-Peer Energy Trading Platforms Market for Combined Heat and Power (CHP), by Region/Country, 2023–2035 (USD Million)
Table 19: Global Peer-to-Peer Energy Trading Platforms Market for Storage-Based Trading, by Region/Country, 2023–2035 (USD Million)
End User Segment
Table 20: Global Peer-to-Peer Energy Trading Platforms Market for Residential End Users, by Region/Country, 2023–2035 (USD Million)
Table 21: Global Peer-to-Peer Energy Trading Platforms Market for Commercial End Users, by Region/Country, 2023–2035 (USD Million)
Table 22: Global Peer-to-Peer Energy Trading Platforms Market for Industrial End Users, by Region/Country, 2023–2035 (USD Million)
Table 23: Global Peer-to-Peer Energy Trading Platforms Market for Microgrid Communities, by Region/Country, 2023–2035 (USD Million)
Table 24: Global Peer-to-Peer Energy Trading Platforms Market for Utilities and Energy Suppliers, by Region/Country, 2023–2035 (USD Million)
North America Market
Table 25: North America Peer-to-Peer Energy Trading Platforms Market, 2023–2035 (USD Million)
Table 26: North America Peer-to-Peer Energy Trading Platforms Market, by Component, 2023–2035 (USD Million)
Table 27: North America Peer-to-Peer Energy Trading Platforms Market, by Platform Type, 2023–2035 (USD Million)
Table 28: North America Peer-to-Peer Energy Trading Platforms Market, by Energy Type, 2023–2035 (USD Million)
Table 29: North America Peer-to-Peer Energy Trading Platforms Market, by End User, 2023–2035 (USD Million)
Table 30: North America Peer-to-Peer Energy Trading Platforms Market, by Country, 2023–2035 (USD Million)
U.S. Market
Table 31: U.S. Peer-to-Peer Energy Trading Platforms Market, 2023–2035 (USD Million)
Table 32: U.S. Peer-to-Peer Energy Trading Platforms Market, by Component, 2023–2035 (USD Million)
Table 33: U.S. Peer-to-Peer Energy Trading Platforms Market, by Platform Type, 2023–2035 (USD Million)
Table 34: U.S. Peer-to-Peer Energy Trading Platforms Market, by Energy Type, 2023–2035 (USD Million)
Table 35: U.S. Peer-to-Peer Energy Trading Platforms Market, by End User, 2023–2035 (USD Million)
Canada Market
Table 36: Canada Peer-to-Peer Energy Trading Platforms Market, 2023–2035 (USD Million)
Table 37: Canada Peer-to-Peer Energy Trading Platforms Market, by Component, 2023–2035 (USD Million)
Table 38: Canada Peer-to-Peer Energy Trading Platforms Market, by Platform Type, 2023–2035 (USD Million)
Table 39: Canada Peer-to-Peer Energy Trading Platforms Market, by Energy Type, 2023–2035 (USD Million)
Table 40: Canada Peer-to-Peer Energy Trading Platforms Market, by End User, 2023–2035 (USD Million)
Europe Market
Table 41: Europe Peer-to-Peer Energy Trading Platforms Market, 2023–2035 (USD Million)
Table 42: Europe Peer-to-Peer Energy Trading Platforms Market, by Component, 2023–2035 (USD Million)
Table 43: Europe Peer-to-Peer Energy Trading Platforms Market, by Platform Type, 2023–2035 (USD Million)
Table 44: Europe Peer-to-Peer Energy Trading Platforms Market, by Energy Type, 2023–2035 (USD Million)
Table 45: Europe Peer-to-Peer Energy Trading Platforms Market, by End User, 2023–2035 (USD Million)
Table 46: Europe Peer-to-Peer Energy Trading Platforms Market, by Country, 2023–2035 (USD Million)
Germany Market
Table 47: Germany Peer-to-Peer Energy Trading Platforms Market, 2023–2035 (USD Million)
Table 48: Germany Peer-to-Peer Energy Trading Platforms Market, by Component, 2023–2035 (USD Million)
Table 49: Germany Peer-to-Peer Energy Trading Platforms Market, by Platform Type, 2023–2035 (USD Million)
Table 50: Germany Peer-to-Peer Energy Trading Platforms Market, by Energy Type, 2023–2035 (USD Million)
Table 51: Germany Peer-to-Peer Energy Trading Platforms Market, by End User, 2023–2035 (USD Million)
U.K. Market
Table 52: U.K. Peer-to-Peer Energy Trading Platforms Market, 2023–2035 (USD Million)
Table 53: U.K. Peer-to-Peer Energy Trading Platforms Market, by Component, 2023–2035 (USD Million)
Table 54: U.K. Peer-to-Peer Energy Trading Platforms Market, by Platform Type, 2023–2035 (USD Million)
Table 55: U.K. Peer-to-Peer Energy Trading Platforms Market, by Energy Type, 2023–2035 (USD Million)
Table 56: U.K. Peer-to-Peer Energy Trading Platforms Market, by End User, 2023–2035 (USD Million)
France Market
Table 57: France Peer-to-Peer Energy Trading Platforms Market, 2023–2035 (USD Million)
Table 58: France Peer-to-Peer Energy Trading Platforms Market, by Component, 2023–2035 (USD Million)
Table 59: France Peer-to-Peer Energy Trading Platforms Market, by Platform Type, 2023–2035 (USD Million)
Table 60: France Peer-to-Peer Energy Trading Platforms Market, by Energy Type, 2023–2035 (USD Million)
Table 61: France Peer-to-Peer Energy Trading Platforms Market, by End User, 2023–2035 (USD Million)
Netherlands Market
Table 62: Netherlands Peer-to-Peer Energy Trading Platforms Market, 2023–2035 (USD Million)
Table 63: Netherlands Peer-to-Peer Energy Trading Platforms Market, by Component, 2023–2035 (USD Million)
Table 64: Netherlands Peer-to-Peer Energy Trading Platforms Market, by Platform Type, 2023–2035 (USD Million)
Table 65: Netherlands Peer-to-Peer Energy Trading Platforms Market, by Energy Type, 2023–2035 (USD Million)
Table 66: Netherlands Peer-to-Peer Energy Trading Platforms Market, by End User, 2023–2035 (USD Million)
Sweden Market
Table 67: Sweden Peer-to-Peer Energy Trading Platforms Market, 2023–2035 (USD Million)
Table 68: Sweden Peer-to-Peer Energy Trading Platforms Market, by Component, 2023–2035 (USD Million)
Table 69: Sweden Peer-to-Peer Energy Trading Platforms Market, by Platform Type, 2023–2035 (USD Million)
Table 70: Sweden Peer-to-Peer Energy Trading Platforms Market, by Energy Type, 2023–2035 (USD Million)
Table 71: Sweden Peer-to-Peer Energy Trading Platforms Market, by End User, 2023–2035 (USD Million)
Italy Market
Table 72: Italy Peer-to-Peer Energy Trading Platforms Market, 2023–2035 (USD Million)
Table 73: Italy Peer-to-Peer Energy Trading Platforms Market, by Component, 2023–2035 (USD Million)
Table 74: Italy Peer-to-Peer Energy Trading Platforms Market, by Platform Type, 2023–2035 (USD Million)
Table 75: Italy Peer-to-Peer Energy Trading Platforms Market, by Energy Type, 2023–2035 (USD Million)
Table 76: Italy Peer-to-Peer Energy Trading Platforms Market, by End User, 2023–2035 (USD Million)
Rest of Europe Market
Table 77: Rest of Europe Peer-to-Peer Energy Trading Platforms Market, 2023–2035 (USD Million)
Table 78: Rest of Europe Peer-to-Peer Energy Trading Platforms Market, by Component, 2023–2035 (USD Million)
Table 79: Rest of Europe Peer-to-Peer Energy Trading Platforms Market, by Platform Type, 2023–2035 (USD Million)
Table 80: Rest of Europe Peer-to-Peer Energy Trading Platforms Market, by Energy Type, 2023–2035 (USD Million)
Table 81: Rest of Europe Peer-to-Peer Energy Trading Platforms Market, by End User, 2023–2035 (USD Million)
Asia-Pacific Market
Table 82: Asia-Pacific Peer-to-Peer Energy Trading Platforms Market, 2023–2035 (USD Million)
Table 83: Asia-Pacific Peer-to-Peer Energy Trading Platforms Market, by Component, 2023–2035 (USD Million)
Table 84: Asia-Pacific Peer-to-Peer Energy Trading Platforms Market, by Platform Type, 2023–2035 (USD Million)
Table 85: Asia-Pacific Peer-to-Peer Energy Trading Platforms Market, by Energy Type, 2023–2035 (USD Million)
Table 86: Asia-Pacific Peer-to-Peer Energy Trading Platforms Market, by End User, 2023–2035 (USD Million)
Table 87: Asia-Pacific Peer-to-Peer Energy Trading Platforms Market, by Country, 2023–2035 (USD Million)
Japan Market
Table 88: Japan Peer-to-Peer Energy Trading Platforms Market, 2023–2035 (USD Million)
Table 89: Japan Peer-to-Peer Energy Trading Platforms Market, by Component, 2023–2035 (USD Million)
Table 90: Japan Peer-to-Peer Energy Trading Platforms Market, by Platform Type, 2023–2035 (USD Million)
Table 91: Japan Peer-to-Peer Energy Trading Platforms Market, by Energy Type, 2023–2035 (USD Million)
Table 92: Japan Peer-to-Peer Energy Trading Platforms Market, by End User, 2023–2035 (USD Million)
Australia Market
Table 93: Australia Peer-to-Peer Energy Trading Platforms Market, 2023–2035 (USD Million)
Table 94: Australia Peer-to-Peer Energy Trading Platforms Market, by Component, 2023–2035 (USD Million)
Table 95: Australia Peer-to-Peer Energy Trading Platforms Market, by Platform Type, 2023–2035 (USD Million)
Table 96: Australia Peer-to-Peer Energy Trading Platforms Market, by Energy Type, 2023–2035 (USD Million)
Table 97: Australia Peer-to-Peer Energy Trading Platforms Market, by End User, 2023–2035 (USD Million)
Singapore Market
Table 98: Singapore Peer-to-Peer Energy Trading Platforms Market, 2023–2035 (USD Million)
Table 99: Singapore Peer-to-Peer Energy Trading Platforms Market, by Component, 2023–2035 (USD Million)
Table 100: Singapore Peer-to-Peer Energy Trading Platforms Market, by Platform Type, 2023–2035 (USD Million)
Table 101: Singapore Peer-to-Peer Energy Trading Platforms Market, by Energy Type, 2023–2035 (USD Million)
Table 102: Singapore Peer-to-Peer Energy Trading Platforms Market, by End User, 2023–2035 (USD Million)
India Market
Table 103: India Peer-to-Peer Energy Trading Platforms Market, 2023–2035 (USD Million)
Table 104: India Peer-to-Peer Energy Trading Platforms Market, by Component, 2023–2035 (USD Million)
Table 105: India Peer-to-Peer Energy Trading Platforms Market, by Platform Type, 2023–2035 (USD Million)
Table 106: India Peer-to-Peer Energy Trading Platforms Market, by Energy Type, 2023–2035 (USD Million)
Table 107: India Peer-to-Peer Energy Trading Platforms Market, by End User, 2023–2035 (USD Million)
China Market
Table 108: China Peer-to-Peer Energy Trading Platforms Market, 2023–2035 (USD Million)
Table 109: China Peer-to-Peer Energy Trading Platforms Market, by Component, 2023–2035 (USD Million)
Table 110: China Peer-to-Peer Energy Trading Platforms Market, by Platform Type, 2023–2035 (USD Million)
Table 111: China Peer-to-Peer Energy Trading Platforms Market, by Energy Type, 2023–2035 (USD Million)
Table 112: China Peer-to-Peer Energy Trading Platforms Market, by End User, 2023–2035 (USD Million)
South Korea Market
Table 113: South Korea Peer-to-Peer Energy Trading Platforms Market, 2023–2035 (USD Million)
Table 114: South Korea Peer-to-Peer Energy Trading Platforms Market, by Component, 2023–2035 (USD Million)
Table 115: South Korea Peer-to-Peer Energy Trading Platforms Market, by Platform Type, 2023–2035 (USD Million)
Table 116: South Korea Peer-to-Peer Energy Trading Platforms Market, by Energy Type, 2023–2035 (USD Million)
Table 117: South Korea Peer-to-Peer Energy Trading Platforms Market, by End User, 2023–2035 (USD Million)
Rest of Asia-Pacific Market
Table 118: Rest of Asia-Pacific Peer-to-Peer Energy Trading Platforms Market, 2023–2035 (USD Million)
Table 119: Rest of Asia-Pacific Peer-to-Peer Energy Trading Platforms Market, by Component, 2023–2035 (USD Million)
Table 120: Rest of Asia-Pacific Peer-to-Peer Energy Trading Platforms Market, by Platform Type, 2023–2035 (USD Million)
Table 121: Rest of Asia-Pacific Peer-to-Peer Energy Trading Platforms Market, by Energy Type, 2023–2035 (USD Million)
Table 122: Rest of Asia-Pacific Peer-to-Peer Energy Trading Platforms Market, by End User, 2023–2035 (USD Million)
Latin America Market
Table 123: Latin America Peer-to-Peer Energy Trading Platforms Market, 2023–2035 (USD Million)
Table 124: Latin America Peer-to-Peer Energy Trading Platforms Market, by Component, 2023–2035 (USD Million)
Table 125: Latin America Peer-to-Peer Energy Trading Platforms Market, by Platform Type, 2023–2035 (USD Million)
Table 126: Latin America Peer-to-Peer Energy Trading Platforms Market, by Energy Type, 2023–2035 (USD Million)
Table 127: Latin America Peer-to-Peer Energy Trading Platforms Market, by End User, 2023–2035 (USD Million)
Table 128: Latin America Peer-to-Peer Energy Trading Platforms Market, by Country, 2023–2035 (USD Million)
Brazil Market
Table 129: Brazil Peer-to-Peer Energy Trading Platforms Market, 2023–2035 (USD Million)
Table 130: Brazil Peer-to-Peer Energy Trading Platforms Market, by Component, 2023–2035 (USD Million)
Table 131: Brazil Peer-to-Peer Energy Trading Platforms Market, by Platform Type, 2023–2035 (USD Million)
Table 132: Brazil Peer-to-Peer Energy Trading Platforms Market, by Energy Type, 2023–2035 (USD Million)
Table 133: Brazil Peer-to-Peer Energy Trading Platforms Market, by End User, 2023–2035 (USD Million)
Chile Market
Table 134: Chile Peer-to-Peer Energy Trading Platforms Market, 2023–2035 (USD Million)
Table 135: Chile Peer-to-Peer Energy Trading Platforms Market, by Component, 2023–2035 (USD Million)
Table 136: Chile Peer-to-Peer Energy Trading Platforms Market, by Platform Type, 2023–2035 (USD Million)
Table 137: Chile Peer-to-Peer Energy Trading Platforms Market, by Energy Type, 2023–2035 (USD Million)
Table 138: Chile Peer-to-Peer Energy Trading Platforms Market, by End User, 2023–2035 (USD Million)
Mexico Market
Table 139: Mexico Peer-to-Peer Energy Trading Platforms Market, 2023–2035 (USD Million)
Table 140: Mexico Peer-to-Peer Energy Trading Platforms Market, by Component, 2023–2035 (USD Million)
Table 141: Mexico Peer-to-Peer Energy Trading Platforms Market, by Platform Type, 2023–2035 (USD Million)
Table 142: Mexico Peer-to-Peer Energy Trading Platforms Market, by Energy Type, 2023–2035 (USD Million)
Table 143: Mexico Peer-to-Peer Energy Trading Platforms Market, by End User, 2023–2035 (USD Million)
Rest of Latin America Market
Table 144: Rest of Latin America Peer-to-Peer Energy Trading Platforms Market, 2023–2035 (USD Million)
Table 145: Rest of Latin America Peer-to-Peer Energy Trading Platforms Market, by Component, 2023–2035 (USD Million)
Table 146: Rest of Latin America Peer-to-Peer Energy Trading Platforms Market, by Platform Type, 2023–2035 (USD Million)
Table 147: Rest of Latin America Peer-to-Peer Energy Trading Platforms Market, by Energy Type, 2023–2035 (USD Million)
Table 148: Rest of Latin America Peer-to-Peer Energy Trading Platforms Market, by End User, 2023–2035 (USD Million)
Middle East & Africa Market
Table 149: Middle East & Africa Peer-to-Peer Energy Trading Platforms Market, 2023–2035 (USD Million)
Table 150: Middle East & Africa Peer-to-Peer Energy Trading Platforms Market, by Component, 2023–2035 (USD Million)
Table 151: Middle East & Africa Peer-to-Peer Energy Trading Platforms Market, by Platform Type, 2023–2035 (USD Million)
Table 152: Middle East & Africa Peer-to-Peer Energy Trading Platforms Market, by Energy Type, 2023–2035 (USD Million)
Table 153: Middle East & Africa Peer-to-Peer Energy Trading Platforms Market, by End User, 2023–2035 (USD Million)
Table 154: Middle East & Africa Peer-to-Peer Energy Trading Platforms Market, by Country, 2023–2035 (USD Million)
United Arab Emirates (UAE) Market
Table 155: UAE Peer-to-Peer Energy Trading Platforms Market, 2023–2035 (USD Million)
Table 156: UAE Peer-to-Peer Energy Trading Platforms Market, by Component, 2023–2035 (USD Million)
Table 157: UAE Peer-to-Peer Energy Trading Platforms Market, by Platform Type, 2023–2035 (USD Million)
Table 158: UAE Peer-to-Peer Energy Trading Platforms Market, by Energy Type, 2023–2035 (USD Million)
Table 159: UAE Peer-to-Peer Energy Trading Platforms Market, by End User, 2023–2035 (USD Million)
Saudi Arabia Market
Table 160: Saudi Arabia Peer-to-Peer Energy Trading Platforms Market, 2023–2035 (USD Million)
Table 161: Saudi Arabia Peer-to-Peer Energy Trading Platforms Market, by Component, 2023–2035 (USD Million)
Table 162: Saudi Arabia Peer-to-Peer Energy Trading Platforms Market, by Platform Type, 2023–2035 (USD Million)
Table 163: Saudi Arabia Peer-to-Peer Energy Trading Platforms Market, by Energy Type, 2023–2035 (USD Million)
Table 164: Saudi Arabia Peer-to-Peer Energy Trading Platforms Market, by End User, 2023–2035 (USD Million)
South Africa Market
Table 165: South Africa Peer-to-Peer Energy Trading Platforms Market, 2023–2035 (USD Million)
Table 166: South Africa Peer-to-Peer Energy Trading Platforms Market, by Component, 2023–2035 (USD Million)
Table 167: South Africa Peer-to-Peer Energy Trading Platforms Market, by Platform Type, 2023–2035 (USD Million)
Table 168: South Africa Peer-to-Peer Energy Trading Platforms Market, by Energy Type, 2023–2035 (USD Million)
Table 169: South Africa Peer-to-Peer Energy Trading Platforms Market, by End User, 2023–2035 (USD Million)
Israel Market
Table 170: Israel Peer-to-Peer Energy Trading Platforms Market, 2023–2035 (USD Million)
Table 171: Israel Peer-to-Peer Energy Trading Platforms Market, by Component, 2023–2035 (USD Million)
Table 172: Israel Peer-to-Peer Energy Trading Platforms Market, by Platform Type, 2023–2035 (USD Million)
Table 173: Israel Peer-to-Peer Energy Trading Platforms Market, by Energy Type, 2023–2035 (USD Million)
Table 174: Israel Peer-to-Peer Energy Trading Platforms Market, by End User, 2023–2035 (USD Million)
Rest of Middle East & Africa Market
Table 175: Rest of Middle East & Africa Peer-to-Peer Energy Trading Platforms Market, 2023–2035 (USD Million)
Table 176: Rest of Middle East & Africa Peer-to-Peer Energy Trading Platforms Market, by Component, 2023–2035 (USD Million)
Table 177: Rest of Middle East & Africa Peer-to-Peer Energy Trading Platforms Market, by Platform Type, 2023–2035 (USD Million)
Table 178: Rest of Middle East & Africa Peer-to-Peer Energy Trading Platforms Market, by Energy Type, 2023–2035 (USD Million)
Table 179: Rest of Middle East & Africa Peer-to-Peer Energy Trading Platforms Market, by End User, 2023–2035 (USD Million)
List of Figures
Figure 1: Global Peer-to-Peer Energy Trading Platforms Market Size, 2023–2035 (USD Million)
Figure 2: Global Peer-to-Peer Energy Trading Platforms Market Growth, Y-o-Y % Growth, 2025–2035
Figure 3: Global Peer-to-Peer Energy Trading Platforms Market, by Technology, 2025 vs. 2032 (%)
Figure 4: Global Peer-to-Peer Energy Trading Platforms Market, by Component, 2025 vs. 2032 (%)
Figure 5: Global Peer-to-Peer Energy Trading Platforms Market, by Energy Type, 2025 vs. 2032 (%)
Figure 6: Global Peer-to-Peer Energy Trading Platforms Market, by End User, 2025 vs. 2032 (%)
Figure 7: Global Peer-to-Peer Energy Trading Platforms Market, by Region/Country, 2025 vs. 2032 (%)
Figure 8: Impact Assessment of Market Drivers on Global Peer-to-Peer Energy Trading Platforms Market (2025–2032)
Figure 9: Impact Assessment of Market Restraints on Global Peer-to-Peer Energy Trading Platforms Market (2025–2032)
Figure 10: Impact Assessment of Market Opportunities on Global Peer-to-Peer Energy Trading Platforms Market (2025–2032)
Figure 11: Porter’s Five Forces Analysis: Global Peer-to-Peer Energy Trading Platforms Market
Figure 12: Peer-to-Peer Energy Trading Platform Adoption by Region, 2024
Figure 13: Key Regulatory Frameworks for Peer-to-Peer Energy Trading by Region
Figure 14: Investment Trends in Blockchain and IoT for Energy Trading, 2022–2025
Figure 15: Renewable Energy Integration in Peer-to-Peer Trading by Technology
Figure 16: Evolution of Smart Contracts in Energy Trading, 2020–2030
Figure 17: Cost Comparison: Peer-to-Peer vs. Traditional Energy Markets
Figure 18: Global Microgrid Adoption Timeline for Peer-to-Peer Trading, 2023–2035
Figure 19: North America Peer-to-Peer Energy Trading Platforms Market Snapshot, 2025–2035 (USD Million)
Figure 20: North America Peer-to-Peer Energy Trading Platforms Market Share, by Country, 2025 vs. 2035 (%)
Figure 21: Europe Peer-to-Peer Energy Trading Platforms Market Snapshot, 2025–2035 (USD Million)
Figure 22: Europe Peer-to-Peer Energy Trading Platforms Market Share, by Country, 2025 vs. 2035 (%)
Figure 23: Asia-Pacific Peer-to-Peer Energy Trading Platforms Market Snapshot, 2025–2035 (USD Million)
Figure 24: Asia-Pacific Peer-to-Peer Energy Trading Platforms Market Share, by Country, 2025 vs. 2035 (%)
Figure 25: Latin America Peer-to-Peer Energy Trading Platforms Market Snapshot, 2025–2035 (USD Million)
Figure 26: Latin America Peer-to-Peer Energy Trading Platforms Market Share, by Country, 2025 vs. 2035 (%)
Figure 27: Middle East & Africa Peer-to-Peer Energy Trading Platforms Market Snapshot, 2025–2035 (USD Million)
Figure 28: Middle East & Africa Peer-to-Peer Energy Trading Platforms Market Share, by Country, 2025 vs. 2035 (%)


Published Date: May-2026
Published Date: Jul-2024
Published Date: May-2025
Subscribe to get the latest industry updates