Resources
About Us
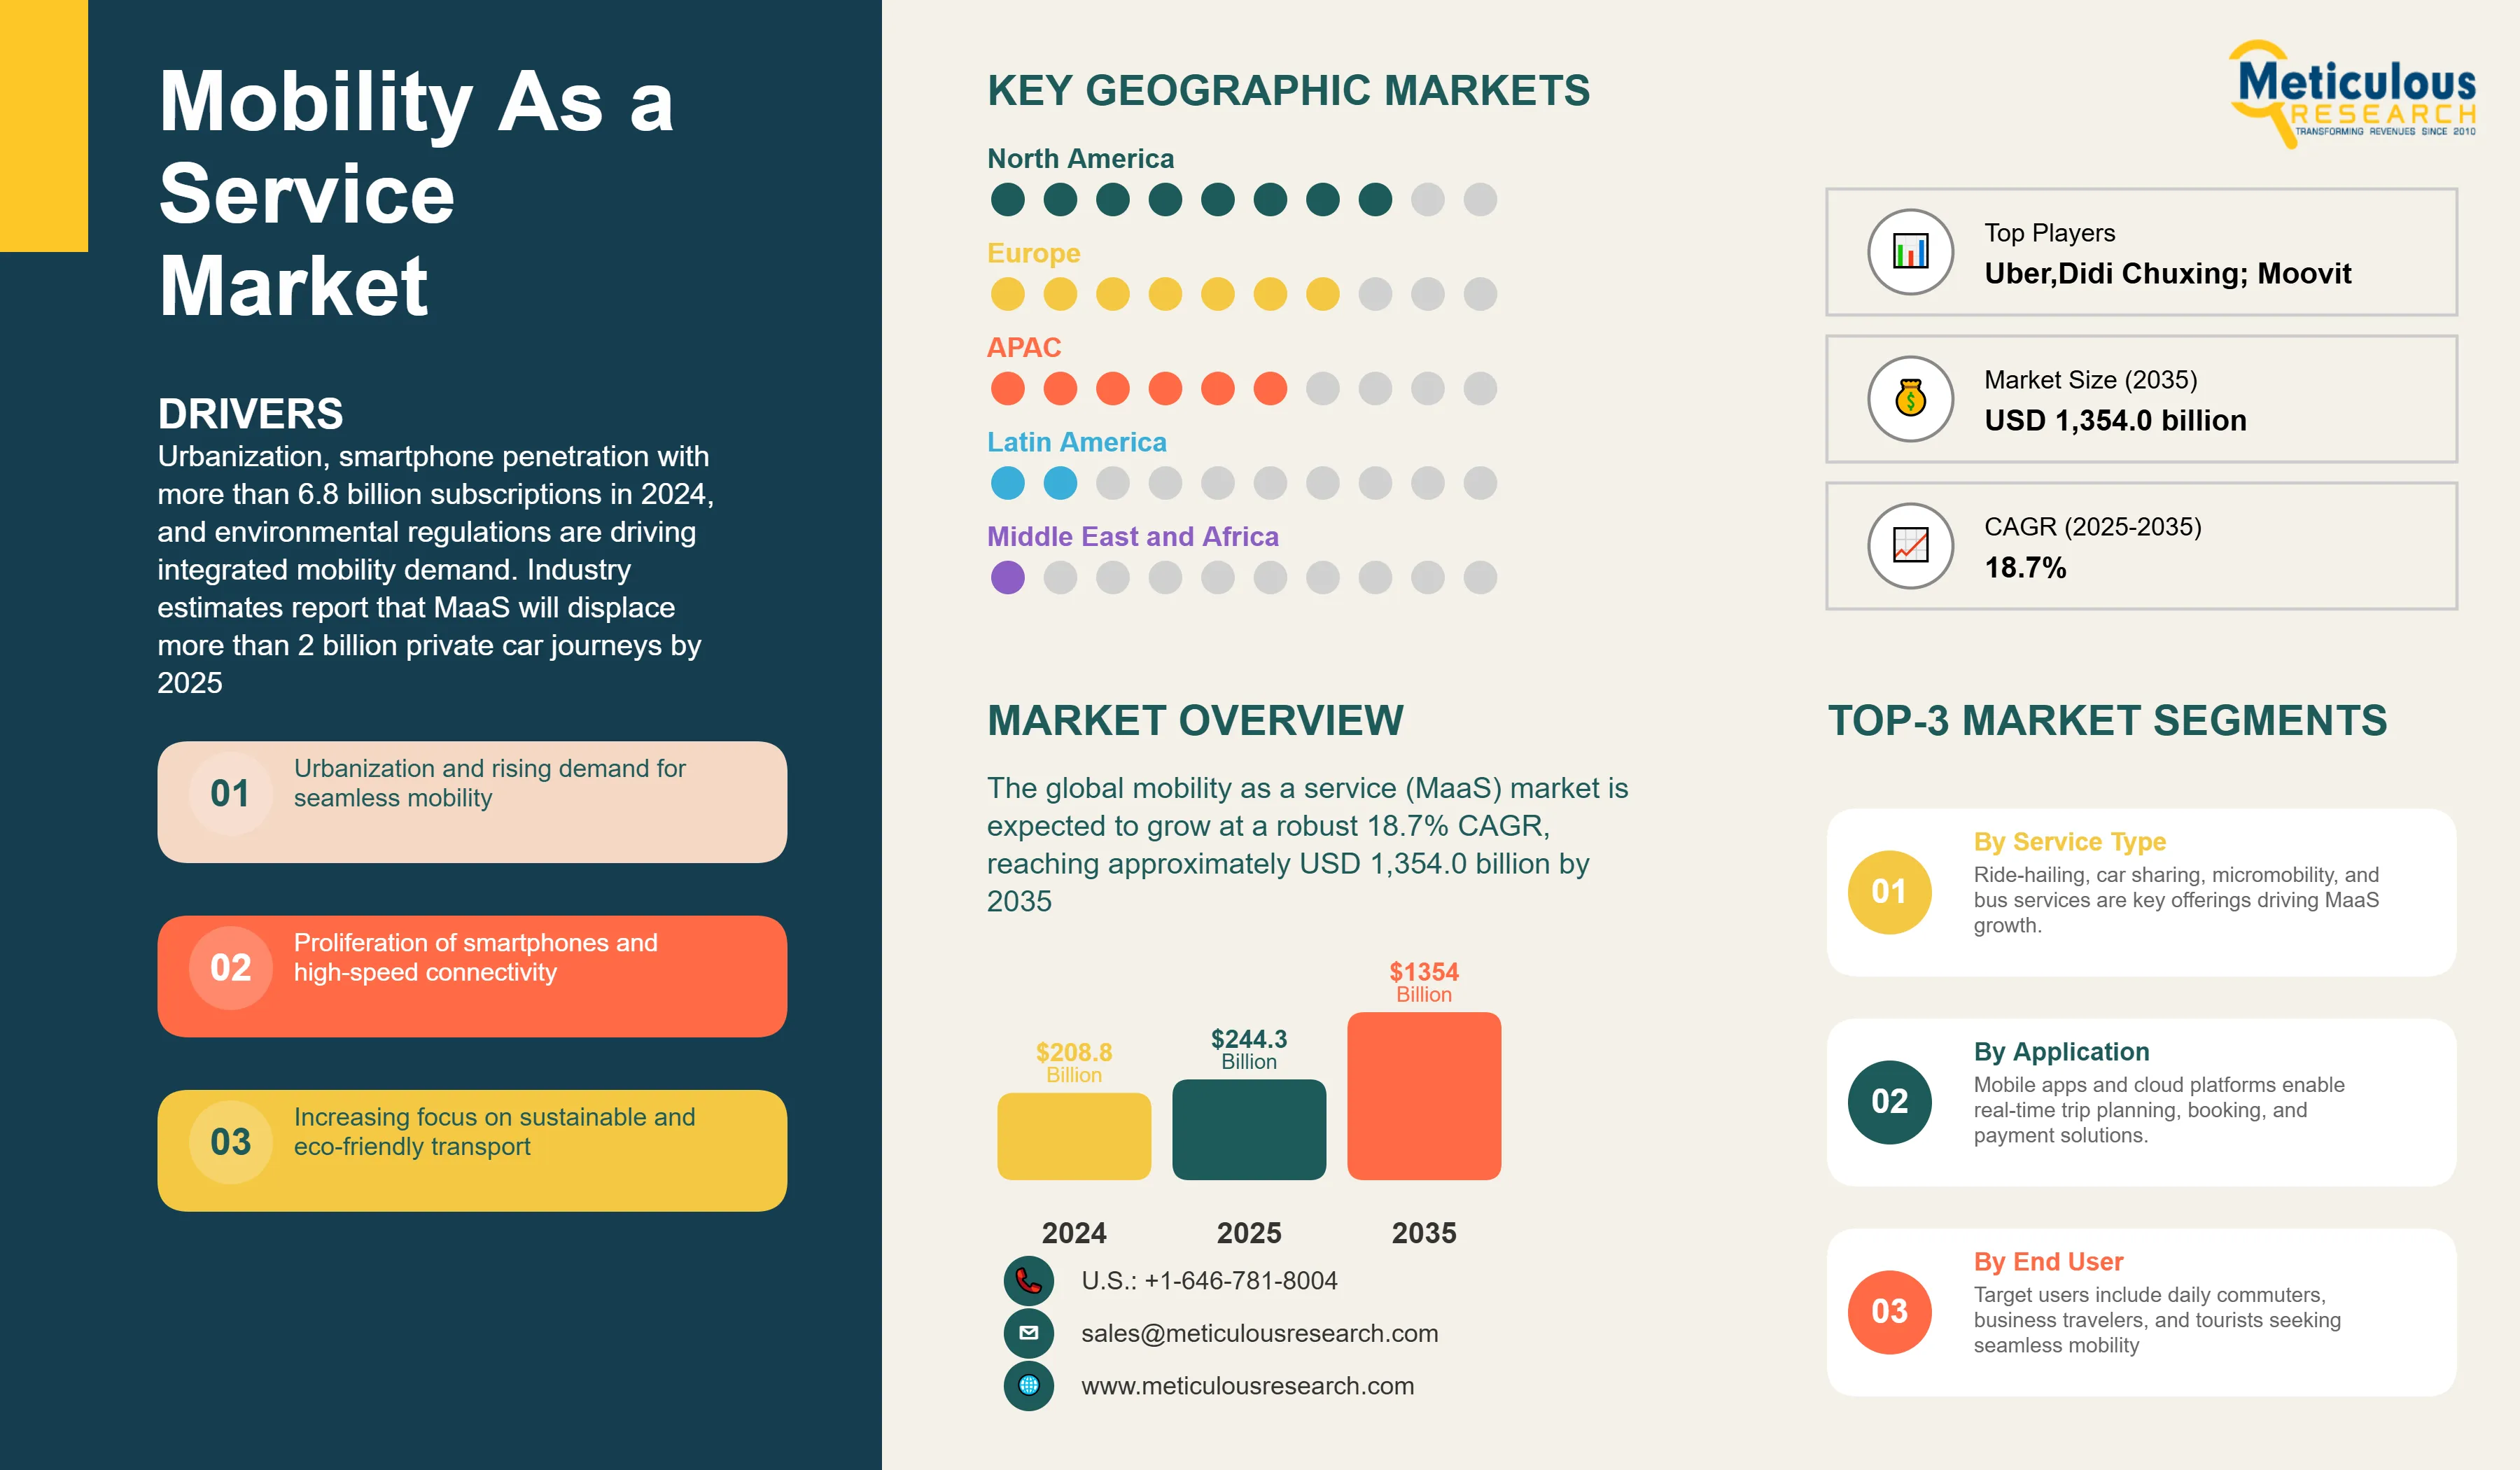
The global mobility as a service (MaaS) market was valued at USD 208.8 billion in 2024. This market is expected to grow at a robust 18.7% CAGR, reaching approximately USD 1,354.0 billion by 2035 from USD 244.3 billion in 2025.
Urbanization, smartphone penetration with more than 6.8 billion subscriptions in 2024, and environmental regulations are driving integrated mobility demand. Industry estimates report that MaaS will displace more than 2 billion private car journeys by 2025, reducing around 14 million MT of CO₂, on yearly basis. BCG estimates MaaS can reduce urban congestion by up to 20% via optimized multimodal routing. Public–private partnerships, such as the MaaS Alliance, MMfE strategic tie-up in February 2024, are optimizing open data protocols for service interoperability. Additionally, the vehicle subscription model drives the use of mobility solutions by offering dynamic and extensive transportation services.
Click here to: Get Free Sample Pages of this Report
The competitive landscape of the global mobility as a service (MaaS) market is undergoing a dynamic and rapid evolution due to the presence of both established players and emerging startups. Integrated platform solutions that incorporate multiple modes of transportation, such as ride-hailing, public transit, bike-sharing, and micro-mobility, are being provided by key players. Furthermore, by optimizing routes and providing real-time updates, the user experience can be improved by utilizing advanced technologies such as artificial intelligence (AI), the Internet of Things (IoT), and big data analytics.
Recent Developments
MaaS Alliance & MMfE partner to advance sustainable urban mobility
Google Incorporates Gemini Model into YouTube Analytics
Key Market Drivers
Key Market Restraints
Base CAGR: 18.7%
|
Category |
Key Factor |
Short-Term Impact (2025–2028) |
Long-Term Impact (2029–2035) |
Estimated CAGR Impact |
|
Drivers |
1. Urbanization and seamless mobility |
Increased urban ride usage |
Mature integrated mobility |
▲ +6.0% |
|
2. Sustainability and eco-friendly transport |
Lower emissions per trip |
Widespread green mobility |
▲ +5.0% |
|
|
3. Smartphones and connectivity |
Higher app-based bookings |
Ubiquitous real-time services |
▲ +4.5% |
|
|
Restraints |
1. Data privacy and cybersecurity concerns |
User data sharing hesitation |
Stricter security protocols |
▼ −2.5% |
|
2. Regulatory and compliance barriers |
Delayed service rollouts |
Harmonized regulations |
▼ −2.0% |
|
|
Opportunities |
1. Integration of autonomous and electric mobility solutions |
Pilot AV/e-EV deployments |
Autonomous fleets mainstream |
▲ +5.5% |
|
2. Growing adoption of on-demand mobility across new geographies |
Expanded geographic coverage |
Global MaaS normalization |
▲ +4.8% |
|
|
Trends |
1. Rise of subscription-based and bundled mobility packages |
Initial bundle pilots |
Standardized subscription plans |
▲ +3.7% |
|
Challenges |
1. Infrastructure limitations for multi-modal integration |
Limited network connectivity |
Enhanced multimodal networks |
▼ −1.8% |
Public–Private Collaboration and Tech Innovation Drive North America’s MaaS Leadership
North America dominates the global MaaS market, accounting for more than 30% market share in 2025. This market dominance is driven by high urbanization rates and significant infrastructure spending. The U.S. in particular holds a dominant position, with major metropolitan areas and federal initiatives accelerating growth. Shared mobility is favoured by high vehicle ownership costs and urban densification. Public–private smart-city projects and EV incentives further bolster the transition. For instance, governments fund electric fleet programs and 5G connectivity to improve transit. Moreover, additional programs such as the USDOT’s Mobility on Demand sandbox grants and expansion of 5G rural broadband (e.g. a USD 9.2 billion 5G Fund in 2023) are improving connectivity and first/last-mile transit links. As a result, North American MaaS growth is robust but uneven, with tech hubs piloting advanced services and broader regions scaling more gradually.
Super-App Integrations and Smart-City Programs Propel APAC’s Rapid MaaS Expansion
Asia-pacific region is expected to experience significant and rapid growth, expanding at 28% CAGR. This growth is driven by China’s super-apps WeChat and Alipay that integrate multiple MaaS options including metro, bus, bike-share, and ride-hail payments, achieving approximately 500 million combined users in 2024. Morever, government smart-city initiatives in Singapore such as the Smart Nation 2030 and India’s National Urban Digital Mission empowers MaaS solutions. Southeast Asia also sees rapid e-scooter and e-bike integrations, reducing first-mile emissions by 28% in Bangkok’s pilot zones. Also, denser population in the cities drives the use of MaaS platform, assisting people navigate densely populated areas seamlessly.
Federal Grants and Tech-First Cities Cement U.S. MaaS Market Pre-eminence
In 2025, the mobility as a service market in the United States is expected to maintain a dominant position. The market is being stimulated by the widespread implementation of real-time multimodal trip planning, the expansion of EV-based micro-transit fleets, and the increased federal support for first/last-mile transit programs. Additionally, there is a stronger collaboration between public agencies and private mobility providers. The user experience and network efficiency have been improved by the integration of scheduling, booking, and payments across buses, subways, bike-sharing, ride-hailing, and micro transit services by centralized platforms. Thus, expansion of EV-based vehicle fleets and public transportation integration is propelling the business growth in the U.S.
Government Policy & Super-App Ecosystem Accelerate China’s MaaS Dominance
The Chinese mobility as a service market is expected to witness the fastest growth globally during the forecast period, fuelled by the widespread adoption of smartphones and super-apps, the robust integration of digital payments, national smart transportation initiatives, and the growing demand from tier-2 and tier-3 urban centres. Platforms such as WeChat and Amap facilitate the seamless planning, booking, and payment of multimodal trips for metro, bus, bike-sharing, and ride-hailing services by means of a unified interface. For instance, cities such as Guangzhou, Xiamen, and Zhengzhou have implemented MaaS systems through WeChat mini-programs that is used by over 200 million active users, provides real-time transit data, fare integration, and one-click ticketing. This trend emphasizes China's strategic initiative to establish centralized, app-based transport ecosystems that enhance public mobility and alleviate urban congestion.
Harmonized Regulations and Climate Targets Propel Germany’s MaaS Growth
Germany is expected to lead the European MaaS market. Key drivers include Germany’s comprehensive transit infrastructure, a strong push for digitalization, and progressive urban mobility policies. High smartphone usage means consumers are receptive to app-based transport. Also, major German cities such as Berlin, Hamburg, Munich are increasingly multimodal, combining buses, trains, e-scooters, bike-sharing and car-sharing under unified payment platforms. The German government’s climate goals also align with MaaS growth, with federal and state policies allocate significant funding for EV infrastructure and modernizing public transit, directly supporting MaaS deployment. Thus, Germany’s strong mobility networks and supportive policy frameworks positions it at the forefront of MaaS innovation.
Journey Planning & Management Solutions to Dominate the Mobility as a Service (MaaS) Market
Journey Planning & Management Solutions is estimated to dominate the mobility as a service (MaaS) market in 2025 with a share of 30%, primarily because they serve as the foundational layer that integrates various transportation modes into a seamless user experience. Unlike standalone services such as ride-hailing or car-sharing, these solutions aggregate multiple options—public transit, micro-mobility, taxis, and more—into a single platform, allowing users to compare routes, costs, and travel times in real time. This convenience is a major driver of adoption, as consumers increasingly prefer apps that eliminate the hassle of switching between multiple services or payment methods. Cities and governments also favor these solutions because they promote the use of public transit while reducing congestion and emissions, aligning with broader urban sustainability goals.
Ride-Hailing Dominate Services; Micro-Mobility Shows Strongest Growth
In 2025, the ride-hailing services segment is estimated to command the largest share of 35% of the global MaaS market. Ride-hailing services are instrumental in meeting the increasing demand for transportation services by offering users a last-mile connectivity option. Users have the autonomy to select their preferred vehicle, route, and travel time with ride-hailing services. Mobility as a service platform provides users with a comprehensive selection of transportation options by incorporating ride-hailing services, enabling them to select the most appropriate mode for their requirements, all within a single application.
|
Report Attribute |
Details |
|
Market size (2025) |
USD 244.3 billion |
|
Revenue forecast in 2035 |
USD 1,354.0 billion |
|
CAGR (2025-2035) |
18.7% |
|
Base Year |
2024 |
|
Forecast period |
2025 – 2035 |
|
Report coverage |
Market size and forecast, competitive landscape and benchmarking, country/regional level analysis, key trends, growth drivers and restraints |
|
Segments covered |
Service (Ride-hailing, Car Sharing, Bus Sharing), Solution, Service, Transportation Type (Public Transportation, Private Transportation), Propulsion Type, Operating System, Application, End-User Industry, Geography |
|
Regional scope |
North America, Europe, Asia-Pacific, Latin America, and Middle East & Africa |
|
Key companies profiled |
Uber; Lyft; Didi Chuxing; Moovit (Intel); Whim (MaaS Global); Grab; BlaBlaCar; Bird; Lime; Ola Cabs; Via Transportation; Gett; Zipcar; Bolt; Curb Mobility; Free2Move; GoEuro (Omio); Citymapper; EasyMile; Transdev. |
|
Customization |
Comprehensive report customization with purchase. Addition or modification to country, regional & segment scope available |
|
Pricing Details |
Access customized purchase options to meet your specific research requirements. Explore flexible pricing models |
The mobility as a service market size is estimated to be USD 244.3 billion in 2025 and grow at a CAGR of 18.7% to reach USD 1,354 billion by 2035.
In 2024, the mobility as a service market size was estimated at USD 208.8 billion, with projections to reach USD 244.3 billion in 2025.
Uber, Lyft, Didi Chuxing, Moovit (Intel), Grab, BlaBlaCar, Bird, Lime, Ola Cabs, Via Transportation, Gett, GoEuro (Omio), Citymapper, EasyMile, and Transdev among others are the major companies operating in the Mobility as a Service Market.
The Asia-Pacific region is projected to grow at the highest CAGR of 28% over the forecast period (2025-2035).
In 2025, the ride-hailing services segment is estimated to hold the largest share of the MaaS market.
1. Market Definition & Scope
1.1. Market Definition
1.2. Market Ecosystem
1.3. Currency
1.4. Key Stakeholders
2. Research Methodology
2.1. Research Approach
2.2. Process of Data Collection and Validation
2.2.1. Secondary Research
2.2.2. Primary Research/Interviews with Key Opinion Leaders from the Industry
2.3. Market Sizing and Forecast
2.3.1. Market Size Estimation Approach
2.3.1.1. Bottom-up Approach
2.3.1.2. Top-down Approach
2.3.2. Growth Forecast Approach
2.3.3. Assumptions for the Study
3. Executive Summary
3.1. Overview
3.2. Segmental Analysis
3.2.1. Mobility as a Service Market, by Service Type
3.2.2. Mobility as a Service Market, by Solution
3.2.3. Mobility as a Service Market, by Transportation
3.2.4. Mobility as a Service Market, by Propulsion Type
3.2.5. Mobility as a Service Market, by Operating System
3.2.6. Mobility as a Service Market, by Application
3.2.7. Mobility as a Service Market, by End-Use Industry
3.2.8. Mobility as a Service Market, by Region
3.3. Competitive Landscape
3.4. Strategic Recommendations
4. Market Insights
4.1. Overview
4.2. Factors Affecting Market Growth
4.2.1. Drivers
4.2.1.1. Urbanization and rising demand for seamless mobility
4.2.1.2. Proliferation of smartphones and high-speed connectivity
4.2.1.3. Increasing focus on sustainable and eco-friendly transport
4.2.2. Restraints
4.2.2.1. Data privacy and cyber security concerns
4.2.2.2. Regulatory and compliance barriers
4.2.3. Opportunities
4.2.3.1. Integration of autonomous and electric mobility solutions
4.2.3.2. Growing adoption of on-demand mobility across new geographies
4.2.4. Trends
4.2.4.1. Rise of subscription-based and bundled mobility packages
4.2.5. Challenges
4.2.5.1. Infrastructure limitations for multi-modal integration
4.3. Porter's Five Forces Analysis
4.3.1. Bargaining Power of Suppliers
4.3.2. Bargaining Power of Buyers
4.3.3. Threat of Substitutes
4.3.4. Threat of New Entrants
4.3.5. Degree of Competition
4.4. Technology Impact on Mobility as a Service Market
4.4.1. Advanced Mobility Platforms
4.4.1.1. Real-time trip planning and route optimization
4.4.1.2. Seamless, unified payment systems
4.4.1.3. Personalization and loyalty programs
4.4.2. IoT, Cloud, and AI Integration
4.4.2.1. Vehicle and user data analytics
4.4.2.2. Predictive maintenance alerts
4.4.2.3. Dynamic pricing and fleet management
4.4.3. Autonomous & Connected Vehicles
4.4.3.1. Human-machine collaboration for safety
4.4.3.2. Multi-modal orchestration with micro-mobility
5. Impact of Sustainability on Mobility as a Service Market
5.1. Promoting low-emission urban mobility
5.2. Reducing personal vehicle dependence
5.3. Supporting local air quality and climate goals
5.4. Optimizing transport resource use and sharing
5.5. Enabling mobility for underserved populations
5.6. Vendor sustainability commitments and ESG reporting
6. Competitive Landscape
6.1. Overview
6.2. Key Growth Strategies
6.3. Competitive Benchmarking
6.4. Competitive Dashboard
6.4.1. Industry Leaders
6.4.2. Market Differentiators
6.4.3. Vanguards
6.4.4. Contemporary Stalwarts
6.5. Market Share/Ranking Analysis, by Key Players, 2024
7. Mobility as a Service Market Assessment—By Service Type
7.1. Overview
7.2. Ride-hailing
7.3. Car Sharing
7.4. Bus Sharing
7.5. Train Services
7.6. Micro-Mobility
7.7. Others
8. Mobility as a Service Market Assessment—By Solution
8.1. Overview
8.2. Journey Planning & Management Solutions
8.3. Payment Solutions
8.4. Booking & Ticketing Solutions
8.5. Application Technology Solutions
8.6. Others
9. Mobility as a Service Market Assessment—By Transportation
9.1. Overview
9.2. Public Transportation
9.3. Private Transportation
10. Mobility as a Service Market Assessment—By Propulsion Type
10.1. Overview
10.2. Internal Combustion Engine (ICE) Vehicle
10.3. Electric Vehicle (EV)
10.4. Compressed Natural Gas (CNG)/Liquefied Petroleum Gas (LPG) Vehicle
11. Mobility as a Service Market Assessment—By Operating System
11.1. Overview
11.2. Android
11.3. iOS
11.4. Others
12. Mobility as a Service Market Assessment—By Application
12.1. Overview
12.2. Business-to-Business (B2B)
12.3. Business-to-Consumer (B2C)
12.4. Peer-to-Peer (P2P)
13. Mobility as a Service Market Assessment—By End User
13.1. Overview
13.2. Personal
13.3. Automotive
13.4. Government
13.5. Healthcare
13.6. Retail
13.7. Entertainment
13.8. Others
14. Mobility as a Service Market Assessment—By Geography
14.1. Overview
14.2. North America
14.2.1. U.S.
14.2.2. Canada
14.3. Europe
14.3.1. Germany
14.3.2. U.K.
14.3.3. France
14.3.4. Netherlands
14.3.5. Switzerland
14.3.6. Rest of Europe
14.4. Asia-Pacific
14.4.1. China
14.4.2. Japan
14.4.3. South Korea
14.4.4. Taiwan
14.4.5. India
14.4.6. Singapore
14.4.7. Australia
14.4.8. Rest of Asia-Pacific
14.5. Latin America
14.5.1. Brazil
14.5.2. Mexico
14.5.3. Argentina
14.5.4. Rest of Latin America
14.6. Middle East & Africa
14.6.1. UAE
14.6.2. Saudi Arabia
14.6.3. Israel
14.6.4. South Africa
14.6.5. Rest of Middle East & Africa
15. Company Profiles (Business Overview, Financial Overview, Product Portfolio, Strategic Developments, and SWOT Analysis)
15.1. Uber
15.2. Lyft
15.3. Didi Chuxing
15.4. Moovit (Intel)
15.5. Grab
15.6. BlaBlaCar
15.7. Bird
15.8. Lime
15.9. Ola Cabs
15.10. Via Transportation
15.11. Gett
15.12. Zipcar
15.13. Bolt
15.14. Curb Mobility
15.15. Free2Move
15.16. GoEuro (Omio)
15.17. EasyMile
15.18. Transdev
15.19. Others
16. Appendix
16.1. Available Customization
16.2. Related Reports


Published Date: Sep-2025
Published Date: Feb-2026
Published Date: Apr-2022
Subscribe to get the latest industry updates