Resources
About Us
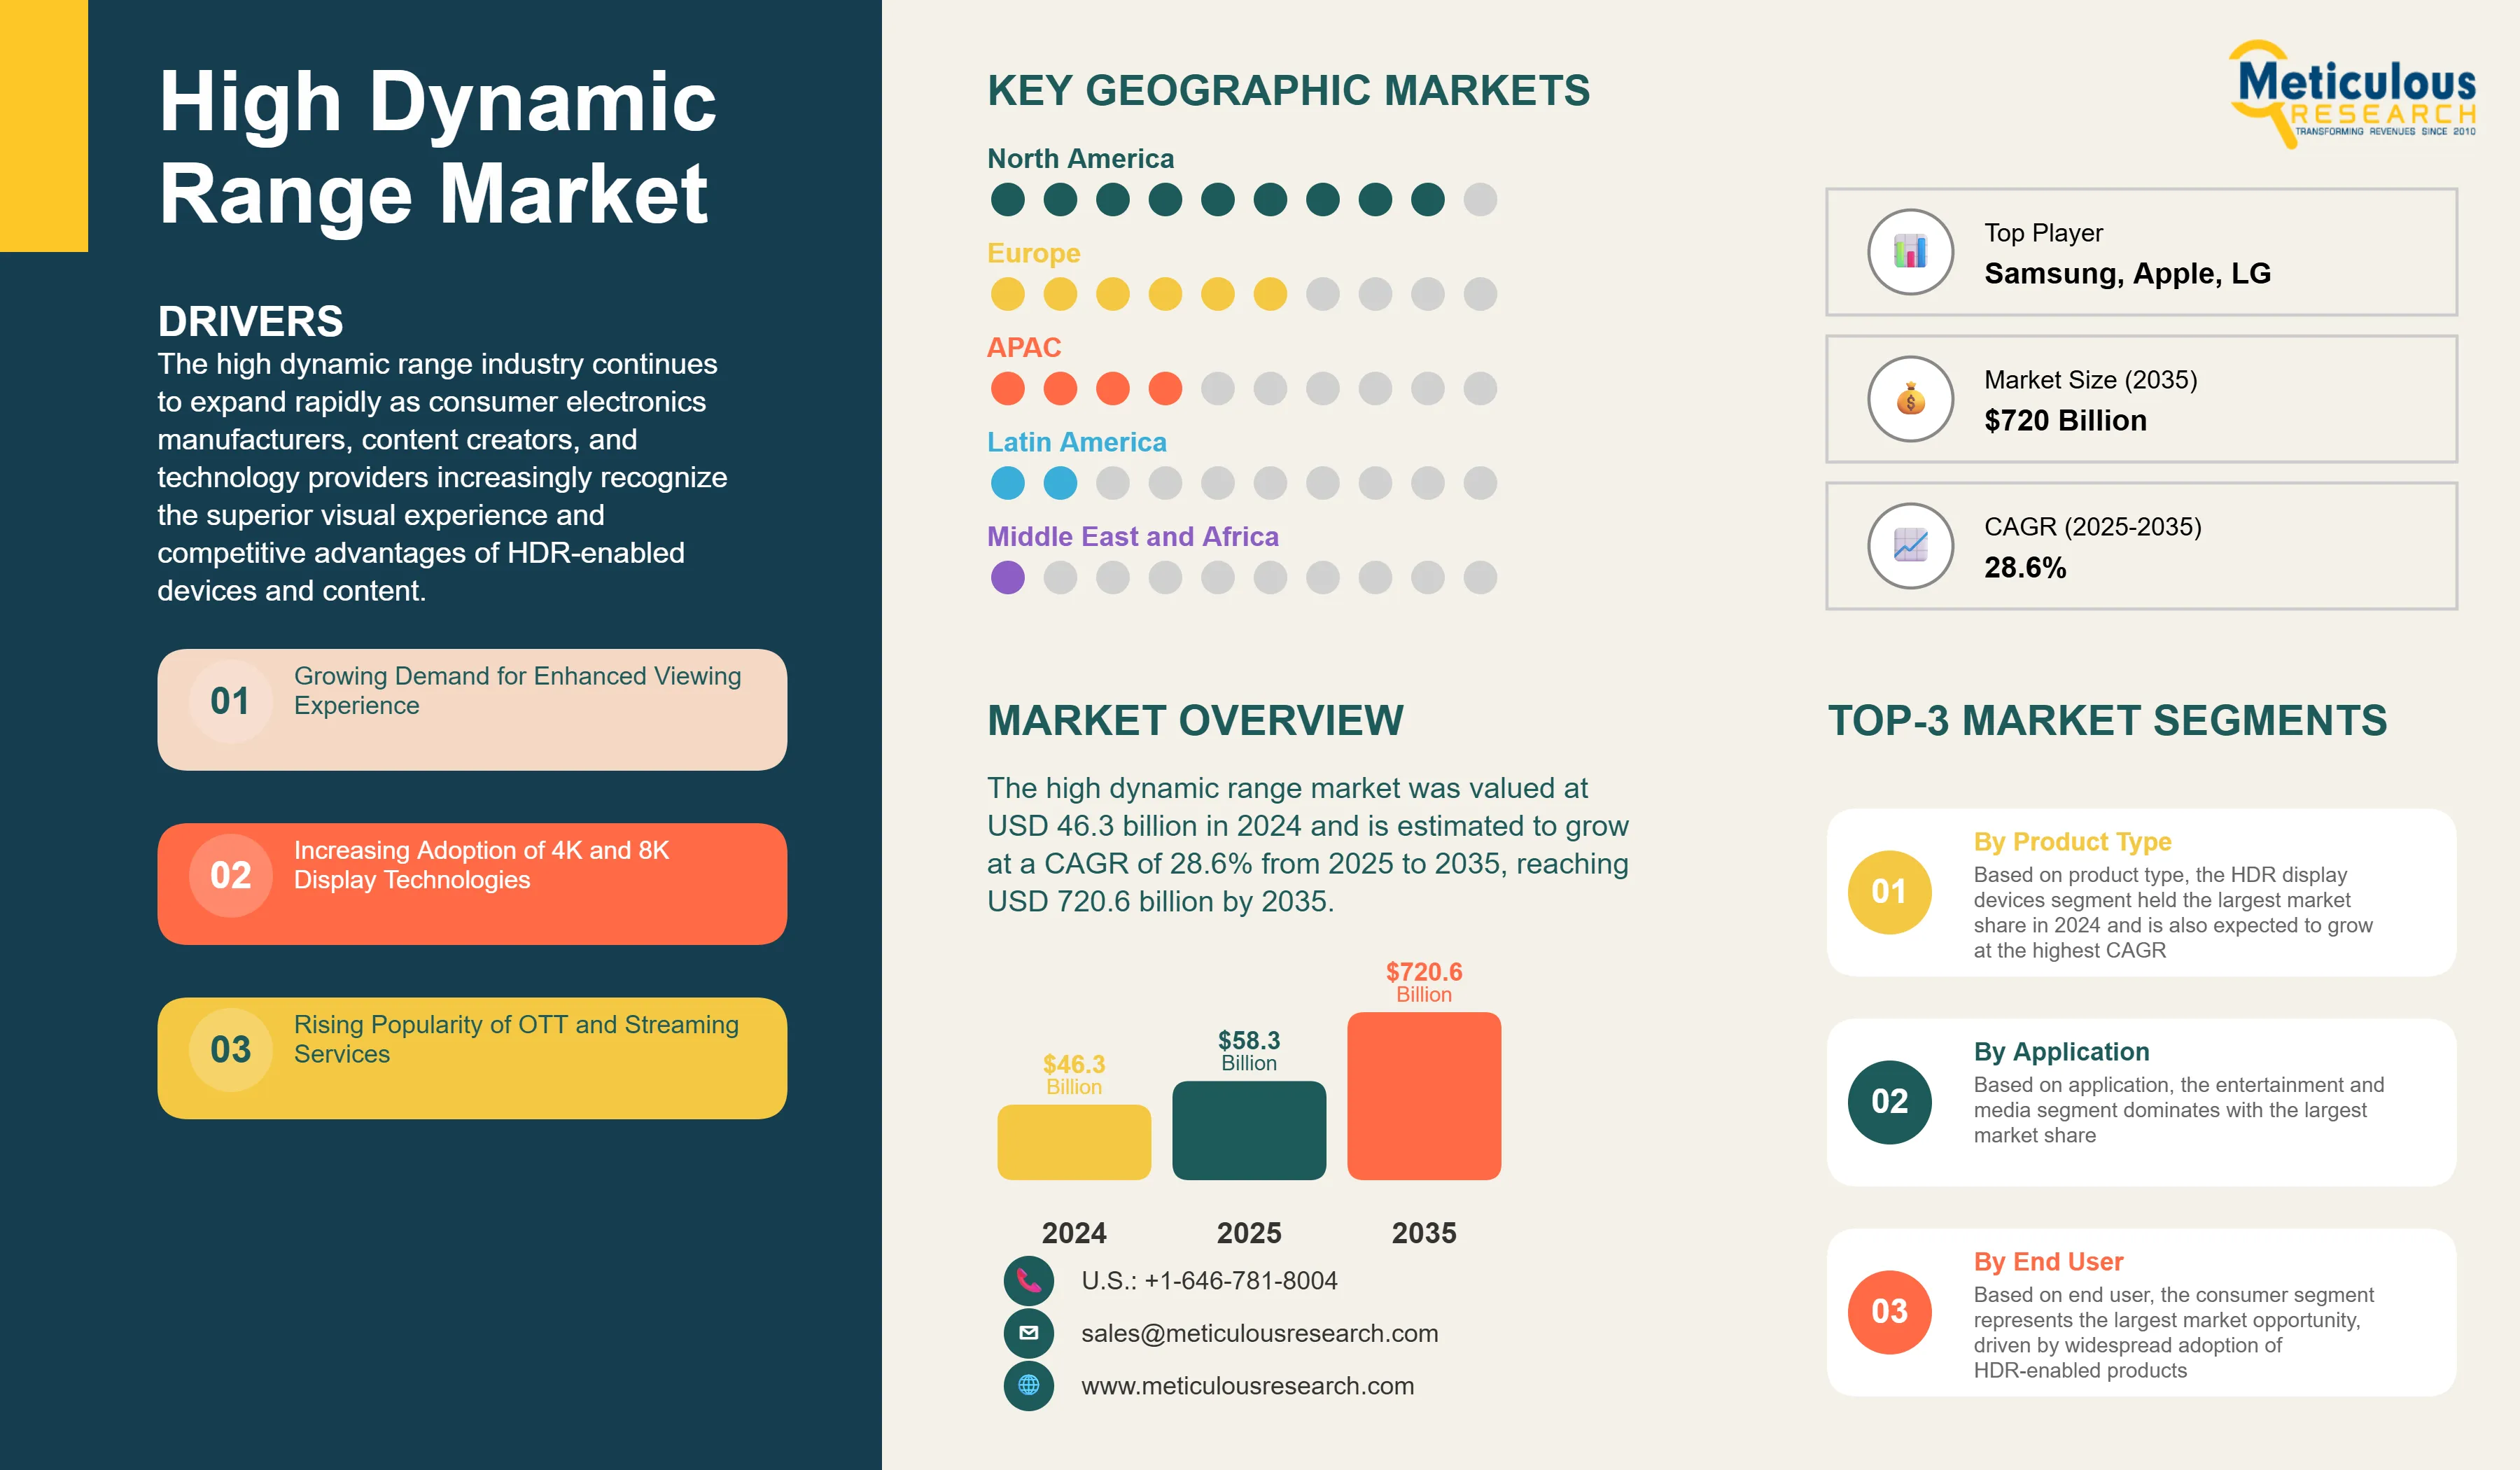
The high dynamic range market was valued at USD 46.3 billion in 2024 and is estimated to grow at a CAGR of 28.6% from 2025 to 2035, reaching USD 720.6 billion by 2035.
The high dynamic range industry continues to expand rapidly as consumer electronics manufacturers, content creators, and technology providers increasingly recognize the superior visual experience and competitive advantages of HDR-enabled devices and content. With growing consumer demand for enhanced viewing experiences across televisions, smartphones, gaming consoles, and streaming platforms, the adoption of HDR technologies is driving unprecedented market growth. The integration of HDR10, HDR10+, Dolby Vision, and other advanced formats across entertainment, gaming, and professional applications is creating substantial opportunities across the value chain.
For instance, the increasing adoption of 4K and 8K display technologies, combined with the rising popularity of OTT and streaming services, is accelerating HDR content creation and consumption. Major streaming platforms like Netflix, Amazon Prime Video, and Disney+ have significantly expanded their HDR content libraries as HDR viewing becomes increasingly mainstream.
The industry is experiencing significant technological transformation through AI-enhanced HDR processing, real-time HDR streaming capabilities, and integration with emerging technologies like virtual and augmented reality. Leading technology companies are investing heavily in next-generation HDR solutions to improve content quality, reduce processing latency, and enhance user experiences across multiple device categories. These technological advances are enabling content creators and device manufacturers to deliver more immersive visual experiences while maintaining competitive pricing and energy efficiency.
In 2024, major semiconductor companies introduced next-generation processing technologies designed to enhance HDR performance while significantly improving power efficiency. These advancements reflect the industry's ongoing commitment to sustainable innovation, delivering better brightness, color accuracy, and overall visual experience in a more energy-efficient manner.
High Dynamic Range Market Trends and Insights
High Dynamic Range Market Trends
HDR Display Devices Segment Projected to Showcase the Largest Growth During the Forecast Period
HDR display devices are projected to show significant growth during the forecast period, representing the largest segment of the total high dynamic range market. This segment includes televisions, monitors and computer displays, projectors, mobile displays, and automotive displays. The complexity and sophistication of HDR display technologies continue to increase as manufacturers compete to deliver superior visual experiences and support multiple HDR formats.
"Growth in HDR display devices is largely driven by rising consumer expectations for premium viewing experiences. HDR capability is now a standard feature among new high-end television models, and consumers are willing to pay more for devices that deliver superior color accuracy, brightness, and immersive visuals. Leading manufacturers—including Samsung, LG, Sony, and TCL—have aggressively expanded their HDR TV portfolios, spanning technologies like OLED, QLED, Mini‑LED, and LCD. Meanwhile, the integration of AI-based upscaling and adaptive HDR processing across multiple price segments further underscores the industry’s push toward delivering high-quality visual experiences."
Asia-Pacific Region to Exhibit the Highest Growth During the Forecast Period
The Asia-Pacific region is estimated to show remarkable growth during the forecast period, driven by rapid technological adoption, growing middle-class populations, and favorable manufacturing ecosystems. Countries like China, Japan, South Korea, and India are experiencing unprecedented demand for HDR-enabled devices as consumer preferences shift toward premium entertainment experiences and advanced display technologies.
China leads the region with the world's largest consumer electronics market and significant investments in HDR technology development and manufacturing. The country's HDR market is projected to grow at a CAGR exceeding 30% through 2035, driven by domestic demand and export opportunities. Japan and South Korea follow closely with advanced HDR technology development and early adoption of next-generation display formats.
The region's growth is also supported by major technology investments and strategic partnerships. For instance, In recent years, leading Asian technology companies—including Samsung, Huawei, BOE, Xiaomi, and various Taiwanese research institutes—have significantly increased their investments in HDR and advanced display technologies. This expanded R&D encompasses mobile HDR, automotive cockpit displays, and professional content-creation tools. Major manufacturers have also established dedicated display innovation centers across Asia to support new technology development, such as microLED, flexible OLED, and AI-based image enhancement, reflecting a clear industry commitment to accelerating HDR capabilities and market adoption.
High Dynamic Range Market Analysis
The high dynamic range industry faces challenges from standardization complexities across multiple HDR formats, content creation and post-production requirements, and power consumption concerns in mobile applications. Compatibility issues between different HDR standards (HDR10, HDR10+, Dolby Vision, HLG) create complexity for content creators and device manufacturers. The limited availability of HDR content in certain markets and the high costs of HDR-compatible devices continue to impact adoption rates in price-sensitive segments.
Despite these constraints, the market offers substantial growth opportunities through technological advancements in display and camera technologies, expansion in emerging markets, and integration with AI and machine learning capabilities. The adoption of next-generation HDR formats and real-time processing technologies is helping manufacturers deliver superior visual experiences while reducing costs and power consumption. Government initiatives supporting digital transformation and smart city development provide sustainable growth pathways for HDR technology adoption across multiple applications.
Based on product type, the high dynamic range market is segmented into HDR display devices, HDR capture devices, HDR processing solutions, and HDR accessories and components. The HDR display devices segment held the largest market share in 2024 and is expected to grow at the highest CAGR, driven by consumer demand for enhanced viewing experiences.
Based on HDR format, the market is segmented into HDR10, HDR10+, Dolby Vision, Hybrid Log-Gamma (HLG), Advanced HDR by Technicolor (SL-HDR), 4K HDR, 8K HDR, and others. The HDR10 segment maintains significant market share due to its open standard nature, while Dolby Vision is experiencing rapid growth in premium applications.
Based on application, the market serves entertainment and media, gaming, automotive, security and surveillance, healthcare and medical imaging, education and training, and other specialized applications. The entertainment and media segment dominates with the largest market share, reflecting consumer preferences for premium content experiences.
Based on end user, the market is segmented into consumers, professional creators, enterprises, and others. The consumer segment represents the largest market opportunity, driven by widespread adoption of HDR-enabled televisions, smartphones, and streaming services.
Regional Market Analysis
North America leads the high dynamic range market with significant adoption of premium HDR devices and strong content creation ecosystems. The region's mature entertainment industry and high consumer spending on technology products drive continued HDR market expansion. Major streaming services and content creators based in North America are pioneering HDR content development and driving industry standards.
Europe continues to expand its HDR technology adoption across diverse markets with varying consumer preferences and regulatory environments. The region's focus on sustainability and energy efficiency is driving innovation in power-efficient HDR technologies. European manufacturers are increasingly focusing on automotive HDR applications and professional content creation solutions.
Asia-Pacific demonstrates the strongest growth potential in HDR technology adoption, with rapidly expanding consumer electronics markets and significant manufacturing capabilities. The region's large population of tech-savvy consumers and growing disposable income levels support premium HDR device adoption. Major technology companies in the region are investing heavily in next-generation HDR innovations.
Latin America focuses on expanding HDR technology access through affordable device options and localized content development. The region's growing middle class and increasing internet penetration create opportunities for HDR streaming services and mobile HDR applications.
Middle East & Africa represents emerging opportunities for HDR technology adoption, particularly in urban markets with growing technology infrastructure and consumer spending power.
High Dynamic Range Market Share
Major players like Samsung Electronics, Apple Inc., LG Electronics, Sony Corporation, and TCL Technology Group compete strongly in the high dynamic range industry. These companies focus on strategic partnerships, technology innovations, and comprehensive product portfolios to strengthen their market positions and expand across multiple HDR applications. As demand grows for HDR capabilities across consumer electronics, automotive, and professional markets, companies invest heavily in research and development, manufacturing capacity, and ecosystem partnerships.
Leading manufacturers are forming strategic alliances with content creators, streaming services, and technology platform providers to create integrated HDR ecosystems. These collaborations enable better content optimization, improved device compatibility, and enhanced user experiences across multiple HDR formats and applications. The market is also witnessing increased investment in HDR technology startups and specialized solution providers focused on emerging applications like automotive displays and mobile HDR processing.
High Dynamic Range Market Companies
Major players operating in the high dynamic range industry include:
High Dynamic Range Industry News
April 2025: Samsung Electronics announced its smart TVs and monitors will now support Netflix shows and movies in HDR10+.1 With HDR10+, viewers can enjoy richer contrast, deeper colors and stunning visual depth. This integration will help viewers to experience enhanced realism and depth across a growing library of HDR10+ content.
July 2024: Canon India recently launched EOS R1 & EOS R5 Mark II, marking a major leap in hybrid imaging technology with new DIGIC Accelerator + DIGIC X processing, stacked CMOS sensors, and deep learning autofocus and stabilization systems.
High Dynamic Range Industry Segmentation
The high dynamic range market includes display devices, capture equipment, processing solutions, and supporting technologies that enable enhanced visual experiences with greater brightness range and color accuracy. The report covers HDR technologies across consumer, professional, and enterprise applications while excluding legacy display technologies and non-HDR imaging solutions.
The high dynamic range market is segmented by product type, HDR format, application, end user, and geography (North America, Europe, Asia-Pacific, Latin America, and Middle East & Africa). By product type, the market includes HDR display devices, HDR capture devices, HDR processing solutions, and HDR accessories and components. By HDR format, the market covers HDR10, HDR10+, Dolby Vision, Hybrid Log-Gamma (HLG), and other emerging formats. The report provides comprehensive market analysis and forecasts for each segment.
|
Particulars |
Details |
|
Number of Pages |
268 |
|
Format |
PDF & Excel |
|
Forecast Period |
2025–2035 |
|
Base Year |
2024 |
|
CAGR (Value) |
28.6% |
|
Market Size (Value)in 2025 |
USD 58.2 Billion |
|
Market Size (Value) in 2035 |
USD 720.6 Billion |
|
Segments Covered |
By Product Type
By HDR Format
By Application
By End User
|
|
Countries Covered |
North America (U.S., Canada) |
|
Key Companies |
Samsung Electronics Co., Ltd., Apple Inc., LG Electronics Inc., Sony Corporation, TCL Technology Group Corporation, Hisense Group Holdings Co., Ltd., Panasonic Corporation, Canon Inc., Nikon Corporation, VIZIO, Inc., Philips (Koninklijke Philips N.V.), Sharp Corporation, OmniVision Technologies, Inc., Fujifilm Holdings Corporation, Olympus Corporation, Dolby Laboratories, Inc., RED Digital Cinema, LLC, Blackmagic Design Pty. Ltd., GoPro, Inc., NVIDIA Corporation, Advanced Micro Devices, Inc. (AMD), MediaTek Inc. |
The High Dynamic Range Market size is expected to reach USD 58.2 billion in 2025 and grow at a CAGR of 28.6% to reach USD 720.6 billion by 2035.
In 2025, the High Dynamic Range Market size is expected to reach USD 58.2 billion.
Samsung Electronics Co., Ltd., Apple Inc., LG Electronics Inc., Sony Corporation, and TCL Technology Group Corporation are the major companies operating in the High Dynamic Range Market.
The Asia-Pacific region is estimated to grow at the highest CAGR over the forecast period (2025-2035).
In 2025, HDR display devices account for the largest market share in the High Dynamic Range Market.
In 2024, the High Dynamic Range Market size was estimated at USD 46.3 billion. The report covers historical market size data and forecasts through 2035.
1. Market Definition & Scope
1.1. Market Definition
1.2. Market Ecosystem
1.3. Currency
1.4. Key Stakeholders
2. Research Methodology
2.1. Research Approach
2.2. Process of Data Collection and Validation
2.2.1. Secondary Research
2.2.2. Primary Research/Interviews with Key Opinion Leaders from the Industry
2.3. Market Sizing and Forecast
2.3.1. Market Size Estimation Approach
2.3.1.1. Bottom-up Approach
2.3.1.2. Top-down Approach
2.3.2. Growth Forecast Approach
2.3.3. Assumptions for the Study
3. Executive Summary
3.1. Overview
3.2. Segmental Analysis
3.2.1. High Dynamic Range Market, by Product Type
3.2.2. High Dynamic Range Market, by HDR Format
3.2.3. High Dynamic Range Market, by Application
3.2.4. High Dynamic Range Market, by End User
3.2.5. High Dynamic Range Market, by Geography
3.3. Competitive Landscape
4. Market Insights
4.1. Overview
4.2. Factors Affecting Market Growth
4.2.1. Drivers
4.2.1.1. Growing Demand for Enhanced Viewing Experience
4.2.1.2. Increasing Adoption of 4K and 8K Display Technologies
4.2.1.3. Rising Popularity of OTT and Streaming Services
4.2.1.4. Technological Advancements in Display and Camera Technologies
4.2.1.5. Growing Gaming Industry and Console Market
4.2.2. Restraints
4.2.2.1. High Cost of HDR-Compatible Devices
4.2.2.2. Limited HDR Content Availability
4.2.2.3. Compatibility Issues Across Different HDR Standards
4.2.3. Opportunities
4.2.3.1. Expansion in Emerging Markets
4.2.3.2. Integration with AI and Machine Learning
4.2.3.3. Growing Automotive Display Applications
4.2.3.4. Development of Mobile HDR Technologies
4.2.4. Trends
4.2.4.1. Adoption of HDR10+ and Dolby Vision Standards
4.2.4.2. Integration of HDR in Smartphones and Mobile Devices
4.2.4.3. Real-time HDR Processing and Live Streaming
4.2.4.4. HDR in Virtual and Augmented Reality
4.2.5. Challenges
4.2.5.1. Standardization Across Multiple HDR Formats
4.2.5.2. Content Creation and Post-Production Complexities
4.2.5.3. Power Consumption in Mobile Applications
4.3. Porter’s Five Forces Analysis
4.3.1. Bargaining Power of Suppliers
4.3.2. Bargaining Power of Buyers
4.3.3. Threat of Substitutes
4.3.4. Threat of New Entrants
4.3.5. Degree of Competition
4.4. Sustainability Impact on High Dynamic Range Market
4.4.1. Environmental Sustainability Factors
4.4.1.1. Energy-Efficient HDR Display Technologies
4.4.1.2. Sustainable Manufacturing Practices
4.4.2. Market Response to Sustainability Demands
4.4.2.1. Regulatory Compliance and Green Initiatives
4.4.2.2. Manufacturer-led Sustainability Programs
4.4.3. Market Opportunities Created by Sustainability Focus
4.4.3.1. Eco-friendly Device Development
4.4.3.2. Challenges in Sustainable Manufacturing
5. High Dynamic Range Market Assessment—By Product Type
5.1. Overview
5.2. HDR Display Devices
5.2.1. Televisions
5.2.2. Monitors and Computer Displays
5.2.3. Projectors
5.2.4. Mobile Displays
5.2.5. Automotive Displays
5.3. HDR Capture Devices
5.3.1. Professional Cameras
5.3.2. Smartphones and Mobile Cameras
5.3.3. Action Cameras
5.3.4. Cameras and Camcorders
5.3.5. Security and Surveillance Cameras
5.4. HDR Processing Solutions
5.5. HDR Accessories and Components
6. High Dynamic Range Market Assessment—By HDR Format
6.1. Overview
6.2. HDR10
6.3. HDR10+
6.4. Dolby Vision
6.5. Hybrid Log-Gamma (HLG)
6.6. Advanced HDR by Technicolor (SL-HDR)
6.7. 4K HDR
6.8. 8K HDR
6.9. Others
7. High Dynamic Range Market Assessment—By Application
7.1. Overview
7.2. Entertainment and Media
7.3. Gaming
7.4. Automotive
7.5. Security and Surveillance
7.6. Healthcare and Medical Imaging
7.7. Education and Training
7.8. Others
8. High Dynamic Range Market Assessment—By End User
8.1. Overview
8.2. Consumers
8.3. Professional Creators
8.4. Enterprises
8.5. Others
9. High Dynamic Range Market Assessment—By Geography
9.1. Overview
9.2. North America
9.2.1. U.S.
9.2.2. Canada
9.3. Europe
9.3.1. Germany
9.3.2. France
9.3.3. U.K.
9.3.4. Italy
9.3.5. Spain
9.3.6. Netherlands
9.3.7. Rest of Europe (RoE)
9.4. Asia-Pacific
9.4.1. China
9.4.2. Japan
9.4.3. India
9.4.4. South Korea
9.4.5. Australia
9.4.6. Rest of Asia-Pacific (RoAPAC)
9.5. Latin America
9.5.1. Brazil
9.5.2. Mexico
9.5.3. Rest of Latin America (RoLATAM)
9.6. Middle East & Africa
9.6.1. Saudi Arabia
9.6.2. United Arab Emirates (UAE)
9.6.3. Rest of Middle East & Africa (RoMEA)
10. Competitive Landscape
10.1. Overview
10.2. Key Growth Strategies
10.3. Competitive Benchmarking
10.4. Competitive Dashboard
10.4.1. Industry Leaders
10.4.2. Market Differentiators
10.4.3. Vanguards
10.4.4. Contemporary Stalwarts
10.5. Market Share/Ranking Analysis, by the Key Players, 2024
11. Company Profiles (Business Overview, Financial Overview, Product Portfolio, Strategic Developments, and SWOT Analysis*)
11.1. Samsung Electronics Co., Ltd.
11.2. Apple Inc.
11.3. LG Electronics Inc.
11.4. Sony Corporation
11.5. TCL Technology Group Corporation
11.6. Hisense Group Holdings Co., Ltd.
11.7. Panasonic Corporation
11.8. Canon Inc.
11.9. Nikon Corporation
11.10. VIZIO, Inc.
11.11. Philips (Koninklijke Philips N.V.)
11.12. Sharp Corporation
11.13. OmniVision Technologies, Inc.
11.14. Fujifilm Holdings Corporation
11.15. Olympus Corporation
11.16. Dolby Laboratories, Inc.
11.17. RED Digital Cinema, LLC
11.18. Blackmagic Design Pty. Ltd.
11.19. GoPro, Inc.
11.20. NVIDIA Corporation
11.21. Advanced Micro Devices, Inc. (AMD)
11.22. MediaTek Inc.
12. Appendix
12.1. Available Customization
12.2. Related Reports
List of Tables
Table 1. Global High Dynamic Range Market, by Product Type, 2025–2035 (USD Million)
Table 2. Global HDR Display Devices Market, by Type, 2025–2035 (USD Million)
Table 3. Global Televisions Market, by Country/Region, 2025–2035 (USD Million)
Table 4. Global Monitors and Computer Displays Market, by Country/Region, 2025–2035 (USD Million)
Table 5. Global Projectors Market, by Country/Region, 2025–2035 (USD Million)
Table 6. Global Mobile Displays Market, by Country/Region, 2025–2035 (USD Million)
Table 7. Global Automotive Displays Market, by Country/Region, 2025–2035 (USD Million)
Table 8. Global HDR Capture Devices Market, by Type, 2025–2035 (USD Million)
Table 9. Global Professional Cameras Market, by Country/Region, 2025–2035 (USD Million)
Table 10. Global Smartphones and Mobile Cameras Market, by Country/Region, 2025–2035 (USD Million)
Table 11. Global Action Cameras Market, by Country/Region, 2025–2035 (USD Million)
Table 12. Global Cameras and Camcorders Market, by Country/Region, 2025–2035 (USD Million)
Table 13. Global Security and Surveillance Cameras Market, by Country/Region, 2025–2035 (USD Million)
Table 14. Global HDR Processing Solutions Market, by Country/Region, 2025–2035 (USD Million)
Table 15. Global HDR Accessories and Components Market, by Country/Region, 2025–2035 (USD Million)
Table 16. Global High Dynamic Range Market, by HDR Format, 2025–2035 (USD Million)
Table 17. Global HDR10 Market, by Country/Region, 2025–2035 (USD Million)
Table 18. Global HDR10+ Market, by Country/Region, 2025–2035 (USD Million)
Table 19. Global Dolby Vision Market, by Country/Region, 2025–2035 (USD Million)
Table 20. Global Hybrid Log-Gamma (HLG) Market, by Country/Region, 2025–2035 (USD Million)
Table 21. Global Advanced HDR by Technicolor (SL-HDR) Market, by Country/Region, 2025–2035 (USD Million)
Table 22. Global 4K HDR Market, by Country/Region, 2025–2035 (USD Million)
Table 23. Global 8K HDR Market, by Country/Region, 2025–2035 (USD Million)
Table 24. Global Other HDR Formats Market, by Country/Region, 2025–2035 (USD Million)
Table 25. Global High Dynamic Range Market, by Application, 2025–2035 (USD Million)
Table 26. Global High Dynamic Range Market for Entertainment and Media, by Application, 2025–2035 (USD Million)
Table 27. Global High Dynamic Range Market for Gaming, by Application, 2025–2035 (USD Million)
Table 28. Global High Dynamic Range Market for Automotive, by Country/Region, 2025–2035 (USD Million)
Table 29. Global High Dynamic Range Market for Security and Surveillance, by Country/Region, 2025–2035 (USD Million)
Table 30. Global High Dynamic Range Market for Healthcare and Medical Imaging, by Country/Region, 2025–2035 (USD Million)
Table 31. Global High Dynamic Range Market for Education and Training, by Country/Region, 2025–2035 (USD Million)
Table 32. Global High Dynamic Range Market for Other Applications, by Country/Region, 2025–2035 (USD Million)
Table 33. Global High Dynamic Range Market, by End User, 2025–2035 (USD Million)
Table 34. Global High Dynamic Range Market for Consumers, by Country/Region, 2025–2035 (USD Million)
Table 35. Global High Dynamic Range Market for Professional Creators, by Country/Region, 2025–2035 (USD Million)
Table 36. Global High Dynamic Range Market for Enterprises, by Country/Region, 2025–2035 (USD Million)
Table 37. Global High Dynamic Range Market for Other End Users, by Country/Region, 2025–2035 (USD Million)
Table 38. North America: High Dynamic Range Market, by Product Type, 2025–2035 (USD Million)
Table 39. North America: HDR Display Devices Market, by Type, 2025–2035 (USD Million)
Table 40. North America: HDR Capture Devices Market, by Type, 2025–2035 (USD Million)
Table 41. North America: High Dynamic Range Market, by HDR Format, 2025–2035 (USD Million)
Table 42. North America: High Dynamic Range Market, by Application, 2025–2035 (USD Million)
Table 43. North America: High Dynamic Range Market, by End User, 2025–2035 (USD Million)
Table 44. U.S.: High Dynamic Range Market, by Product Type, 2025–2035 (USD Million)
Table 45. U.S.: HDR Display Devices Market, by Type, 2025–2035 (USD Million)
Table 46. U.S.: HDR Capture Devices Market, by Type, 2025–2035 (USD Million)
Table 47. U.S.: High Dynamic Range Market, by HDR Format, 2025–2035 (USD Million)
Table 48. U.S.: High Dynamic Range Market, by Application, 2025–2035 (USD Million)
Table 49. U.S.: High Dynamic Range Market, by End User, 2025–2035 (USD Million)
Table 50. Canada: High Dynamic Range Market, by Product Type, 2025–2035 (USD Million)
Table 51. Canada: HDR Display Devices Market, by Type, 2025–2035 (USD Million)
Table 52. Canada: HDR Capture Devices Market, by Type, 2025–2035 (USD Million)
Table 53. Canada: High Dynamic Range Market, by HDR Format, 2025–2035 (USD Million)
Table 54. Canada: High Dynamic Range Market, by Application, 2025–2035 (USD Million)
Table 55. Canada: High Dynamic Range Market, by End User, 2025–2035 (USD Million)
Table 56. Europe: High Dynamic Range Market, by Product Type, 2025–2035 (USD Million)
Table 57. Europe: HDR Display Devices Market, by Type, 2025–2035 (USD Million)
Table 58. Europe: HDR Capture Devices Market, by Type, 2025–2035 (USD Million)
Table 59. Europe: High Dynamic Range Market, by HDR Format, 2025–2035 (USD Million)
Table 60. Europe: High Dynamic Range Market, by Application, 2025–2035 (USD Million)
Table 61. Europe: High Dynamic Range Market, by End User, 2025–2035 (USD Million)
Table 62. Germany: High Dynamic Range Market, by Product Type, 2025–2035 (USD Million)
Table 63. Germany: HDR Display Devices Market, by Type, 2025–2035 (USD Million)
Table 64. Germany: HDR Capture Devices Market, by Type, 2025–2035 (USD Million)
Table 65. Germany: High Dynamic Range Market, by HDR Format, 2025–2035 (USD Million)
Table 66. Germany: High Dynamic Range Market, by Application, 2025–2035 (USD Million)
Table 67. Germany: High Dynamic Range Market, by End User, 2025–2035 (USD Million)
Table 68. France: High Dynamic Range Market, by Product Type, 2025–2035 (USD Million)
Table 69. France: HDR Display Devices Market, by Type, 2025–2035 (USD Million)
Table 70. France: HDR Capture Devices Market, by Type, 2025–2035 (USD Million)
Table 71. France: High Dynamic Range Market, by HDR Format, 2025–2035 (USD Million)
Table 72. France: High Dynamic Range Market, by Application, 2025–2035 (USD Million)
Table 73. France: High Dynamic Range Market, by End User, 2025–2035 (USD Million)
Table 74. U.K.: High Dynamic Range Market, by Product Type, 2025–2035 (USD Million)
Table 75. U.K.: HDR Display Devices Market, by Type, 2025–2035 (USD Million)
Table 76. U.K.: HDR Capture Devices Market, by Type, 2025–2035 (USD Million)
Table 77. U.K.: High Dynamic Range Market, by HDR Format, 2025–2035 (USD Million)
Table 78. U.K.: High Dynamic Range Market, by Application, 2025–2035 (USD Million)
Table 79. U.K.: High Dynamic Range Market, by End User, 2025–2035 (USD Million)
Table 80. Italy: High Dynamic Range Market, by Product Type, 2025–2035 (USD Million)
Table 81. Italy: HDR Display Devices Market, by Type, 2025–2035 (USD Million)
Table 82. Italy: HDR Capture Devices Market, by Type, 2025–2035 (USD Million)
Table 83. Italy: High Dynamic Range Market, by HDR Format, 2025–2035 (USD Million)
Table 84. Italy: High Dynamic Range Market, by Application, 2025–2035 (USD Million)
Table 85. Italy: High Dynamic Range Market, by End User, 2025–2035 (USD Million)
Table 86. Spain: High Dynamic Range Market, by Product Type, 2025–2035 (USD Million)
Table 87. Spain: HDR Display Devices Market, by Type, 2025–2035 (USD Million)
Table 88. Spain: HDR Capture Devices Market, by Type, 2025–2035 (USD Million)
Table 89. Spain: High Dynamic Range Market, by HDR Format, 2025–2035 (USD Million)
Table 90. Spain: High Dynamic Range Market, by Application, 2025–2035 (USD Million)
Table 91. Spain: High Dynamic Range Market, by End User, 2025–2035 (USD Million)
Table 92. Netherlands: High Dynamic Range Market, by Product Type, 2025–2035 (USD Million)
Table 93. Netherlands: HDR Display Devices Market, by Type, 2025–2035 (USD Million)
Table 94. Netherlands: HDR Capture Devices Market, by Type, 2025–2035 (USD Million)
Table 95. Netherlands: High Dynamic Range Market, by HDR Format, 2025–2035 (USD Million)
Table 96. Netherlands: High Dynamic Range Market, by Application, 2025–2035 (USD Million)
Table 97. Netherlands: High Dynamic Range Market, by End User, 2025–2035 (USD Million)
Table 98. Rest of Europe: High Dynamic Range Market, by Product Type, 2025–2035 (USD Million)
Table 99. Rest of Europe: HDR Display Devices Market, by Type, 2025–2035 (USD Million)
Table 100. Rest of Europe: HDR Capture Devices Market, by Type, 2025–2035 (USD Million)
Table 101. Rest of Europe: High Dynamic Range Market, by HDR Format, 2025–2035 (USD Million)
Table 102. Rest of Europe: High Dynamic Range Market, by Application, 2025–2035 (USD Million)
Table 103. Rest of Europe: High Dynamic Range Market, by End User, 2025–2035 (USD Million)
Table 104. Asia-Pacific: High Dynamic Range Market, by Product Type, 2025–2035 (USD Million)
Table 105. Asia-Pacific: HDR Display Devices Market, by Type, 2025–2035 (USD Million)
Table 106. Asia-Pacific: HDR Capture Devices Market, by Type, 2025–2035 (USD Million)
Table 107. Asia-Pacific: High Dynamic Range Market, by HDR Format, 2025–2035 (USD Million)
Table 108. Asia-Pacific: High Dynamic Range Market, by Application, 2025–2035 (USD Million)
Table 109. Asia-Pacific: High Dynamic Range Market, by End User, 2025–2035 (USD Million)
Table 110. China: High Dynamic Range Market, by Product Type, 2025–2035 (USD Million)
Table 111. China: HDR Display Devices Market, by Type, 2025–2035 (USD Million)
Table 112. China: HDR Capture Devices Market, by Type, 2025–2035 (USD Million)
Table 113. China: High Dynamic Range Market, by HDR Format, 2025–2035 (USD Million)
Table 114. China: High Dynamic Range Market, by Application, 2025–2035 (USD Million)
Table 115. China: High Dynamic Range Market, by End User, 2025–2035 (USD Million)
Table 116. Japan: High Dynamic Range Market, by Product Type, 2025–2035 (USD Million)
Table 117. Japan: HDR Display Devices Market, by Type, 2025–2035 (USD Million)
Table 118. Japan: HDR Capture Devices Market, by Type, 2025–2035 (USD Million)
Table 119. Japan: High Dynamic Range Market, by HDR Format, 2025–2035 (USD Million)
Table 120. Japan: High Dynamic Range Market, by Application, 2025–2035 (USD Million)
Table 121. Japan: High Dynamic Range Market, by End User, 2025–2035 (USD Million)
Table 122. India: High Dynamic Range Market, by Product Type, 2025–2035 (USD Million)
Table 123. India: HDR Display Devices Market, by Type, 2025–2035 (USD Million)
Table 124. India: HDR Capture Devices Market, by Type, 2025–2035 (USD Million)
Table 125. India: High Dynamic Range Market, by HDR Format, 2025–2035 (USD Million)
Table 126. India: High Dynamic Range Market, by Application, 2025–2035 (USD Million)
Table 127. India: High Dynamic Range Market, by End User, 2025–2035 (USD Million)
Table 128. South Korea: High Dynamic Range Market, by Product Type, 2025–2035 (USD Million)
Table 129. South Korea: HDR Display Devices Market, by Type, 2025–2035 (USD Million)
Table 130. South Korea: HDR Capture Devices Market, by Type, 2025–2035 (USD Million)
Table 131. South Korea: High Dynamic Range Market, by HDR Format, 2025–2035 (USD Million)
Table 132. South Korea: High Dynamic Range Market, by Application, 2025–2035 (USD Million)
Table 133. South Korea: High Dynamic Range Market, by End User, 2025–2035 (USD Million)
Table 134. Australia: High Dynamic Range Market, by Product Type, 2025–2035 (USD Million)
Table 135. Australia: HDR Display Devices Market, by Type, 2025–2035 (USD Million)
Table 136. Australia: HDR Capture Devices Market, by Type, 2025–2035 (USD Million)
Table 137. Australia: High Dynamic Range Market, by HDR Format, 2025–2035 (USD Million)
Table 138. Australia: High Dynamic Range Market, by Application, 2025–2035 (USD Million)
Table 139. Australia: High Dynamic Range Market, by End User, 2025–2035 (USD Million)
Table 140. Rest of Asia-Pacific: High Dynamic Range Market, by Product Type, 2025–2035 (USD Million)
Table 141. Rest of Asia-Pacific: HDR Display Devices Market, by Type, 2025–2035 (USD Million)
Table 142. Rest of Asia-Pacific: HDR Capture Devices Market, by Type, 2025–2035 (USD Million)
Table 143. Rest of Asia-Pacific: High Dynamic Range Market, by HDR Format, 2025–2035 (USD Million)
Table 144. Rest of Asia-Pacific: High Dynamic Range Market, by Application, 2025–2035 (USD Million)
Table 145. Rest of Asia-Pacific: High Dynamic Range Market, by End User, 2025–2035 (USD Million)
Table 146. Latin America: High Dynamic Range Market, by Product Type, 2025–2035 (USD Million)
Table 147. Latin America: HDR Display Devices Market, by Type, 2025–2035 (USD Million)
Table 148. Latin America: HDR Capture Devices Market, by Type, 2025–2035 (USD Million)
Table 149. Latin America: High Dynamic Range Market, by HDR Format, 2025–2035 (USD Million)
Table 150. Latin America: High Dynamic Range Market, by Application, 2025–2035 (USD Million)
Table 151. Latin America: High Dynamic Range Market, by End User, 2025–2035 (USD Million)
Table 152. Brazil: High Dynamic Range Market, by Product Type, 2025–2035 (USD Million)
Table 153. Brazil: HDR Display Devices Market, by Type, 2025–2035 (USD Million)
Table 154. Brazil: HDR Capture Devices Market, by Type, 2025–2035 (USD Million)
Table 155. Brazil: High Dynamic Range Market, by HDR Format, 2025–2035 (USD Million)
Table 156. Brazil: High Dynamic Range Market, by Application, 2025–2035 (USD Million)
Table 157. Brazil: High Dynamic Range Market, by End User, 2025–2035 (USD Million)
Table 158. Mexico: High Dynamic Range Market, by Product Type, 2025–2035 (USD Million)
Table 159. Mexico: HDR Display Devices Market, by Type, 2025–2035 (USD Million)
Table 160. Mexico: HDR Capture Devices Market, by Type, 2025–2035 (USD Million)
Table 161. Mexico: High Dynamic Range Market, by HDR Format, 2025–2035 (USD Million)
Table 162. Mexico: High Dynamic Range Market, by Application, 2025–2035 (USD Million)
Table 163. Mexico: High Dynamic Range Market, by End User, 2025–2035 (USD Million)
Table 164. Rest of Latin America: High Dynamic Range Market, by Product Type, 2025–2035 (USD Million)
Table 165. Rest of Latin America: HDR Display Devices Market, by Type, 2025–2035 (USD Million)
Table 166. Rest of Latin America: HDR Capture Devices Market, by Type, 2025–2035 (USD Million)
Table 167. Rest of Latin America: High Dynamic Range Market, by HDR Format, 2025–2035 (USD Million)
Table 168. Rest of Latin America: High Dynamic Range Market, by Application, 2025–2035 (USD Million)
Table 169. Rest of Latin America: High Dynamic Range Market, by End User, 2025–2035 (USD Million)
Table 170. Middle East and Africa: High Dynamic Range Market, by Product Type, 2025–2035 (USD Million)
Table 171. Middle East and Africa: HDR Display Devices Market, by Type, 2025–2035 (USD Million)
Table 172. Middle East and Africa: HDR Capture Devices Market, by Type, 2025–2035 (USD Million)
Table 173. Middle East and Africa: High Dynamic Range Market, by HDR Format, 2025–2035 (USD Million)
Table 174. Middle East and Africa: High Dynamic Range Market, by Application, 2025–2035 (USD Million)
Table 175. Middle East and Africa: High Dynamic Range Market, by End User, 2025–2035 (USD Million)
Table 176. Saudi Arabia: High Dynamic Range Market, by Product Type, 2025–2035 (USD Million)
Table 177. Saudi Arabia: HDR Display Devices Market, by Type, 2025–2035 (USD Million)
Table 178. Saudi Arabia: HDR Capture Devices Market, by Type, 2025–2035 (USD Million)
Table 179. Saudi Arabia: High Dynamic Range Market, by HDR Format, 2025–2035 (USD Million)
Table 180. Saudi Arabia: High Dynamic Range Market, by Application, 2025–2035 (USD Million)
Table 181. Saudi Arabia: High Dynamic Range Market, by End User, 2025–2035 (USD Million)
Table 182. United Arab Emirates: High Dynamic Range Market, by Product Type, 2025–2035 (USD Million)
Table 183. United Arab Emirates: HDR Display Devices Market, by Type, 2025–2035 (USD Million)
Table 184. United Arab Emirates: HDR Capture Devices Market, by Type, 2025–2035 (USD Million)
Table 185. United Arab Emirates: High Dynamic Range Market, by HDR Format, 2025–2035 (USD Million)
Table 186. United Arab Emirates: High Dynamic Range Market, by Application, 2025–2035 (USD Million)
Table 187. United Arab Emirates: High Dynamic Range Market, by End User, 2025–2035 (USD Million)
Table 188. Rest of Middle East and Africa: High Dynamic Range Market, by Product Type, 2025–2035 (USD Million)
Table 189. Rest of Middle East and Africa: HDR Display Devices Market, by Type, 2025–2035 (USD Million)
Table 190. Rest of Middle East and Africa: HDR Capture Devices Market, by Type, 2025–2035 (USD Million)
Table 191. Rest of Middle East and Africa: High Dynamic Range Market, by HDR Format, 2025–2035 (USD Million)
Table 192. Rest of Middle East and Africa: High Dynamic Range Market, by Application, 2025–2035 (USD Million)
Table 193. Rest of Middle East and Africa: High Dynamic Range Market, by End User, 2025–2035 (USD Million)
List of Figures
Figure 1. Research Process
Figure 2. Secondary Components Referenced for This Study
Figure 3. Primary Research Techniques
Figure 4. Key Executives Interviewed
Figure 5. Breakdown of Primary Interviews (Supply Side & Demand Side)
Figure 6. Market Sizing and Growth Forecast Approach
Figure 7. In 2025, the HDR Display Devices segment to Account for the Largest Share
Figure 8. In 2025, the HDR10 format to Account for the Largest Share
Figure 9. In 2025, the High Dynamic Range Market for Entertainment and Media sector to Account for the Largest Share
Figure 10. Asia-Pacific to be the Fastest-growing Regional Market
Figure 11. Impact Analysis of Market Dynamics
Figure 12. Global High Dynamic Range Market: Porter's Five Forces Analysis
Figure 13. Global High Dynamic Range Market, by Product Type, 2025 Vs. 2035 (USD Million)
Figure 14. Global High Dynamic Range Market, by HDR Format, 2025 Vs. 2035 (USD Million)
Figure 15. Global High Dynamic Range Market, by Application, 2025 Vs. 2035 (USD Million)
Figure 16. Global High Dynamic Range Market, by End User, 2025 Vs. 2035 (USD Million)
Figure 17. Global High Dynamic Range Market, by Region, 2025 Vs. 2035 (USD Million)
Figure 18. North America: High Dynamic Range Market Snapshot (2025)
Figure 19. Europe: High Dynamic Range Market Snapshot (2025)
Figure 20. Asia-Pacific: High Dynamic Range Market Snapshot (2025)
Figure 21. Latin America: High Dynamic Range Market Snapshot (2025)
Figure 22. Middle East and Africa: High Dynamic Range Market Snapshot (2025)
Figure 23. Key Growth Strategies Adopted by Leading Players (2022–2025)
Figure 24. Global High Dynamic Range Market Competitive Benchmarking, by Product Type
Figure 25. Competitive Dashboard: Global High Dynamic Range Market
Figure 26. Global High Dynamic Range Market Share/Ranking, by Key Player, 2024 (%)
Figure 27. Samsung Electronics Co., Ltd.: Financial Overview (2024)
Figure 28. Apple Inc.: Financial Overview (2024)
Figure 29. LG Electronics Inc.: Financial Overview (2024)
Figure 30. Sony Corporation: Financial Overview (2024)
Figure 31. TCL Technology Group Corporation: Financial Overview (2024)


Published Date: Oct-2024
Published Date: Jan-2025
Published Date: May-2024
Published Date: Feb-2026
Subscribe to get the latest industry updates