Resources
About Us
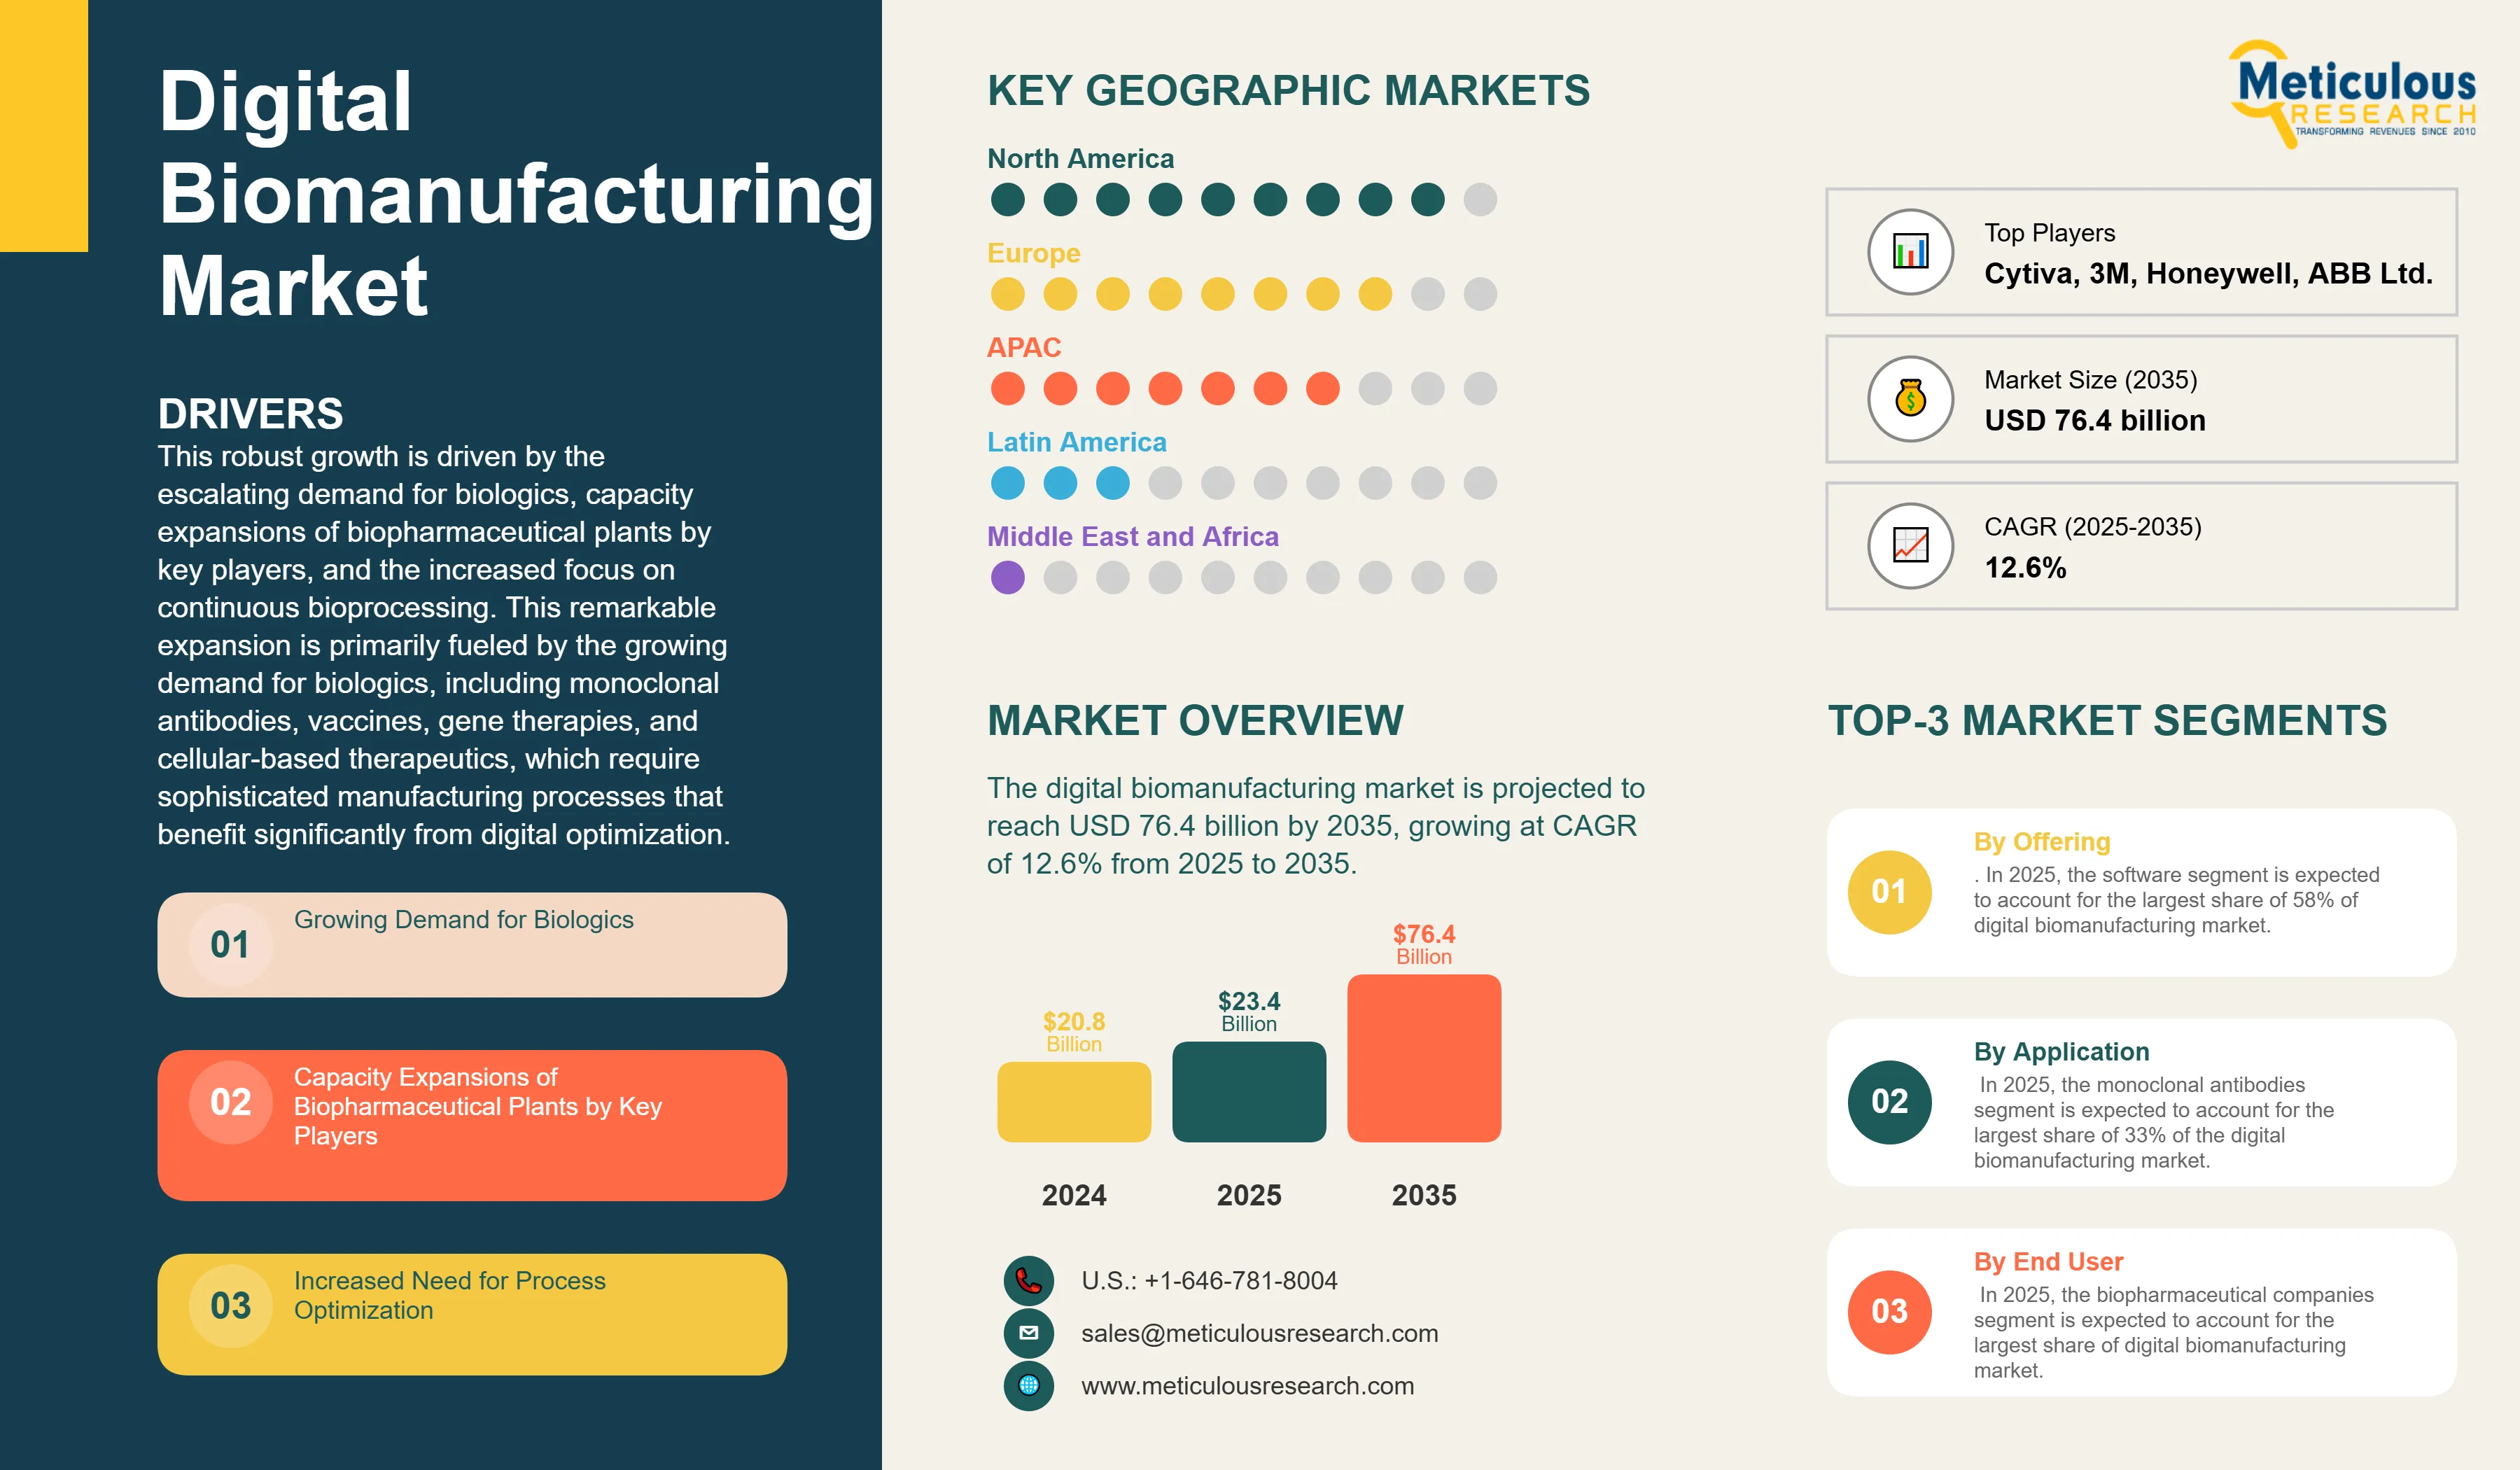
The digital biomanufacturing market is projected to reach USD 76.4 billion by 2035 from an estimated USD 23.4 billion in 2025, growing at CAGR of 12.6% from 2025 to 2035.
This robust growth is driven by the escalating demand for biologics, capacity expansions of biopharmaceutical plants by key players, and the increased focus on continuous bioprocessing. This remarkable expansion is primarily fueled by the growing demand for biologics, including monoclonal antibodies, vaccines, gene therapies, and cellular-based therapeutics, which require sophisticated manufacturing processes that benefit significantly from digital optimization. The shift towards personalized medicine and the rise of advanced therapy medicinal products (ATMPs) further amplify the need for flexible, scalable, and data-driven manufacturing approaches that can adapt to diverse production requirements while maintaining regulatory compliance.
However, the market's growth faces notable challenges. The high cost of technology deployment presents a significant barrier, particularly for smaller biotechnology companies and contract development and manufacturing organizations (CDMOs) operating on limited budgets. Additionally, the complex development and manufacturing processes of biopharmaceuticals, coupled with stringent regulatory requirements, create implementation complexities that require substantial expertise and validation efforts. Integration challenges with existing legacy systems and concerns about data security and intellectual property protection also pose restraints to widespread adoption.
Click here to: Get Free Sample Pages of this Report
Growing Demand for Biologics
The leading factor for digital biomanufacturing adoption is the exponential increase in biologics demand worldwide. Biologic drugs, in particular, monoclonal antibodies, cell and gene therapies, and biosimilars, have become the pillars of the new therapeutic treatments in oncology, immunology, and rare disease areas. Such a demand surge puts a lot of stress on the manufacturing capacity and efficiency of the process.
Through digital technologies, manufacturers are able to scale up their capacity in a more efficient manner without losing quality and consistency of the product. For instance, digital twins give a pharmaceutical company an opportunity to simulate and optimize production scenarios before making physical changes, thus cutting the time required to reach the market and the risks to decrease. Manufacturing Execution Systems (MES) enable the visibility of production workflows in real-time, thus the demand variations can be responded quickly and the resources can be allocated effectively.
Biologics manufacturing process is complicated, which is why it utilizes living cell systems and goes through a complex purification process. Therefore, sophisticated monitoring and control mechanisms are required which traditional manufacturing methods cannot provide. Digitally enabled biomanufacturing platforms give the required vastness and adaptability to meet market demands that keep on changing while guaranteeing therapeutic effect and safety.
Capacity Expansions of Biopharmaceutical Plants by Key Players
Major pharmaceutical industries are pouring a considerable amount of money into developing their biomanufacturing capabilities. One of the main aspects that play a central role in their capacity enhancement initiatives is the use of digital technologies. It is not only about adding to the physical infrastructure but also about building smart, interconnected manufacturing ecosystems that can be versatile and efficient in agriculture.
Use of digital biomanufacturing allows companies to achieve the highest possible utilization of their extended facilities, through advanced process optimization and predictive maintenance made possible by digital technologies. The introduction of Process Analytical Technology (PAT) during plant expansions is essential for quality monitoring and control in real-time, thus lowering the occurrence of batch failures and enhancing overall equipment effectiveness (OEE).
One of the benefits companies get from the adoption of digital solutions in capacity expansion projects is the competitive advantage that encompasses a shorter commissioning period, quicker technology transfer, and better operational flexibility. The companies which thoroughly employ the digital strategies in their direction confess the considerable increase of production yield, the decline of manufacturing costs, and the facilitation of regulatory compliance capabilities.
Need for Process Optimization in Biomanufacturing
Process optimization involves improving manufacturing by incorporating quality monitoring, machinery, and maintenance, among other factors, to optimize costs and increase productivity. The biomanufacturing process is enhanced by process optimization through the identification and resolution of bottlenecks and the assurance of product quality. Process optimization techniques like design of experiments (DoE), statistical process control (SPC), and process analytical technology (PAT), assist biomanufacturers in reducing manufacturing costs and time for the biologics production by incorporating real time monitoring, continuous processing, and data capturing & analysis.
Biomanufacturing is an expensive method due to the need for specific culture conditions, costly media, and feed. The rising preference for biopharmaceuticals is driving the increased need for process optimization to achieve better yield and product quality. Thus, to scale up the business and to meet growing market demand biopharmaceutical manufacturers are increasing the adoption of process optimization techniques.
Digital Biomanufacturing Market Trends
Integration of Artificial Intelligence and Machine Learning
Artificial intelligence and machine learning technologies are increasingly being integrated into biomanufacturing operations to enable autonomous decision-making and continuous process optimization. These technologies analyze vast amounts of manufacturing data to identify patterns, predict outcomes, and recommend process improvements that human operators might not recognize. AI-powered systems can optimize multiple process parameters simultaneously while considering complex interdependencies that traditional control approaches cannot handle effectively.
Machine learning algorithms are being deployed for predictive quality control, where models trained on historical manufacturing data can predict final product quality based on real-time process measurements. This capability enables proactive quality management and reduces the risk of producing out-of-specification products. Advanced AI systems can also predict equipment failures before they occur, enabling predictive maintenance strategies that minimize unplanned downtime and extend equipment life.
Cloud-Based Manufacturing Platforms
The adoption of cloud-based platforms for biomanufacturing is accelerating as companies recognize the benefits of scalable computing resources, enhanced collaboration capabilities, and reduced IT infrastructure costs. Cloud platforms enable real-time data sharing between manufacturing facilities, research laboratories, and corporate headquarters, facilitating improved decision-making and knowledge transfer.
Cloud-based digital twin platforms allow companies to develop and optimize manufacturing processes using scalable computing resources without significant on-premises infrastructure investments. These platforms also enable collaborative process development where multiple teams can contribute to process optimization efforts simultaneously. The availability of cloud-based analytics tools democratizes access to advanced data analysis capabilities across the organization
Digital Biomanufacturing Market Opportunity
Shift Towards Bioprocessing 4.0
The biopharmaceutical industry is shifting towards Bioprocessing 4.0 (a term derived from Industry 4.0), a national strategic initiative launched by the German government in 2010. Biomanufacturing 4.0 is still in its initial stage. Bioprocessing 4.0 is defined as an end-to-end connected bioprocess, where all equipment and systems in the process are connected digitally through the industrial-internet-of-things (IIoT) to run, control, and enhance processes through feedback loops, machine learning, and artificial intelligence (AI). Digital transformation has become necessary in the biopharmaceutical industry as it provides the competitive advantage and opportunity for streamlining the production process. Digital biomanufacturing uses IoT to connect different data sources, equipment, and materials for process optimization. In combination with digital biomanufacturing solutions the adoption of bioprocessing 4.0 is gradually increasing. Many biopharmaceutical manufactures are shifting towards bioprocessing 4.0 to reduce the manual intervention during drug testing and monitoring which saves time and reduces the risk of errors and cross-contamination, thus boosting production.
Digital Biomanufacturing Market Analysis: Key Findings
By Offering: The Software Segment to Dominate the Digital Biomanufacturing Market in 2025
Based on offering, the digital biomanufacturing market is segmented into software and hardware. In 2025, the software segment is expected to account for the largest share of 58% of digital biomanufacturing market. The software segment's dominance is rooted in its position as the fundamental enabler of digital transformation in biomanufacturing operations. It serves as the core intelligence layer that drives process optimization, data analytics, and real-time decision-making across all biomanufacturing processes. This includes sophisticated process analytical technology (PAT) systems, advanced data analysis software, manufacturing execution systems (MES), and cutting-edge digital twin platforms that create virtual replicas of bioprocessing operations.
The software segment is also expected to witness a rapid growth during the forecast period, driven by the continuous evolution of artificial intelligence and machine learning capabilities embedded within these platforms. Modern biomanufacturing software is transitioning from simple monitoring and control systems to intelligent platforms capable of predictive analytics, autonomous process adjustments, and cognitive decision-making.
By Functionality: The Process Optimization & Analytics Segment to Dominate the Digital Biomanufacturing Market in 2025
Based on functionality, the digital biomanufacturing market is segmented into product design, process optimization & analytics, automation & control, and other applications. In 2025, the process optimization & analytics segment is expected to account for the largest share of digital biomanufacturing market. This segment's dominance reflects the critical need for continuous improvement in biomanufacturing processes, where even minor optimizations can result in significant cost savings, yield improvements, and quality enhancements.
Process optimization & analytics encompasses advanced statistical process control, design of experiments (DoE), multivariate data analysis, and machine learning-powered optimization algorithms that continuously analyze process parameters to identify opportunities for improvement. These systems integrate data from multiple sources across the bioprocessing workflow to provide comprehensive insights into process performance, enabling manufacturers to achieve higher product yields, reduce batch-to-batch variability, and minimize production costs while maintaining regulatory compliance.
However, the supply chain & operations management segment is witnessing the fastest growth, with a CAGR of 16.5%, as biomanufacturing companies increasingly recognize the importance of end-to-end visibility and coordination across their global operations. This rapid growth is driven by the complexity of modern biopharmaceutical supply chains, which often involve multiple manufacturing sites, diverse raw material suppliers, and stringent cold-chain requirements.
By Bioprocess: The Upstream Bioprocess Segment to Dominate the Digital Biomanufacturing Market in 2025
Based on bioprocess, the digital biomanufacturing market is segmented into upstream bioprocess and downstream bioprocess. In 2025, the upstream bioprocess segment is expected to account for the largest share of the digital biomanufacturing market. The upstream segment's dominance due to its fundamental role as the foundation of all biomanufacturing operations and its significant impact on overall process economics. Upstream processes directly influence product yield, quality, and consistency, making optimization in this area particularly valuable. The complexity of cell culture processes, with their numerous interdependent variables including pH, dissolved oxygen, temperature, nutrient levels, and metabolite concentrations, creates substantial opportunities for digital optimization. Advanced process analytical technology, real-time monitoring systems, and AI-powered control algorithms can significantly improve cell productivity, reduce contamination risks, and optimize media consumption.
By Application: The Monoclonal Antibodies Segment to Dominate the Digital Biomanufacturing Market in 2025
Based on application, the digital biomanufacturing market is segmented into monoclonal antibodies, recombinant hormones/proteins, vaccines, cellular-based biologics, and gene-based biologics. In 2025, the monoclonal antibodies segment is expected to account for the largest share of 33% of the digital biomanufacturing market. The large share of monoclonal antibodies segment is attributed to the established manufacturing infrastructure, well-understood production processes, and significant commercial value of these products. The complex multi-step production process of monoclonal antibodies, involving cell line development, upstream cell culture, downstream purification, formulation, and fill-finish operations, creates numerous opportunities for digital optimization. The high value and large production volumes of monoclonal antibodies justify substantial investments in advanced digital technologies that can improve yields, reduce production costs, and ensure consistent product quality.
However, the gene-based biologics segment is experiencing the fastest growth, with a CAGR of 17.9%, as this emerging therapeutic modality gains regulatory approval and commercial traction. Gene-based biologics, including gene therapies and viral vectors, represent a rapidly expanding frontier in biopharmaceuticals, with the FDA anticipating approval of 10 to 20 cell and gene therapy products per year by 2025.
By End User: The Biopharmaceutical Companies Segment to Dominate the Digital Biomanufacturing Market in 2025
Based on end-user, the digital biomanufacturing market is segmented into biopharmaceutical companies, academic and research institutes, and CDMO & CROs. In 2025, the biopharmaceutical companies segment is expected to account for the largest share of digital biomanufacturing market. The increasing preference for biopharmaceuticals, increasing research in personalized medicines, and supportive initiatives for the adoption of biopharmaceuticals are supporting the segment’s largest market share. Biopharmaceuticals are typically complex and costlier than the conventional drugs to manufacture. To reduce the errors in manufacturing and scale-up production process, biomanufacturing industries are deploying digital solutions to increase the production of biologics. The increasing number of biopharmaceutical companies along with gradually increasing adoption of digital technologies in biopharmaceutical companies is contributing to the largest share of the segment. For instance, around 55% of companies incorporated digital technologies in the workflow. (Source: Global Pharma Tek, U.S.)
Geographical Analysis
North America to Dominate the Market in 2025
In 2025, North America is expected to account for the largest share of 38% of the digital biomanufacturing market. The large share of this region is attributed to the presence of leading biopharmaceutical companies, advanced technological infrastructure, substantial R&D investments, and supportive regulatory environment. The United States, in particular, hosts numerous biotechnology hubs and maintains a leadership position in biologics development and manufacturing.
North America's established biopharmaceutical ecosystem includes major companies with extensive manufacturing networks, well-developed supply chains, and significant financial resources for technology adoption. The region's regulatory framework, led by the FDA, has been progressive in encouraging the adoption of advanced manufacturing technologies and providing guidance on digital technologies in biomanufacturing. Additionally, the concentration of leading technology providers and consulting firms in North America facilitates rapid adoption and implementation of digital solutions.
However, Asia-Pacific is experiencing the fastest growth, with a CAGR of 16.0%, driven by rapidly expanding biopharmaceutical sectors in countries such as China, India, Japan, and South Korea. The region's growth is fueled by increasing government investments in biotechnology, growing domestic demand for biologics, expanding manufacturing capacity, and the presence of cost-effective CDMOs.
Digital Biomanufacturing Market: Key Companies
The report offers a competitive landscape based on an extensive assessment of the product offerings and geographic presence of leading market players and the key growth strategies adopted by them over the past few years (2023–2025). The key players operating in the global digital biomanufacturing market are GE Healthcare Technologies Inc. (U.S.), Siemens Xcelerator (Subsidiary of Siemens) (Germany), Cytiva (Subsidiary of Danaher corporation) (U.S.), ABB Ltd. (Switzerland), Sanofi S.A. (France), Emerson Electric co. (U.S.), Honeywell International, Inc. (U.S.), SAP SE (Germany), OVO Biomanufacturing Inc. (U.S.), Schneider Electric SE (France), Dassault Systèmes (France), Oracle Corporation (U.S.), and 3M (U.S.).
Digital Biomanufacturing Market Overview: Latest Developments from Key Industry Players
|
Particulars |
Details |
|
Number of Pages |
226 |
|
Format |
|
|
Forecast Period |
2025-2035 |
|
Base Year |
2024 |
|
CAGR |
12.4% |
|
Estimated Market Size (2025) |
$23.4 billion |
|
Forecasted Market Size (2035) |
$76.4 billion |
|
Segments Covered |
Digital Biomanufacturing Market Assessment—by Offering
Digital Biomanufacturing Market Assessment—by Functionality
Digital Biomanufacturing Market Assessment—by Bioprocess
Digital Biomanufacturing Market Assessment—by Application
Digital Biomanufacturing Market Assessment—by End-user
|
|
Countries Covered |
North America (U.S. and Canada), Europe (Germany, France, U.K., Italy, Spain, Switzerland, Denmark, Ireland, Belgium, and Rest of Europe), Asia-Pacific (China, Japan, India, Australia, South Korea, and Rest of Asia-Pacific), Latin America (Brazil, Mexico, Rest of Latin America), and Middle East & Africa. |
|
Key Companies |
The key players operating in the global digital biomanufacturing market are GE Healthcare Technologies Inc. (U.S.), Siemens Xcelerator (subsidiary of Siemens) (Germany), Cytiva (subsidiary of Danaher Corporation) (U.S.), ABB Ltd. (Switzerland), Sanofi S.A. (France), Emerson Electric Co. (U.S.), Honeywell International, Inc. (U.S.), SAP SE (Germany), OVO Biomanufacturing. (U.S.), Schneider Electric SE (France), Dassault Systemes (France), Oracle Corporation (U.S.), and 3M (U.S.). |
The global digital biomanufacturing market report covers the qualitative and quantitative analysis of the digital biomanufacturing market. This report involves the analysis of various segments of digital biomanufacturing such as offering, functionality, bioprocess, and end-user at the regional and country level. The report also provides insights on factors impacting market growth, regulatory analysis, pricing analysis, and Porter’s five forces analysis.
The digital biomanufacturing market is projected to reach USD 76.4 billion by 2035 from an estimated USD 23.4 billion in 2025, growing at CAGR of 12.6% from 2025 to 2035.
Among all the offerings studied in this report, the software segment is expected to account for the largest share of 57% the digital biomanufacturing market in 2025. The rising need for process optimization in the biomanufacturing industry is increasing the demand for software. Software deployment helps in evaluating product and process quality with real time monitoring, data management, and prediction-based outcomes. It helps to streamline the process of biomanufacturing.
The growth of this market can be attributed to several factors such as, growing demand for biologics, capacity expansions of biopharmaceutical plants by key players, increased need for process optimization, increased focus on quality standards & regulatory compliance, strong R&D pipeline for biopharmaceuticals, and rising focus on continuous bioprocessing. However, the excessive cost of technological deployment, complex development, and manufacturing process of biopharmaceuticals are restraining the market growth.
The key players operating in the global digital biomanufacturing market are GE Healthcare Technologies Inc. (U.S.), Siemens Xcelerator (subsidiary of Siemens) (Germany), Cytiva (subsidiary of Danaher Corporation) (U.S.), ABB Ltd. (Switzerland), Sanofi S.A. (France), Emerson Electric co. (U.S.), Honeywell International, Inc. (U.S.), SAP SE (Germany), OVO Biomanufacturing. (U.S.), Schneider Electric SE (France), Dassault Systems (France), Oracle Corporation (U.S.), and 3M (U.S.).
The market in Asia-Pacific is slated to register the highest growth rate of 16.0% during the forecast period. The countries in Asia-Pacific, including China, India, and South Korea, are projected to offer significant growth opportunities for the vendors in this market. This is attributed to factors such as the rising number of biopharmaceutical companies, growing patient population, increasing disposable income, and rising foreign direct investments (FDI) for biopharmaceutical companies.
1. Introduction
1.1. Market Definition & Scope
1.2. Market Ecosystem
1.3. Currency & Limitations
2. Research Methodology
2.1. Research Approach
2.2. Data Collection & Validation
2.2.1. Secondary Research
2.2.2. Primary Research
2.3. Market Assessment
2.3.1. Market Size Estimation
2.3.2. Bottom-Up Approach
2.3.3. Top-Down Approach
2.3.4. Growth forecast
2.4. Assumptions for the Study
3. Executive Summary
3.1. Overview
3.2. Segmental Analysis
3.2.1. Market Analysis, by Offering
3.2.2. Market Analysis, by Functionality
3.2.3. Market Analysis, by Bioprocess
3.2.4. Market Analysis, by Application
3.2.5. Market Analysis, by End-User
3.3. Regional Analysis
3.4. Competitive Analysis
4. Market Insights
4.1. Overview
4.2. Factors Affecting Market Growth
4.2.1. Drivers
4.2.1.1. Growing Demand for Biologics
4.2.1.2. Capacity Expansions of Biopharmaceutical Plants by Key Players
4.2.1.3. Increased Need for Process Optimization
4.2.1.4. Increased Focus on Quality Standards & Regulatory Compliance
4.2.1.5. Strong R&D Pipeline for Biopharmaceuticals
4.2.1.6. Rising Focus on Continuous Bioprocessing
4.2.2. Restraints
4.2.2.1. High Cost of Technology Deployment
4.2.2.2. Complex Development and Manufacturing Process of Biopharmaceuticals
4.2.3. Opportunities
4.2.3.1. Introduction of Industry 4.0
4.2.3.2. Availability of Advanced Data Analysis Tools
4.2.3.3. Shift Towards Bioprocessing 4.0
4.2.4. Challenges
4.2.4.1. Complexities In Process Analytical Technology (Pat) Implementation
4.2.5. Trends
4.2.5.1. Integration of Artificial Intelligence and Machine Learning
4.2.5.2. Cloud-Based Manufacturing Platforms
4.2.5.3. Advanced Process Control and Automation
5. Digital Biomanufacturing Market Assessment - by Offering
5.1. Overview
5.2. Software
5.2.1. Process Analytical Technology (Pat)
5.2.2. Data Analysis Software
5.2.3. Manufacturing Execution System (Mes)
5.2.4. Digital Twin Platforms
5.3. Hardware
5.4. Services
6. Digital Biomanufacturing Market Assessment - by Functionality
6.1. Overview
6.2. Product Design
6.3. Process Optimization & Analytics
6.4. Automation & Control
6.5. Real-Time Quality Monitoring & Compliance
6.6. Supply Chain & Operations Management
6.7. Others (Predictive Maintenance, Sustainability Dashboards)
7. Digital Biomanufacturing Market Assessment - by Bioprocess
7.1. Overview
7.2. Upstream Bioprocessing
7.3. Downstream Bioprocessing
8. Digital Biomanufacturing Market Assessment - by Application
8.1. Overview
8.2. Monoclonal Antibodies (Mabs)
8.3. Recombinant Hormones/Proteins
8.4. Vaccines
8.5. Cellular-Based Biologics
8.6. Gene-Based Biologics
8.7. Biosimilars
8.8. Industrial Biotech (Enzymes, Bio-Based Chemicals, Food & Feed Ingredients)
8.9. Others (Blood Products, Peptides, Oligonucleotides)
9. Digital Biomanufacturing Market Assessment - by End-User
9.1. Overview
9.2. Biopharmaceutical Companies
9.3. Academic and Research Institutes
9.4. CDMOs & CROs
9.5. Food & Industrial Biotech Companies
9.6. Others (Government Labs, Consortia, and Non-Profit Organizations)
10. Digital Biomanufacturing Market Assessment—by Geography
10.1. Overview
10.2. North America
10.2.1. U.S.
10.2.2. Canada
10.3. Europe
10.3.1. Germany
10.3.2. France
10.3.3. U.K.
10.3.4. Italy
10.3.5. Spain
10.3.6. Switzerland
10.3.7. Denmark
10.3.8. Ireland
10.3.9. Belgium
10.3.10. Rest of Europe (RoE)
10.4. Asia-Pacific
10.4.1. Japan
10.4.2. China
10.4.3. India
10.4.4. South Korea
10.4.5. Australia
10.4.6. Rest of Asia-Pacific
10.5. Latin America
10.5.1. Brazil
10.5.2. Mexico
10.5.3. Rest of Latin America (RoLATAM)
10.6. Middle East & Africa
11. Competitive Landscape
11.1. Overview
11.2. Key Growth Strategies
11.3. Competitive Benchmarking
11.4. Competitive Dashboard
11.4.1. Industry Leaders
11.4.2. Market Differentiators
11.4.3. Vanguards
11.4.4. Emerging Companies
11.5. Market Share/Position Analysis
12. Company Profiles
12.1. GE Healthcare Technologies, Inc.
12.1.1. Company Overview
12.1.2. Business Description
12.1.3. Financial Overview
12.1.4. Product Portfolio
12.1.5. SWOT Analysis
12.2. Siemens Xcelerator
12.2.1. Company Overview
12.2.2. Business Description
12.2.3. Financial Overview
12.2.4. Product Portfolio
12.2.5. SWOT Analysis
12.3. Cytiva
12.3.1. Company Overview
12.3.2. Business Description
12.3.3. Financial Overview
12.3.4. Product Portfolio
12.3.5. SWOT Analysis
12.4. ABB Ltd.
12.4.1. Company Overview
12.4.2. Business Description
12.4.3. Financial Overview
12.4.4. Product Portfolio
12.4.5. SWOT Analysis
12.5. Sanofi S.A.
12.5.1. Company Overview
12.5.2. Business Description
12.5.3. Financial Overview
12.5.4. Product Portfolio
12.5.5. SWOT Analysis
12.6. Emerson Electric Co.
12.6.1. Company Overview
12.6.2. Business Description
12.6.3. Financial Overview
12.6.4. Product Portfolio
12.6.5. SWOT Analysis
12.7. Honeywell International, Inc.
12.7.1. Company Overview
12.7.2. Business Description
12.7.3. Financial Overview
12.7.4. Product Portfolio
12.7.5. SWOT Analysis
12.8. SAP SE
12.8.1. Company Overview
12.8.2. Business Description
12.8.3. Financial Overview
12.8.4. Product Portfolio
12.8.5. SWOT Analysis
12.9. Ovo Biomanufacturing Ltd.
12.9.1. Company Overview
12.9.2. Business Description
12.9.3. Financial Overview
12.9.4. Product Portfolio
12.9.5. SWOT Analysis
12.10. Schneider Electric SE
12.10.1. Company Overview
12.10.2. Business Description
12.10.3. Financial Overview
12.10.4. Product Portfolio
12.10.5. SWOT Analysis
12.11. Dassault Systèmes
12.11.1. Company Overview
12.11.2. Business Description
12.11.3. Financial Overview
12.11.4. Product Portfolio
12.11.5. SWOT Analysis
12.12. Oracle Corporation
12.12.1. Company Overview
12.12.2. Business Description
12.12.3. Financial Overview
12.12.4. Product Portfolio
12.12.5. SWOT Analysis
12.13. 3M
12.13.1. Company Overview
12.13.2. Business Description
12.13.3. Financial Overview
12.13.4. Product Portfolio
12.13.5. SWOT Analysis
13. Appendix
13.1. Available Customization
13.2. Related Reports
List of Tables
Table 1 Global Digital Biomanufacturing Market, by Offering, 2023-2035 (USD Million)
Table 2 Global Digital Biomanufacturing Software Market, by Type, 2023-2035 (USD Million)
Table 3 Global Digital Biomanufacturing Software Market, by Region/Country, 2023-2035 (USD Million)
Table 4 Global Process Analytical Technology (PAT) Market, by Region/Country, 2023-2035 (USD Million)
Table 5 Global Data Analysis Software Market, by Region/Country, 2023-2035 (USD Million)
Table 6 Global Manufacturing Execution System (MES) Market, by Region/Country, 2023-2035 (USD Million)
Table 7 Global Digital Twin Platforms Market, by Region/Country, 2023-2035 (USD Million)
Table 8 Global Digital Biomanufacturing Hardware Market, by Region/Country, 2023-2035 (USD Million)
Table 9 Global Digital Biomanufacturing Services Market, by Region/Country, 2023-2035 (USD Million)
Table 10 Global Digital Biomanufacturing Market, by Functionality, 2023-2035 (USD Million)
Table 11 Global Product Design Market, by Region/Country, 2023-2035 (USD Million)
Table 12 Global Process Optimization & Analytics Market, by Region/Country, 2023-2035 (USD Million)
Table 13 Global Automation & Control Market, by Region/Country, 2023-2035 (USD Million)
Table 14 Global Real-Time Quality Monitoring & Compliance Market, by Region/Country, 2023-2035 (USD Million)
Table 15 Global Supply Chain & Operations Management Market, by Region/Country, 2023-2035 (USD Million)
Table 16 Global Others (Predictive Maintenance, Sustainability Dashboards) Market, by Region/Country, 2023-2035 (USD Million)
Table 17 Global Digital Biomanufacturing Market, by Bioprocess, 2023-2035 (USD Million)
Table 18 Global Upstream Bioprocessing Market, by Region/Country, 2023-2035 (USD Million)
Table 19 Global Downstream Bioprocessing Market, by Region/Country, 2023-2035 (USD Million)
Table 20 Global Digital Biomanufacturing Market, by Application, 2023-2035 (USD Million)
Table 21 Global Digital Biomanufacturing Market for Monoclonal Antibodies (Mabs), by Region/Country, 2023-2035 (USD Million)
Table 22 Global Digital Biomanufacturing Market for Recombinant Hormones/Proteins, by Region/Country, 2023-2035 (USD Million)
Table 23 Global Digital Biomanufacturing Market for Vaccines, by Region/Country, 2023-2035 (USD Million)
Table 24 Global Digital Biomanufacturing Market for Cellular-Based Biologics, by Region/Country, 2023-2035 (USD Million)
Table 25 Global Digital Biomanufacturing Market for Gene-Based Biologics, by Region/Country, 2023-2035 (USD Million)
Table 26 Global Digital Biomanufacturing Market for Biosimilars, by Region/Country, 2023-2035 (USD Million)
Table 27 Global Digital Biomanufacturing Market for Industrial Biotech (Enzymes, Bio-Based Chemicals, Food & Feed Ingredients), by Region/Country, 2023-2035 (USD Million)
Table 28 Global Digital Biomanufacturing Market for Others (Blood Products, Peptides, Oligonucleotides), by Region/Country, 2023-2035 (USD Million)
Table 29 Global Digital Biomanufacturing Market, by End-User, 2023-2035 (USD Million)
Table 30 Global Digital Biomanufacturing Market for Biopharmaceutical Companies, by Region/Country, 2023-2035 (USD Million)
Table 31 Global Digital Biomanufacturing Market for Academic and Research Institutes, by Region/Country, 2023-2035 (USD Million)
Table 32 Global Digital Biomanufacturing Market for CDMOs & CROs, by Region/Country, 2023-2035 (USD Million)
Table 33 Global Digital Biomanufacturing Market for Food & Industrial Biotech Companies, by Region/Country, 2023-2035 (USD Million)
Table 34 Global Digital Biomanufacturing Market for Others (Government Labs, Consortia, and Non-Profit Organizations), by Region/Country, 2023-2035 (USD Million)
Table 35 North America: Digital Biomanufacturing Market, by Country, 2023-2035 (USD Million)
Table 36 North America: Digital Biomanufacturing Market, by Offering, 2023–2035 (USD Million)
Table 37 North America: Digital Biomanufacturing Software Market, by Type, 2023–2035 (USD Million)
Table 38 North America: Digital Biomanufacturing Market, by Functionality, 2023–2035 (USD Million)
Table 39 North America: Digital Biomanufacturing Market, by Bioprocess, 2023–2035 (USD Million)
Table 40 North America: Digital Biomanufacturing Market, by Application, 2023–2035 (USD Million)
Table 41 North America: Digital Biomanufacturing Market, by End User, 2023–2035 (USD Million)
Table 42 U.S.: Digital Biomanufacturing Market, by Offering, 2023–2035 (USD Million)
Table 43 U.S.: Digital Biomanufacturing Software Market, by Type, 2023–2035 (USD Million)
Table 44 U.S.: Digital Biomanufacturing Market, by Functionality, 2023–2035 (USD Million)
Table 45 U.S.: Digital Biomanufacturing Market, by Bioprocess, 2023–2035 (USD Million)
Table 46 U.S.: Digital Biomanufacturing Market, by Application, 2023–2035 (USD Million)
Table 47 U.S.: Digital Biomanufacturing Market, by End User, 2023–2035 (USD Million)
Table 48 Canada: Digital Biomanufacturing Market, by Offering, 2023–2035 (USD Million)
Table 49 Canada: Digital Biomanufacturing Software Market, by Type, 2023–2035 (USD Million)
Table 50 Canada: Digital Biomanufacturing Market, by Functionality, 2023–2035 (USD Million)
Table 51 Canada: Digital Biomanufacturing Market, by Bioprocess, 2023–2035 (USD Million)
Table 52 Canada: Digital Biomanufacturing Market, by Application, 2023–2035 (USD Million)
Table 53 Canada: Digital Biomanufacturing Market, by End User, 2023–2035 (USD Million)
Table 54 Europe: Digital Biomanufacturing Market, by Country/Region, 2023–2035 (USD Million)
Table 55 Europe: Digital Biomanufacturing Market, by Offering, 2023–2035 (USD Million)
Table 56 Europe: Digital Biomanufacturing Software Market, by Type, 2023–2035 (USD Million)
Table 57 Europe: Digital Biomanufacturing Market, by Functionality, 2023–2035 (USD Million)
Table 58 Europe: Digital Biomanufacturing Market, by Bioprocess, 2023–2035 (USD Million)
Table 59 Europe: Digital Biomanufacturing Market, by Application, 2023–2035 (USD Million)
Table 60 Europe: Digital Biomanufacturing Market, by End User, 2023–2035 (USD Million)
Table 61 Germany: Digital Biomanufacturing Market, by Offering, 2023–2035 (USD Million)
Table 62 Germany: Digital Biomanufacturing Software Market, by Type, 2023–2035 (USD Million)
Table 63 Germany: Digital Biomanufacturing Market, by Functionality, 2023–2035 (USD Million)
Table 64 Germany: Digital Biomanufacturing Market, by Bioprocess, 2023–2035 (USD Million)
Table 65 Germany: Digital Biomanufacturing Market, by Application, 2023–2035 (USD Million)
Table 66 Germany: Digital Biomanufacturing Market, by End User, 2023–2035 (USD Million)
Table 67 France: Digital Biomanufacturing Market, by Offering, 2023–2035 (USD Million)
Table 68 France: Digital Biomanufacturing Software Market, by Type, 2023–2035 (USD Million)
Table 69 France: Digital Biomanufacturing Market, by Functionality, 2023–2035 (USD Million)
Table 70 France: Digital Biomanufacturing Market, by Bioprocess, 2023–2035 (USD Million)
Table 71 France: Digital Biomanufacturing Market, by Application, 2023–2035 (USD Million)
Table 72 France: Digital Biomanufacturing Market, by End User, 2023–2035 (USD Million)
Table 73 U.K.: Digital Biomanufacturing Market, by Offering, 2023–2035 (USD Million)
Table 74 U.K.: Digital Biomanufacturing Software Market, by Type, 2023–2035 (USD Million)
Table 75 U.K.: Digital Biomanufacturing Market, by Functionality, 2023–2035 (USD Million)
Table 76 U.K.: Digital Biomanufacturing Market, by Bioprocess, 2023–2035 (USD Million)
Table 77 U.K.: Digital Biomanufacturing Market, by Application, 2023–2035 (USD Million)
Table 78 U.K.: Digital Biomanufacturing Market, by End User, 2023–2035 (USD Million)
Table 79 Italy: Digital Biomanufacturing Market, by Offering, 2023–2035 (USD Million)
Table 80 Italy: Digital Biomanufacturing Software Market, by Type, 2023–2035 (USD Million)
Table 81 Italy: Digital Biomanufacturing Market, by Functionality, 2023–2035 (USD Million)
Table 82 Italy: Digital Biomanufacturing Market, by Bioprocess, 2023–2035 (USD Million)
Table 83 Italy: Digital Biomanufacturing Market, by Application, 2023–2035 (USD Million)
Table 84 Italy: Digital Biomanufacturing Market, by End User, 2023–2035 (USD Million)
Table 85 Spain: Digital Biomanufacturing Market, by Offering, 2023–2035 (USD Million)
Table 86 Spain: Digital Biomanufacturing Software Market, by Type, 2023–2035 (USD Million)
Table 87 Spain: Digital Biomanufacturing Market, by Functionality, 2023–2035 (USD Million)
Table 88 Spain: Digital Biomanufacturing Market, by Bioprocess, 2023–2035 (USD Million)
Table 89 Spain: Digital Biomanufacturing Market, by Application, 2023–2035 (USD Million)
Table 90 Spain: Digital Biomanufacturing Market, by End User, 2023–2035 (USD Million)
Table 91 Switzerland: Digital Biomanufacturing Market, by Offering, 2023–2035 (USD Million)
Table 92 Switzerland: Digital Biomanufacturing Software Market, by Type, 2023–2035 (USD Million)
Table 93 Switzerland: Digital Biomanufacturing Market, by Functionality, 2023–2035 (USD Million)
Table 94 Switzerland: Digital Biomanufacturing Market, by Bioprocess, 2023–2035 (USD Million)
Table 95 Switzerland: Digital Biomanufacturing Market, by Application, 2023–2035 (USD Million)
Table 96 Switzerland: Digital Biomanufacturing Market, by End User, 2023–2035 (USD Million)
Table 97 Denmark: Digital Biomanufacturing Market, by Offering, 2023–2035 (USD Million)
Table 98 Denmark: Digital Biomanufacturing Software Market, by Type, 2023–2035 (USD Million)
Table 99 Denmark: Digital Biomanufacturing Market, by Functionality, 2023–2035 (USD Million)
Table 100 Denmark: Digital Biomanufacturing Market, by Bioprocess, 2023–2035 (USD Million)
Table 101 Denmark: Digital Biomanufacturing Market, by Application, 2023–2035 (USD Million)
Table 102 Denmark: Digital Biomanufacturing Market, by End User, 2023–2035 (USD Million)
Table 103 Ireland: Digital Biomanufacturing Market, by Offering, 2023–2035 (USD Million)
Table 104 Ireland: Digital Biomanufacturing Software Market, by Type, 2023–2035 (USD Million)
Table 105 Ireland: Digital Biomanufacturing Market, by Functionality, 2023–2035 (USD Million)
Table 106 Ireland: Digital Biomanufacturing Market, by Bioprocess, 2023–2035 (USD Million)
Table 107 Ireland: Digital Biomanufacturing Market, by Application, 2023–2035 (USD Million)
Table 108 Ireland: Digital Biomanufacturing Market, by End User, 2023–2035 (USD Million)
Table 109 Belgium: Digital Biomanufacturing Market, by Offering, 2023–2035 (USD Million)
Table 110 Belgium: Digital Biomanufacturing Software Market, by Type, 2023–2035 (USD Million)
Table 111 Belgium: Digital Biomanufacturing Market, by Functionality, 2023–2035 (USD Million)
Table 112 Belgium: Digital Biomanufacturing Market, by Bioprocess, 2023–2035 (USD Million)
Table 113 Belgium: Digital Biomanufacturing Market, by Application, 2023–2035 (USD Million)
Table 114 Belgium: Digital Biomanufacturing Market, by End User, 2023–2035 (USD Million)
Table 115 Rest of Europe: Digital Biomanufacturing Market, by Offering, 2023–2035 (USD Million)
Table 116 Rest of Europe: Digital Biomanufacturing Software Market, by Type, 2023–2035 (USD Million)
Table 117 Rest of Europe: Digital Biomanufacturing Market, by Functionality, 2023–2035 (USD Million)
Table 118 Rest of Europe: Digital Biomanufacturing Market, by Bioprocess, 2023–2035 (USD Million)
Table 119 Rest of Europe: Digital Biomanufacturing Market, by Application, 2023–2035 (USD Million)
Table 120 Rest of Europe: Digital Biomanufacturing Market, by End User, 2023–2035 (USD Million)
Table 121 Asia-Pacific: Digital Biomanufacturing Market, by Country/Region, 2023–2035 (USD Million)
Table 122 Asia-Pacific: Digital Biomanufacturing Market, by Offering, 2023–2035 (USD Million)
Table 123 Asia-Pacific: Digital Biomanufacturing Software Market, by Type, 2023–2035 (USD Million)
Table 124 Asia-Pacific: Digital Biomanufacturing Market, by Functionality, 2023–2035 (USD Million)
Table 125 Asia-Pacific: Digital Biomanufacturing Market, by Bioprocess, 2023–2035 (USD Million)
Table 126 Asia-Pacific: Digital Biomanufacturing Market, by Application, 2023–2035 (USD Million)
Table 127 Asia-Pacific: Digital Biomanufacturing Market, by End User, 2023–2035 (USD Million)
Table 128 Japan: Digital Biomanufacturing Market, by Offering, 2023–2035 (USD Million)
Table 129 Japan: Digital Biomanufacturing Software Market, by Type, 2023–2035 (USD Million)
Table 130 Japan: Digital Biomanufacturing Market, by Functionality, 2023–2035 (USD Million)
Table 131 Japan: Digital Biomanufacturing Market, by Bioprocess, 2023–2035 (USD Million)
Table 132 Japan: Digital Biomanufacturing Market, by Application, 2023–2035 (USD Million)
Table 133 Japan: Digital Biomanufacturing Market, by End User, 2023–2035 (USD Million)
Table 134 China: Digital Biomanufacturing Market, by Offering, 2023–2035 (USD Million)
Table 135 China: Digital Biomanufacturing Software Market, by Type, 2023–2035 (USD Million)
Table 136 China: Digital Biomanufacturing Market, by Functionality, 2023–2035 (USD Million)
Table 137 China: Digital Biomanufacturing Market, by Bioprocess, 2023–2035 (USD Million)
Table 138 China: Digital Biomanufacturing Market, by Application, 2023–2035 (USD Million)
Table 139 China: Digital Biomanufacturing Market, by End User, 2023–2035 (USD Million)
Table 140 India: Digital Biomanufacturing Market, by Offering, 2023–2035 (USD Million)
Table 141 India: Digital Biomanufacturing Software Market, by Type, 2023–2035 (USD Million)
Table 142 India: Digital Biomanufacturing Market, by Functionality, 2023–2035 (USD Million)
Table 143 India: Digital Biomanufacturing Market, by Bioprocess, 2023–2035 (USD Million)
Table 144 India: Digital Biomanufacturing Market, by Application, 2023–2035 (USD Million)
Table 145 India: Digital Biomanufacturing Market, by End User, 2023–2035 (USD Million)
Table 146 South Korea: Digital Biomanufacturing Market, by Offering, 2023–2035 (USD Million)
Table 147 South Korea: Digital Biomanufacturing Software Market, by Type, 2023–2035 (USD Million)
Table 148 South Korea: Digital Biomanufacturing Market, by Functionality, 2023–2035 (USD Million)
Table 149 South Korea: Digital Biomanufacturing Market, by Bioprocess, 2023–2035 (USD Million)
Table 150 South Korea: Digital Biomanufacturing Market, by Application, 2023–2035 (USD Million)
Table 151 South Korea: Digital Biomanufacturing Market, by End User, 2023–2035 (USD Million)
Table 152 Australia: Digital Biomanufacturing Market, by Offering, 2023–2035 (USD Million)
Table 153 Australia: Digital Biomanufacturing Software Market, by Type, 2023–2035 (USD Million)
Table 154 Australia: Digital Biomanufacturing Market, by Functionality, 2023–2035 (USD Million)
Table 155 Australia: Digital Biomanufacturing Market, by Bioprocess, 2023–2035 (USD Million)
Table 156 Australia: Digital Biomanufacturing Market, by Application, 2023–2035 (USD Million)
Table 157 Australia: Digital Biomanufacturing Market, by End User, 2023–2035 (USD Million)
Table 158 Rest of Asia Pacific: Digital Biomanufacturing Market, by Offering, 2023–2035 (USD Million)
Table 159 Rest of Asia Pacific: Digital Biomanufacturing Software Market, by Type, 2023–2035 (USD Million)
Table 160 Rest of Asia Pacific: Digital Biomanufacturing Market, by Functionality, 2023–2035 (USD Million)
Table 161 Rest of Asia Pacific: Digital Biomanufacturing Market, by Bioprocess, 2023–2035 (USD Million)
Table 162 Rest of Asia Pacific: Digital Biomanufacturing Market, by Application, 2023–2035 (USD Million)
Table 163 Rest of Asia Pacific: Digital Biomanufacturing Market, by End User, 2023–2035 (USD Million)
Table 164 Latin America: Digital Biomanufacturing Market, by Country/Region, 2023–2035 (USD Million)
Table 165 Latin America: Digital Biomanufacturing Market, by Offering, 2023–2035 (USD Million)
Table 166 Latin America: Digital Biomanufacturing Software Market, by Type, 2023–2035 (USD Million)
Table 167 Latin America: Digital Biomanufacturing Market, by Functionality, 2023–2035 (USD Million)
Table 168 Latin America: Digital Biomanufacturing Market, by Bioprocess, 2023–2035 (USD Million)
Table 169 Latin America: Digital Biomanufacturing Market, by Application, 2023–2035 (USD Million)
Table 170 Latin America: Digital Biomanufacturing Market, by End User, 2023–2035 (USD Million)
Table 171 Brazil: Digital Biomanufacturing Market, by Offering, 2023–2035 (USD Million)
Table 172 Brazil: Digital Biomanufacturing Software Market, by Type, 2023–2035 (USD Million)
Table 173 Brazil: Digital Biomanufacturing Market, by Functionality, 2023–2035 (USD Million)
Table 174 Brazil: Digital Biomanufacturing Market, by Bioprocess, 2023–2035 (USD Million)
Table 175 Brazil: Digital Biomanufacturing Market, by Application, 2023–2035 (USD Million)
Table 176 Brazil: Digital Biomanufacturing Market, by End User, 2023–2035 (USD Million)
Table 177 Mexico: Digital Biomanufacturing Market, by Offering, 2023–2035 (USD Million)
Table 178 Mexico: Digital Biomanufacturing Software Market, by Type, 2023–2035 (USD Million)
Table 179 Mexico: Digital Biomanufacturing Market, by Functionality, 2023–2035 (USD Million)
Table 180 Mexico: Digital Biomanufacturing Market, by Bioprocess, 2023–2035 (USD Million)
Table 181 Mexico: Digital Biomanufacturing Market, by Application, 2023–2035 (USD Million)
Table 182 Mexico: Digital Biomanufacturing Market, by End User, 2023–2035 (USD Million)
Table 183 Rest of Latin America: Digital Biomanufacturing Market, by Offering, 2023–2035 (USD Million)
Table 184 Rest of Latin America: Digital Biomanufacturing Software Market, by Type, 2023–2035 (USD Million)
Table 185 Rest of Latin America: Digital Biomanufacturing Market, by Functionality, 2023–2035 (USD Million)
Table 186 Rest of Latin America: Digital Biomanufacturing Market, by Bioprocess, 2023–2035 (USD Million)
Table 187 Rest of Latin America: Digital Biomanufacturing Market, by Application, 2023–2035 (USD Million)
Table 188 Rest of Latin America: Digital Biomanufacturing Market, by End User, 2023–2035 (USD Million)
Table 189 Middle East & Africa: Digital Biomanufacturing Market, by Offering, 2023–2035 (USD Million)
Table 190 Middle East & Africa: Digital Biomanufacturing Software Market, by Type, 2023–2035 (USD Million)
Table 191 Middle East & Africa: Digital Biomanufacturing Market, by Functionality, 2023–2035 (USD Million)
Table 192 Middle East & Africa: Digital Biomanufacturing Market, by Bioprocess, 2023–2035 (USD Million)
Table 193 Middle East & Africa: Digital Biomanufacturing Market, by Application, 2023–2035 (USD Million)
Table 194 Middle East & Africa: Digital Biomanufacturing Market, by End User, 2023–2035 (USD Million)
Table 195 Number of Recent Developments, by Company, 2022-2025
Table 196 Key Strategic Developments, by Company, 2022-2025
List of Figures
Figure 1 Research Process
Figure 2 Key Secondary Sources
Figure 3 Primary Research Techniques
Figure 4 Key Executives Interviewed
Figure 5 Breakdown of Primary Interviews (Supply-Side & Demand-Side)
Figure 6 Market Sizing and Growth Forecast Approach
Figure 7 In 2025, the Software Segment is Expected to Dominate the Digital Biomanufacturing Market
Figure 8 In 2025, the Process Optimization & Analytics Segment is Expected to Dominate the Digital Biomanufacturing Market
Figure 9 In 2025, the Upstream Bioprocessing Segment is Expected to Dominate the Digital Biomanufacturing Market
Figure 10 In 2025, the Monoclonal Antibodies Segment is Expected to Dominate the Digital Biomanufacturing Market
Figure 11 In 2025, the Biopharmaceutical Companies Segment is Expected to Dominate the Digital Biomanufacturing Market
Figure 12 Digital Biomanufacturing Market, by Region, 2025 Vs. 2032
Figure 13 Factors Affecting Market Growth
Figure 14 Global Digital Biomanufacturing Market, by Offering, 2025 Vs. 2035 (USD Million)
Figure 15 Global Digital Biomanufacturing Market, by Functionality, 2025 Vs. 2035 (USD Million)
Figure 16 Global Digital Biomanufacturing Market, by Bioprocess, 2025 Vs. 2035 (USD Million)
Figure 17 Global Digital Biomanufacturing Market, by Application, 2025 Vs. 2035 (USD Million)
Figure 18 Global Digital Biomanufacturing Market, by End-User, 2025 Vs. 2035 (USD Million)
Figure 19 Global Digital Biomanufacturing Market, by Region, 2025 Vs. 2035 (USD Million)
Figure 20 North America: Digital Biomanufacturing Market Snapshot
Figure 21 Europe: Digital Biomanufacturing Market Snapshot
Figure 22 Asia-Pacific: Digital Biomanufacturing Market Snapshot
Figure 23 Latin America: Digital Biomanufacturing Market Snapshot
Figure 24 Middle East & Africa: Digital Biomanufacturing Market Snapshot
Figure 25 Key Growth Strategies Adopted by Leading Players, 2022-2025
Figure 26 Digital Biomanufacturing Market: Competitive Benchmarking, by Region
Figure 27 Competitive Dashboard: Digital Biomanufacturing Market
Figure 28 Digital Biomanufacturing Market Position Analysis, 2024
Figure 29 SWOT Analysis - GE Healthcare Technologies, Inc.
Figure 30 SWOT Analysis - Siemens Xcelerator
Figure 31 SWOT Analysis - Cytiva
Figure 32 SWOT Analysis – ABB Ltd.
Figure 33 SWOT Analysis – Sanofi S.A.
Figure 34 SWOT Analysis - Emerson Electric Co.
Figure 35 SWOT Analysis - Honeywell International, Inc.
Figure 36 SWOT Analysis – SAP SE
Figure 37 SWOT Analysis - OVO Biomanufacturing Ltd.
Figure 38 SWOT Analysis - Schneider Electric SE
Figure 39 SWOT Analysis - Dassault Systèmes
Figure 40 SWOT Analysis - Oracle Corporation
Figure 41 SWOT Analysis – 3M


Published Date: May-2026
Published Date: May-2026
Published Date: May-2024
Published Date: Jul-2024
Published Date: Nov-2022
Subscribe to get the latest industry updates