Resources
About Us
This report examines the global market for dairy alternatives, focusing on how manufacturers and solution providers are responding to the rising incidence of lactose intolerance and dairy allergies, growing health consciousness, environmental sustainability concerns, and the increasing adoption of vegan and plant-based diets worldwide. It offers a strategic evaluation of market dynamics, forecasts growth through 2035, and assesses competitive positioning at both global and regional/country levels.
Key Market Drivers & Trends and Insights
Click here to: Get Free Sample Pages of this Report
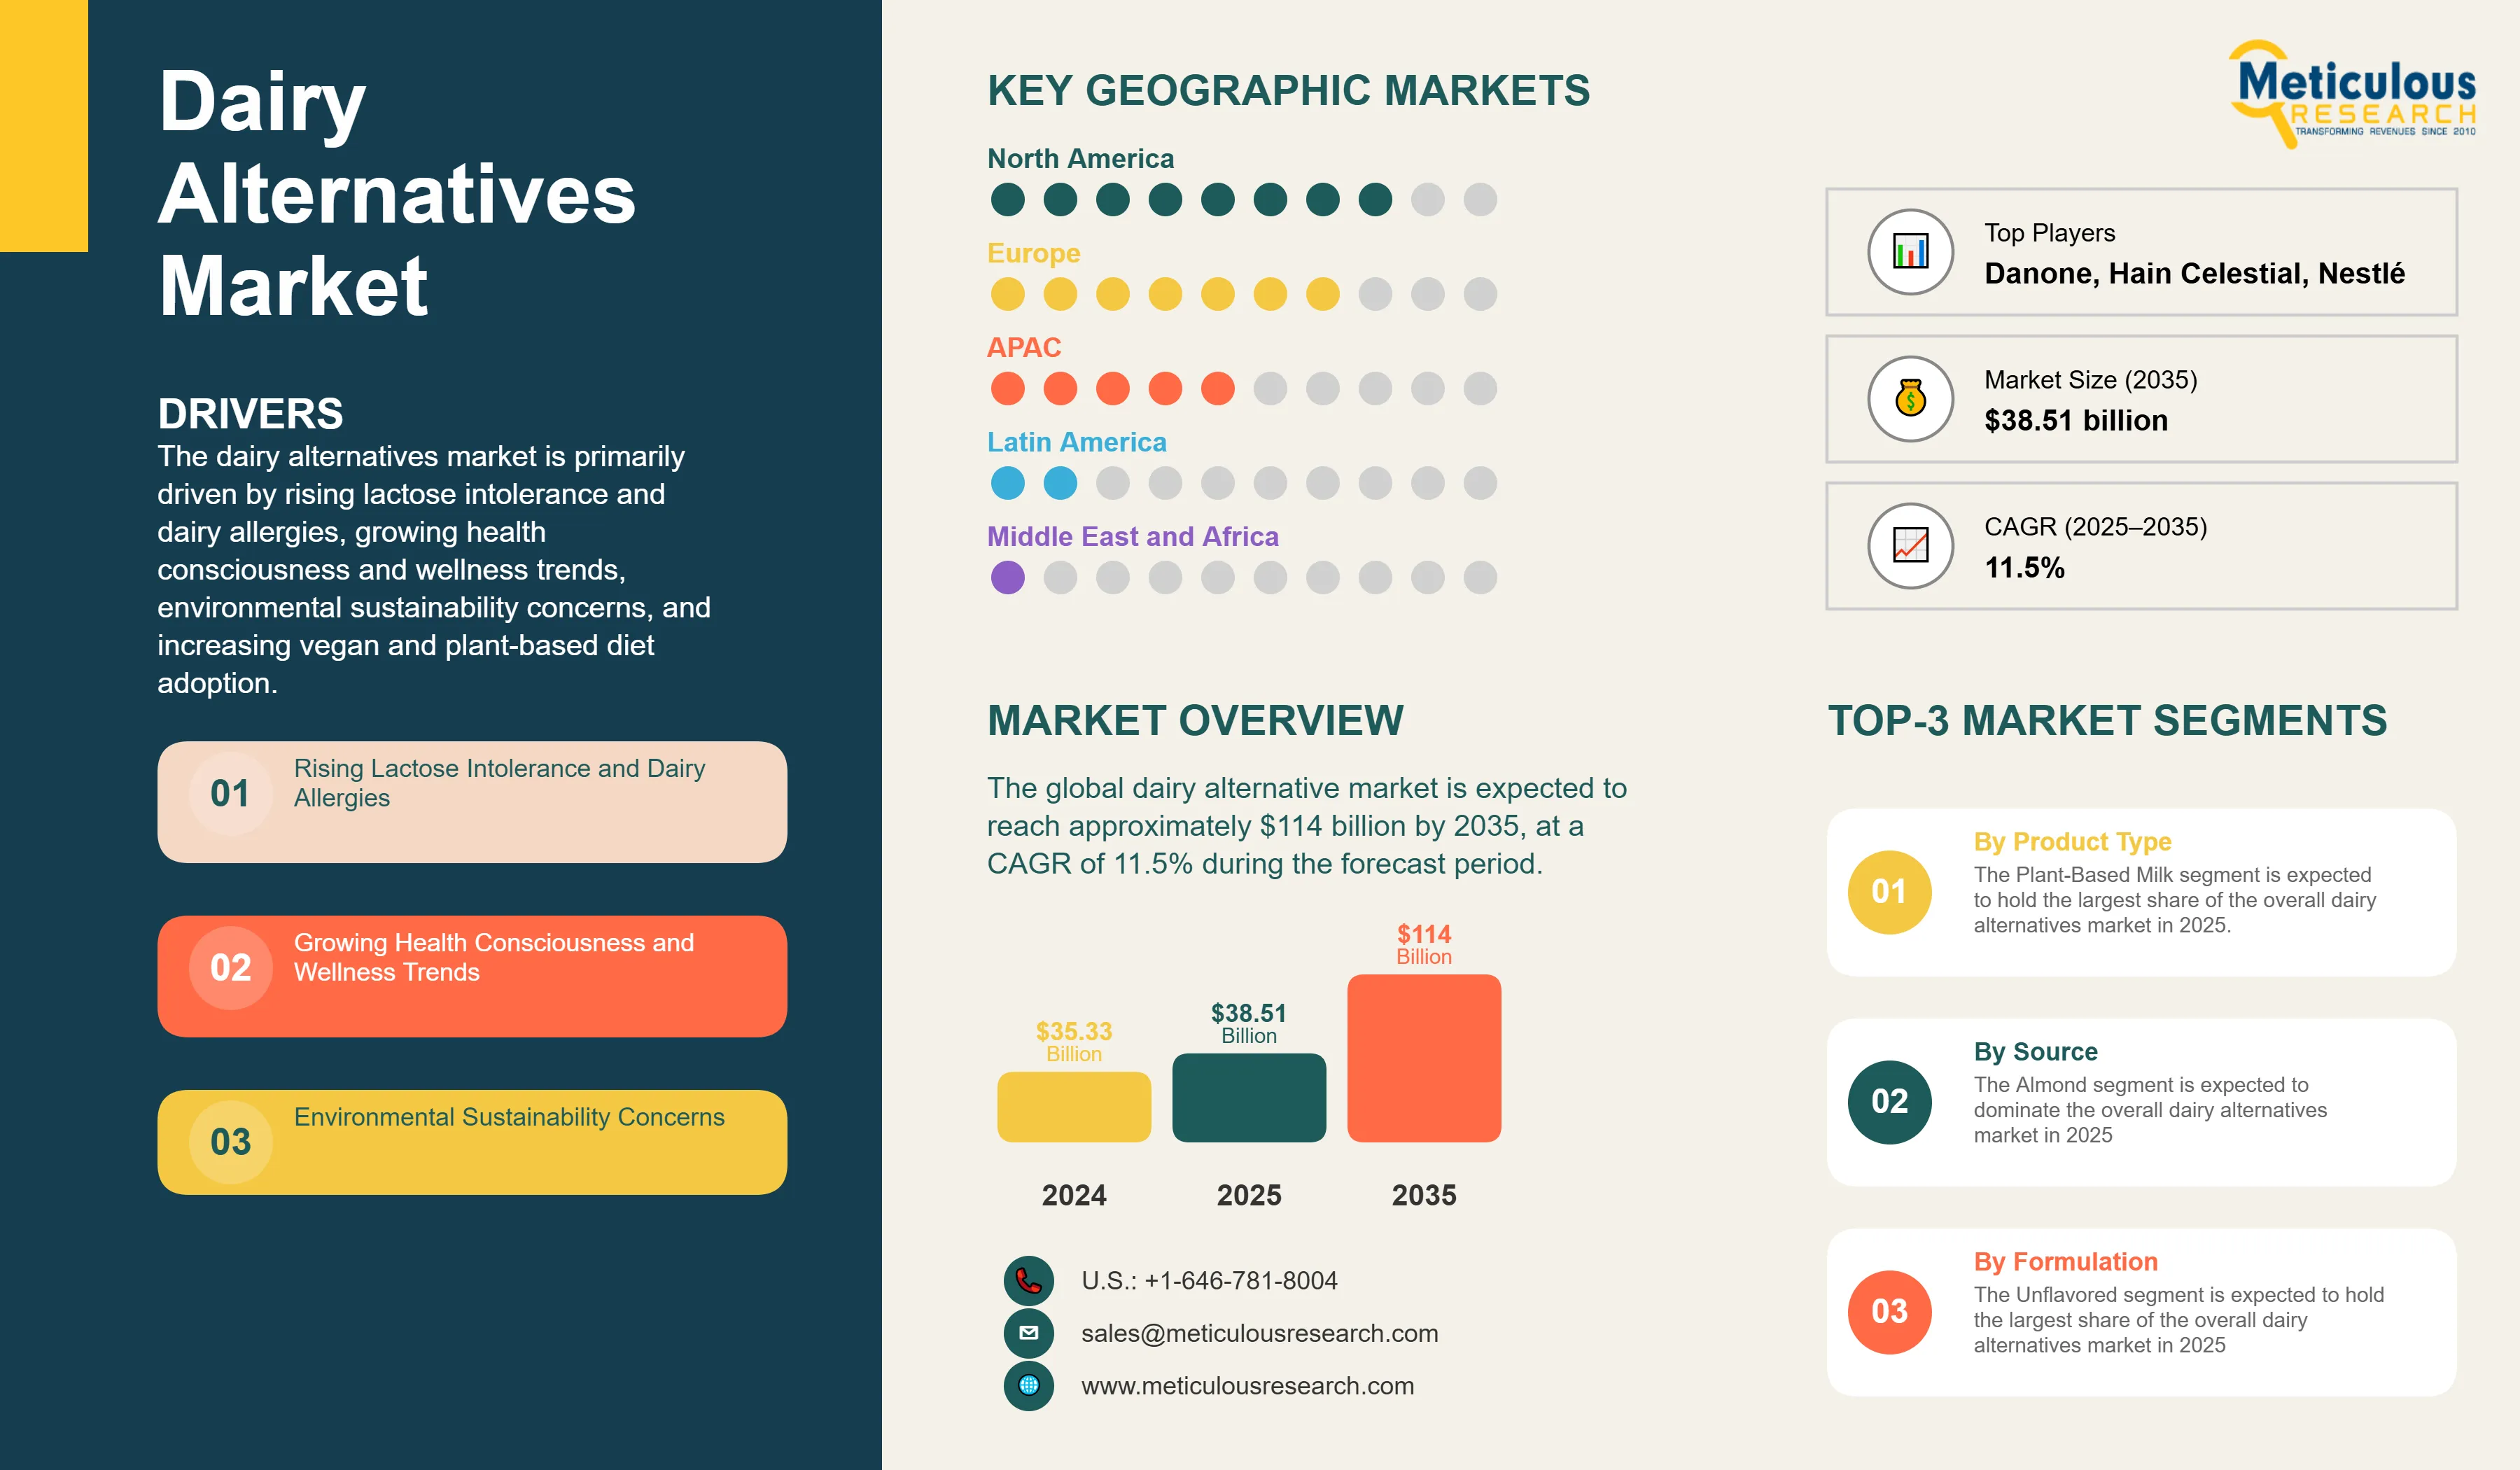
The dairy alternatives market is primarily driven by rising lactose intolerance and dairy allergies, growing health consciousness and wellness trends, environmental sustainability concerns, and increasing vegan and plant-based diet adoption. Product innovation and taste improvements are reshaping the industry, while premium and organic product lines, protein-enriched alternatives, and barista-quality products for coffee applications are gaining significant traction. Additionally, sustainable packaging solutions and the expansion of functional and fortified product development are further driving market growth, especially in developed markets with established retail infrastructure.
Key Challenges
Although the dairy alternatives market holds substantial growth potential, it encounters several challenges such as higher costs compared to conventional dairy products, taste and texture acceptance challenges, and nutritional content variations. Furthermore, hurdles like limited shelf life of some products, regulatory labeling requirements, supply chain complexity, and raw material price volatility pose significant barriers that could hinder market adoption in different parts of the world.
Growth Opportunities
The dairy alternatives market presents numerous avenues for high growth. Emerging markets offer substantial expansion opportunities for market players looking to reach new customer bases. Functional and fortified product development provides another key opportunity, enhancing the nutritional profile and appeal of dairy alternatives. Moreover, food service industry penetration and private label market growth are generating new revenue streams for solution providers as organizations seek efficient alternatives to conventional dairy products. The expansion of dairy alternatives in B2B channels, particularly through food services and hospitality sectors, institutional buyers, and food and beverage manufacturers, presents significant opportunities for bulk sales and ingredient applications.
Market Segmentation Highlights
By Product Type
The Plant-Based Milk segment is expected to hold the largest share of the overall dairy alternatives market in 2025, with oat milk and almond milk leading the category due to their superior taste profiles and growing consumer acceptance across the globe. However, the Cheese segment is expected to grow at the fastest CAGR during the forecast period, driven by continuous product innovations, improved taste and texture, and increasing applications in foodservice and retail sectors.
By Source
The Almond segment is expected to dominate the overall dairy alternatives market in 2025, primarily due to its established market presence and wide consumer acceptance. However, the Oat segment is expected to grow at the fastest CAGR through the forecast period, driven by its superior taste profile, creamy texture, and sustainability credentials that resonate with environmentally conscious consumers.
By Formulation
The Unflavored segment is expected to hold the largest share of the overall dairy alternatives market in 2025, due to its versatility in various applications and consumer preference for natural products. However, the Flavored segment is expected to experience the fastest growth rate during the forecast period, driven by increasing consumer demand for variety, improved taste profiles, and innovative flavor combinations.
Distribution Channel
The Business-to-Consumer (B2C) segment through Modern Groceries is expected to hold the largest share of the overall dairy alternatives market in 2025, due to the widespread availability and consumer shopping preferences. Within the B2B segment, Food Services and Hospitality is expected to dominate, driven by increasing adoption of dairy alternatives in restaurants, cafes, and hotels to cater to diverse dietary preferences. However, the Online Retail Stores segment within B2C is expected to experience the fastest growth rate during the forecast period, followed by Food and Beverage Manufacturers in the B2B segment, driven by expanding e-commerce infrastructure and growing use of dairy alternatives as ingredients in processed foods respectively.
By Geography
North America is expected to hold the largest share of the global dairy alternatives market in 2025, driven by high consumer awareness about health and wellness, established retail infrastructure, strong adoption of plant-based diets, and significant investments in product innovation. Additionally, favorable regulatory environment and high disposable income contribute significantly to market dominance. Europe follows as the second-largest market, bolstered by strong sustainability focus and increasing environmental consciousness. However, Asia-Pacific is witnessing the fastest growth rate during the forecast period, primarily driven by expanding middle-class population, growing awareness about lactose intolerance, rising disposable income, and the advantages dairy alternatives offer in addressing traditional dietary restrictions.
Competitive Landscape
The global dairy alternatives market is characterized by a diverse competitive environment, comprising established food and beverage manufacturers, specialized plant-based product companies, dairy industry leaders diversifying their portfolios, and innovative startups, each adopting unique approaches to advancing dairy alternative technologies and products.
Within this landscape, solution providers are segmented into industry leaders, market differentiators, vanguards, and emerging companies, with each group implementing distinct strategies to sustain their competitive edge. Leading companies are prioritizing integrated product portfolios that merge traditional dairy expertise with innovative plant-based solutions, while also addressing consumer preferences specific to various regions.
Key Players
The key players operating in the global dairy alternatives market are Danone S.A., Hain Celestial Group, Inc., Sahmyook Foods, Sanitarium Health and Wellbeing Company, Axiom Foods, Inc., Daiya Foods, Inc. (A Part of Otsuka Pharmaceutical Co., Ltd.), Earth's Own Food Company Inc., SunOpta Inc., Valsoia S.p.A., Plamil Foods Ltd., Nestlé S.A., Oatly Group AB, Sunrise Soy Foods, Miyoko's Creamery, Blue Diamond Growers, among others.
|
Particulars |
Details |
|
Number of Pages |
250 |
|
Format |
PDF & Excel |
|
Forecast Period |
2025–2035 |
|
Base Year |
2024 |
|
CAGR (Value) |
11.5% |
|
Market Size (Value) in 2025 |
USD 38.51 Billion |
|
Market Size (Value) in 2035 |
USD 114 Billion |
|
Segments Covered |
Market Assessment, by Product Type
Market Assessment, by Source
Market Assessment, by Formulation
Market Assessment, by Distribution Channel
|
|
Countries Covered |
North America (U.S., Canada), Europe (Germany, U.K., France, Italy, Spain, Netherlands, Belgium, Austria, Poland, Portugal, Rest of Europe), Asia-Pacific (China, Japan, India, Australia, Thailand, South Korea, Rest of Asia-Pacific), Latin America (Brazil, Mexico, Argentina, Rest of Latin America), Middle East & Africa |
|
Key Companies |
Danone S.A., Hain Celestial Group, Inc., Sahmyook Foods, Sanitarium Health and Wellbeing Company, Axiom Foods, Inc., Daiya Foods, Inc., Earth's Own Food Company Inc., SunOpta Inc., Valsoia S.p.A., Plamil Foods Ltd., Nestlé S.A., Oatly Group AB, Sunrise Soy Foods, Miyoko's Creamery, Blue Diamond Growers |
The global dairy alternative market size was valued at USD 35.33 billion in 2024 and is expected to reach approximately USD 114 billion by 2035, growing from an estimated USD 38.51 billion in 2025, at a CAGR of 11.5% during the forecast period of 2025–2035.
The global dairy alternative market is expected to grow at a CAGR of 11.5% during the forecast period of 2025–2035, driven by increasing health consciousness, environmental concerns, and growing adoption of plant-based diets.
The global dairy alternative market is expected to reach approximately USD 114 billion by 2035, growing from an estimated USD 38.51 billion in 2025, representing more than double the market size over the ten-year forecast period.
The key companies operating in this market include Danone S.A., Nestlé S.A., Oatly Group AB, Blue Diamond Growers, Hain Celestial Group, Inc., SunOpta Inc., Daiya Foods, Inc., Earth's Own Food Company Inc., Valsoia S.p.A., Miyoko's Creamery, and others.
Major trends shaping the market include premium and organic product lines, protein-enriched alternatives, sustainable packaging solutions, barista-quality products for coffee applications, and functional and fortified product development.
• In 2025, the Plant-Based Milk segment is expected to dominate the overall dairy alternatives market by product type
• Based on source, the Almond segment is expected to hold the largest share of the overall market in 2025
• Based on formulation, the Unflavored segment is expected to hold the largest share of the overall market in 2025
• Based on distribution channel, the Modern Groceries segment is expected to hold the largest share of the global market in 2025
North America is expected to hold the largest share of the global dairy alternatives market in 2025, driven by high consumer awareness, established retail infrastructure, and strong adoption of plant-based diets. Asia-Pacific is witnessing the fastest growth rate during the forecast period.
The growth of this market is driven by rising lactose intolerance and dairy allergies, growing health consciousness and wellness trends, environmental sustainability concerns, and increasing vegan and plant-based diet adoption.
1. Market Definition & Scope
1.1. Market Definition
1.2. Market Ecosystem
1.3. Currency
1.4. Key Stakeholders
2. Research Methodology
2.1. Research Approach
2.2. Process of Data Collection and Validation
2.2.1. Secondary Research
2.2.2. Primary Research/Interviews with Key Opinion Leaders from the Industry
2.3. Market Sizing and Forecast
2.3.1. Market Size Estimation Approach
2.3.1.1. Bottom-up Approach
2.3.1.2. Top-down Approach
2.3.2. Growth Forecast Approach
2.3.3. Assumptions for the Study
3. Executive Summary
3.1. Overview
3.2. Segmental Analysis
3.2.1. Dairy Alternatives Market Analysis: by Product Type
3.2.2. Dairy Alternatives Market Analysis: by Source
3.2.3. Dairy Alternatives Market Analysis: by Formulation
3.2.4. Dairy Alternatives Market Analysis: by Distribution Channel
3.2.5. Dairy Alternatives Market, by Geography
3.3. Competitive Landscape
4. Market Insights
4.1. Overview
4.2. Factors Affecting Market Growth
4.2.1. Drivers
4.2.1.1. Rising Lactose Intolerance and Dairy Allergies
4.2.1.2. Growing Health Consciousness and Wellness Trends
4.2.1.3. Environmental Sustainability Concerns
4.2.1.4. Increasing Vegan and Plant-Based Diet Adoption
4.2.1.5. Product Innovation and Taste Improvements
4.2.2. Restraints
4.2.2.1. Higher Cost Compared to Conventional Dairy
4.2.2.2. Taste and Texture Acceptance Challenges
4.2.2.3. Nutritional Content Variations
4.2.2.4. Limited Shelf Life of Some Products
4.2.3. Opportunities
4.2.3.1. Expansion in Emerging Markets
4.2.3.2. Functional and Fortified Product Development
4.2.3.3. Food Service Industry Penetration
4.2.3.4. Private Label Market Growth
4.2.4. Trends
4.2.4.1. Premium and Organic Product Lines
4.2.4.2. Protein-Enriched Alternatives
4.2.4.3. Sustainable Packaging Solutions
4.2.4.4. Barista-Quality Products for Coffee Applications
4.2.5. Challenges
4.2.5.1. Regulatory Labeling Requirements
4.2.5.2. Supply Chain Complexity
4.2.5.3. Raw Material Price Volatility
4.3. Porter’s Five Forces Analysis
4.3.1. Bargaining Power of Suppliers
4.3.2. Bargaining Power of Buyers
4.3.3. Threat of Substitutes
4.3.4. Threat of New Entrants
4.3.5. Degree of Competition
4.4. Sustainability Impact on the Dairy Alternative Market
4.4.1. Environmental Sustainability Factors
4.4.1.1. Water Usage Reduction
4.4.1.2. Lower Carbon Footprint
4.4.1.3. Reduced Land Use Requirements
4.4.2. Market Response to Sustainability Demands
4.4.2.1. Sustainable Sourcing Initiatives
4.4.2.2. Eco-friendly Packaging Adoption
4.4.3. Opportunities from Sustainability Focus
4.4.3.1. Carbon-Neutral Product Lines
4.4.3.2. Regenerative Agriculture Partnerships
5. Dairy Alternatives Market Assessment—by Product Type
5.1. Overview
5.2. Plant-Based Milk
5.2.1. Almond Milk
5.2.2. Soy Milk
5.2.3. Coconut Milk
5.2.4. Oat Milk
5.2.5. Rice Milk
5.2.6. Other Plant-based Milks
5.3. Cheese
5.4. Yogurt
5.5. Butter
5.6. Ice-Cream
5.7. Creamer
5.8. Other Dairy Alternatives
6. Dairy Alternatives Market Assessment—by Source
6.1. Overview
6.2. Almond
6.3. Soy
6.4. Wheat
6.5. Pea
6.6. Rice
6.7. Oat
6.8. Other Sources
7. Dairy Alternatives Market Assessment—by Formulation
7.1. Overview
7.2. Unflavored
7.3. Flavored
8. Dairy Alternatives Market Assessment—by Distribution Channel
8.1. Overview
8.2. Business-to-Business (B2B)
8.2.1. Food Services and Hospitality
8.2.2. Food and Beverage Manufacturers
8.2.3. Other B2B Channels
8.3. Business-to-Consumer (B2C)
8.3.1. Modern Groceries
8.3.2. Convenience Stores
8.3.3. Specialty Stores
8.3.4. Online Retail Stores
8.3.5. Other B2C Distribution Channels
9. Dairy Alternatives Market Assessment—by Geography
9.1. Overview
9.2. North America
9.2.1. U.S.
9.2.2. Canada
9.3. Europe
9.3.1. Germany
9.3.2. U.K.
9.3.3. France
9.3.4. Italy
9.3.5. Spain
9.3.6. Netherlands
9.3.7. Belgium
9.3.8. Austria
9.3.9. Poland
9.3.10. Portugal
9.3.11. Rest of Europe
9.4. Asia-Pacific
9.4.1. China
9.4.2. Japan
9.4.3. India
9.4.4. Australia
9.4.5. Thailand
9.4.6. South Korea
9.4.7. Rest of Asia-Pacific
9.5. Latin America
9.5.1. Brazil
9.5.2. Mexico
9.5.3. Argentina
9.5.4. Rest of Latin America
9.6. Middle East & Africa
10. Competition Analysis
10.1. Overview
10.2. Key Growth Strategies
10.2.1. Market Differentiators
10.2.2. Synergy Analysis: Major Deals & Strategic Alliances
10.3. Competitive Benchmarking
10.4. Competitive Dashboard
10.4.1. Industry Leaders
10.4.2. Market Differentiators
10.4.3. Vanguards
10.4.4. Emerging Companies
10.5. Market Share Analysis/Market Ranking by the Key Players
11. Company Profiles (Company Overview, Financial Overview, Product Portfolio, and Strategic Developments)
11.1. Danone S.A.
11.2. Hain Celestial Group, Inc.
11.3. Sahmyook Foods
11.4. Sanitarium Health and Wellbeing Company
11.5. Axiom Foods, Inc.
11.6. Daiya Foods, Inc. (A Part of Otsuka Pharmaceutical Co., Ltd.)
11.7. Earth’s Own Food Company Inc.
11.8. SunOpta Inc.
11.9. Valsoia S.p.A.
11.10. Plamil Foods Ltd.
11.11. Nestlé S.A.
11.12. Oatly Group AB
11.13. Sunrise Soy Foods
11.14. Miyoko's Creamery
11.15. Blue Diamond Growers
12. Appendix
12.1. Available Customization
12.2. Related Reports
List of Tables
Table 1 Global Dairy Alternatives Market, by Product Type, 2023-2035 (USD Million)
Table 2 Global Dairy Alternatives Market, by Product Type, 2023-2035 (Tons)
Table 3 Plant-Based Milk Market, by Type, 2023-2035 (USD Million)
Table 4 Plant-Based Milk Market, by Country/Region, 2023-2035 (USD Million)
Table 5 Plant-Based Milk Market, by Type, 2023-2035 (Tons)
Table 6 Plant-Based Milk Market, by Country/Region, 2023-2035 (Tons)
Table 7 Almond Milk Market, by Country/Region, 2023-2035 (USD Million)
Table 8 Almond Milk Market, by Country/Region, 2023-2035 (Tons)
Table 9 Soy Milk Market, by Country/Region, 2023-2035 (USD Million)
Table 10 Soy Milk Market, by Country/Region, 2023-2035 (Tons)
Table 11 Coconut Milk Market, by Country/Region, 2023-2035 (USD Million)
Table 12 Coconut Milk Market, by Country/Region, 2023-2035 (Tons)
Table 13 Oat Milk Market, by Country/Region, 2023-2035 (USD Million)
Table 14 Oat Milk Market, by Country/Region, 2023-2035 (Tons)
Table 15 Rice Milk Market, by Country/Region, 2023-2035 (USD Million)
Table 16 Rice Milk Market, by Country/Region, 2023-2035 (Tons)
Table 17 Other Plant-based Milks Market, by Country/Region, 2023-2035 (USD Million)
Table 18 Other Plant-based Milks Market, by Country/Region, 2023-2035 (Tons)
Table 19 Plant-Based Cheese Market, by Country/Region, 2023-2035 (USD Million)
Table 20 Plant-Based Cheese Market, by Country/Region, 2023-2035 (Tons)
Table 21 Plant-Based Yogurt Market, by Country/Region, 2023-2035 (USD Million)
Table 22 Plant-Based Yogurt Market, by Country/Region, 2023-2035 (Tons)
Table 23 Plant-Based Butter Market, by Country/Region, 2023-2035 (USD Million)
Table 24 Plant-Based Butter Market, by Country/Region, 2023-2035 (Tons)
Table 25 Plant-Based Ice-Cream Market, by Country/Region, 2023-2035 (USD Million)
Table 26 Plant-Based Ice-Cream Market, by Country/Region, 2023-2035 (Tons)
Table 27 Plant-Based Creamer Market, by Country/Region, 2023-2035 (USD Million)
Table 28 Plant-Based Creamer Market, by Country/Region, 2023-2035 (Tons)
Table 29 Other Plant-Based Dairy Alternatives Market, by Country/Region, 2023-2035 (USD Million)
Table 30 Other Plant-Based Dairy Alternatives Market, by Country/Region, 2023-2035 (Tons)
Table 31 Global Dairy Alternatives Market, by Source, 2023-2035 (USD Million)
Table 32 Almond-based Dairy Alternatives Market, by Country/Region, 2023–2035 (USD Million)
Table 33 Soy-based Dairy Alternatives Market, by Country/Region, 2023–2035 (USD Million)
Table 34 Wheat-based Dairy Alternatives Market, by Country/Region, 2023–2035 (USD Million)
Table 35 Pea-based Dairy Alternatives Market, by Country/Region, 2023–2035 (USD Million)
Table 36 Rice-based Dairy Alternatives Market, by Country/Region, 2023–2035 (USD Million)
Table 37 Oat-based Dairy Alternatives Market, by Country/Region, 2023–2035 (USD Million)
Table 38 Other Sources-based Dairy Alternatives Market, by Country/Region, 2023–2035 (USD Million)
Table 39 Global Dairy Alternatives Market, by Formulation, 2023–2035 (USD Million)
Table 40 Unflavored Dairy Alternatives Market, by Country/Region, 2023–2035 (USD Million)
Table 41 Flavored Dairy Alternatives Market, by Country/Region, 2023–2035 (USD Million)
Table 42 Global Dairy Alternatives Market, by Distribution Channel, 2023-2035 (USD Million)
Table 43 Global Business-to-Business (B2B) Dairy Alternatives Market, by Country/Region, 2023-2035 (USD Million)
Table 44 Global Business-to-Business (B2B) Dairy Alternatives Market, by Type, 2023-2035 (USD Million)
Table 45 Global B2B Dairy Alternatives Market for Food Services and Hospitality, by Country/Region, 2023-2035 (USD Million)
Table 46 Global B2B Dairy Alternatives Market for Food and Beverage Manufacturers, by Country/Region, 2023-2035 (USD Million)
Table 47 Global B2B Dairy Alternatives Market for Other B2B Channels, by Country/Region, 2023-2035 (USD Million)
Table 48 Global Business-to-Consumer (B2C) Dairy Alternatives Market, by Type, 2023-2035 (USD Million)
Table 49 Global Business-to-Consumer (B2C) Dairy Alternatives Market, by Country/Region, 2023-2035 (USD Million)
Table 50 Global B2C Dairy Alternatives Market for Modern Groceries, by Country/Region, 2023-2035 (USD Million)
Table 51 Global B2C Dairy Alternatives Market for Convenience Stores, by Country/Region, 2023-2035 (USD Million)
Table 52 Global B2C Dairy Alternatives Market for Specialty Stores, by Country/Region, 2023-2035 (USD Million)
Table 53 Global B2C Dairy Alternatives Market for Online Retail Stores, by Country/Region, 2023-2035 (USD Million)
Table 54 Global B2C Dairy Alternatives Market for Other B2C Distribution Channels, by Country/Region, 2023-2035 (USD Million)
Table 55 Dairy Alternatives Market, by Region, 2023-2035 (USD Million)
Table 56 North America: Dairy Alternatives Market, by Country, 2023-2035 (USD Million)
Table 57 North America: Dairy Alternatives Market, by Country, 2023-2035 (Tons)
Table 58 North America: Dairy Alternatives Market, by Product Type, 2023–2035 (USD Million)
Table 59 North America: Dairy Alternatives Market, by Product Type, 2023–2035 (Tons)
Table 60 North America: Plant-Based Milk Market, by Type, 2023–2035 (USD Million)
Table 61 North America: Plant-Based Milk Market, by Type, 2023–2035 (Tons)
Table 62 North America: Dairy Alternatives Market, by Source, 2023–2035 (USD Million)
Table 63 North America: Dairy Alternatives Market, by Formulation, 2023–2035 (USD Million)
Table 64 North America: Dairy Alternatives Market, by Distribution Channel, 2023–2035 (USD Million)
Table 65 North America: Business to Business Dairy Alternatives Market, by Type, 2023–2035 (USD Million)
Table 66 North America: Business to Customer Dairy Alternatives Market, by Type 2023–2035 (USD Million)
Table 67 U.S.: Dairy Alternatives Market, by Product Type, 2023–2035 (USD Million)
Table 68 U.S.: Dairy Alternatives Market, by Product Type, 2023–2035 (Tons)
Table 69 U.S.: Plant-Based Milk Market, by Type, 2023–2035 (USD Million)
Table 70 U.S.: Plant-Based Milk Market, by Type, 2023–2035 (Tons)
Table 71 U.S.: Dairy Alternatives Market, by Source, 2023–2035 (USD Million)
Table 72 U.S.: Dairy Alternatives Market, by Formulation, 2023–2035 (USD Million)
Table 73 U.S.: Dairy Alternatives Market, by Distribution Channel, 2023–2035 (USD Million)
Table 74 U.S.: Business to Business Dairy Alternatives Market, by Type, 2023–2035 (USD Million)
Table 75 U.S.: Business to Customer Dairy Alternatives Market, by Type 2023–2035 (USD Million)
Table 76 Canada: Dairy Alternatives Market, by Product Type, 2023–2035 (USD Million)
Table 77 Canada: Dairy Alternatives Market, by Product Type, 2023–2035 (Tons)
Table 78 Canada: Plant-Based Milk Market, by Type, 2023–2035 (USD Million)
Table 79 Canada: Plant-Based Milk Market, by Type, 2023–2035 (Tons)
Table 80 Canada: Dairy Alternatives Market, by Source, 2023–2035 (USD Million)
Table 81 Canada: Dairy Alternatives Market, by Formulation, 2023–2035 (USD Million)
Table 82 Canada: Dairy Alternatives Market, by Distribution Channel, 2023–2035 (USD Million)
Table 83 Canada: Business to Business Dairy Alternatives Market, by Type, 2023–2035 (USD Million)
Table 84 Canada: Business to Customer Dairy Alternatives Market, by Type 2023–2035 (USD Million)
Table 85 Europe: Dairy Alternatives Market, by Country, 2023-2035 (USD Million)
Table 86 Europe: Dairy Alternatives Market, by Country, 2023-2035 (Tons)
Table 87 Europe: Dairy Alternatives Market, by Product Type, 2023–2035 (USD Million)
Table 88 Europe: Dairy Alternatives Market, by Product Type, 2023–2035 (Tons)
Table 89 Europe: Plant-Based Milk Market, by Type, 2023–2035 (USD Million)
Table 90 Europe: Plant-Based Milk Market, by Type, 2023–2035 (Tons)
Table 91 Europe: Dairy Alternatives Market, by Source, 2023–2035 (USD Million)
Table 92 Europe: Dairy Alternatives Market, by Formulation, 2023–2035 (USD Million)
Table 93 Europe: Dairy Alternatives Market, by Distribution Channel, 2023–2035 (USD Million)
Table 94 Europe: Business to Business Dairy Alternatives Market, by Type, 2023–2035 (USD Million)
Table 95 Europe: Business to Customer Dairy Alternatives Market, by Type 2023–2035 (USD Million)
Table 96 Germany: Dairy Alternatives Market, by Product Type, 2023–2035 (USD Million)
Table 97 Germany: Dairy Alternatives Market, by Product Type, 2023–2035 (Tons)
Table 98 Germany: Plant-Based Milk Market, by Type, 2023–2035 (USD Million)
Table 99 Germany: Plant-Based Milk Market, by Type, 2023–2035 (Tons)
Table 100 Germany: Dairy Alternatives Market, by Source, 2023–2035 (USD Million)
Table 101 Germany: Dairy Alternatives Market, by Formulation, 2023–2035 (USD Million)
Table 102 Germany: Dairy Alternatives Market, by Distribution Channel, 2023–2035 (USD Million)
Table 103 Germany: Business to Business Dairy Alternatives Market, by Type, 2023–2035 (USD Million)
Table 104 Germany: Business to Customer Dairy Alternatives Market, by Type 2023–2035 (USD Million)
Table 105 U.K.: Dairy Alternatives Market, by Product Type, 2023–2035 (USD Million)
Table 106 U.K.: Dairy Alternatives Market, by Product Type, 2023–2035 (Tons)
Table 107 U.K.: Plant-Based Milk Market, by Type, 2023–2035 (USD Million)
Table 108 U.K.: Plant-Based Milk Market, by Type, 2023–2035 (Tons)
Table 109 U.K.: Dairy Alternatives Market, by Source, 2023–2035 (USD Million)
Table 110 U.K.: Dairy Alternatives Market, by Formulation, 2023–2035 (USD Million)
Table 111 U.K.: Dairy Alternatives Market, by Distribution Channel, 2023–2035 (USD Million)
Table 112 U.K.: Business to Business Dairy Alternatives Market, by Type, 2023–2035 (USD Million)
Table 113 U.K.: Business to Customer Dairy Alternatives Market, by Type 2023–2035 (USD Million)
Table 114 Spain: Dairy Alternatives Market, by Product Type, 2023–2035 (USD Million)
Table 115 Spain: Dairy Alternatives Market, by Product Type, 2023–2035 (Tons)
Table 116 Spain: Plant-Based Milk Market, by Type, 2023–2035 (USD Million)
Table 117 Spain: Plant-Based Milk Market, by Type, 2023–2035 (Tons)
Table 118 Spain: Dairy Alternatives Market, by Source, 2023–2035 (USD Million)
Table 119 Spain: Dairy Alternatives Market, by Formulation, 2023–2035 (USD Million)
Table 120 Spain: Dairy Alternatives Market, by Distribution Channel, 2023–2035 (USD Million)
Table 121 Spain: Business to Business Dairy Alternatives Market, by Type, 2023–2035 (USD Million)
Table 122 Spain: Business to Customer Dairy Alternatives Market, by Type 2023–2035 (USD Million)
Table 123 Italy: Dairy Alternatives Market, by Product Type, 2023–2035 (USD Million)
Table 124 Italy: Dairy Alternatives Market, by Product Type, 2023–2035 (Tons)
Table 125 Italy: Plant-Based Milk Market, by Type, 2023–2035 (USD Million)
Table 126 Italy: Plant-Based Milk Market, by Type, 2023–2035 (Tons)
Table 127 Italy: Dairy Alternatives Market, by Source, 2023–2035 (USD Million)
Table 128 Italy: Dairy Alternatives Market, by Formulation, 2023–2035 (USD Million)
Table 129 Italy: Dairy Alternatives Market, by Distribution Channel, 2023–2035 (USD Million)
Table 130 Italy: Business to Business Dairy Alternatives Market, by Type, 2023–2035 (USD Million)
Table 131 Italy: Business to Customer Dairy Alternatives Market, by Type 2023–2035 (USD Million)
Table 132 France: Dairy Alternatives Market, by Product Type, 2023–2035 (USD Million)
Table 133 France: Dairy Alternatives Market, by Product Type, 2023–2035 (Tons)
Table 134 France: Plant-Based Milk Market, by Type, 2023–2035 (USD Million)
Table 135 France: Plant-Based Milk Market, by Type, 2023–2035 (Tons)
Table 136 France: Dairy Alternatives Market, by Source, 2023–2035 (USD Million)
Table 137 France: Dairy Alternatives Market, by Formulation, 2023–2035 (USD Million)
Table 138 France: Dairy Alternatives Market, by Distribution Channel, 2023–2035 (USD Million)
Table 139 France: Business to Business Dairy Alternatives Market, by Type, 2023–2035 (USD Million)
Table 140 France: Business to Customer Dairy Alternatives Market, by Type 2023–2035 (USD Million)
Table 141 Netherlands: Dairy Alternatives Market, by Product Type, 2023–2035 (USD Million)
Table 142 Netherlands: Dairy Alternatives Market, by Product Type, 2023–2035 (Tons)
Table 143 Netherlands: Plant-Based Milk Market, by Type, 2023–2035 (USD Million)
Table 144 Netherlands: Plant-Based Milk Market, by Type, 2023–2035 (Tons)
Table 145 Netherlands: Dairy Alternatives Market, by Source, 2023–2035 (USD Million)
Table 146 Netherlands: Dairy Alternatives Market, by Formulation, 2023–2035 (USD Million)
Table 147 Netherlands: Dairy Alternatives Market, by Distribution Channel, 2023–2035 (USD Million)
Table 148 Netherlands: Business to Business Dairy Alternatives Market, by Type, 2023–2035 (USD Million)
Table 149 Netherlands: Business to Customer Dairy Alternatives Market, by Type 2023–2035 (USD Million)
Table 150 Belgium: Dairy Alternatives Market, by Product Type, 2023–2035 (USD Million)
Table 151 Belgium: Dairy Alternatives Market, by Product Type, 2023–2035 (Tons)
Table 152 Belgium: Plant-Based Milk Market, by Type, 2023–2035 (USD Million)
Table 153 Belgium: Plant-Based Milk Market, by Type, 2023–2035 (Tons)
Table 154 Belgium: Dairy Alternatives Market, by Source, 2023–2035 (USD Million)
Table 155 Belgium: Dairy Alternatives Market, by Formulation, 2023–2035 (USD Million)
Table 156 Belgium: Dairy Alternatives Market, by Distribution Channel, 2023–2035 (USD Million)
Table 157 Belgium: Business to Business Dairy Alternatives Market, by Type, 2023–2035 (USD Million)
Table 158 Belgium: Business to Customer Dairy Alternatives Market, by Type 2023–2035 (USD Million)
Table 159 Austria: Dairy Alternatives Market, by Product Type, 2023–2035 (USD Million)
Table 160 Austria: Dairy Alternatives Market, by Product Type, 2023–2035 (Tons)
Table 161 Austria: Plant-Based Milk Market, by Type, 2023–2035 (USD Million)
Table 162 Austria: Plant-Based Milk Market, by Type, 2023–2035 (Tons)
Table 163 Austria: Dairy Alternatives Market, by Source, 2023–2035 (USD Million)
Table 164 Austria: Dairy Alternatives Market, by Formulation, 2023–2035 (USD Million)
Table 165 Austria: Dairy Alternatives Market, by Distribution Channel, 2023–2035 (USD Million)
Table 166 Austria: Business to Business Dairy Alternatives Market, by Type, 2023–2035 (USD Million)
Table 167 Austria: Business to Customer Dairy Alternatives Market, by Type 2023–2035 (USD Million)
Table 168 Poland: Dairy Alternatives Market, by Product Type, 2023–2035 (USD Million)
Table 169 Poland: Dairy Alternatives Market, by Product Type, 2023–2035 (Tons)
Table 170 Poland: Plant-Based Milk Market, by Type, 2023–2035 (USD Million)
Table 171 Poland: Plant-Based Milk Market, by Type, 2023–2035 (Tons)
Table 172 Poland: Dairy Alternatives Market, by Source, 2023–2035 (USD Million)
Table 173 Poland: Dairy Alternatives Market, by Formulation, 2023–2035 (USD Million)
Table 174 Poland: Dairy Alternatives Market, by Distribution Channel, 2023–2035 (USD Million)
Table 175 Poland: Business to Business Dairy Alternatives Market, by Type, 2023–2035 (USD Million)
Table 176 Poland: Business to Customer Dairy Alternatives Market, by Type 2023–2035 (USD Million)
Table 177 Portugal: Dairy Alternatives Market, by Product Type, 2023–2035 (USD Million)
Table 178 Portugal: Dairy Alternatives Market, by Product Type, 2023–2035 (Tons)
Table 179 Portugal: Plant-Based Milk Market, by Type, 2023–2035 (USD Million)
Table 180 Portugal: Plant-Based Milk Market, by Type, 2023–2035 (Tons)
Table 181 Portugal: Dairy Alternatives Market, by Source, 2023–2035 (USD Million)
Table 182 Portugal: Dairy Alternatives Market, by Formulation, 2023–2035 (USD Million)
Table 183 Portugal: Dairy Alternatives Market, by Distribution Channel, 2023–2035 (USD Million)
Table 184 Portugal: Business to Business Dairy Alternatives Market, by Type, 2023–2035 (USD Million)
Table 185 Portugal: Business to Customer Dairy Alternatives Market, by Type 2023–2035 (USD Million)
Table 186 Rest of Europe: Dairy Alternatives Market, by Product Type, 2023–2035 (USD Million)
Table 187 Rest of Europe: Dairy Alternatives Market, by Product Type, 2023–2035 (Tons)
Table 188 Rest of Europe: Plant-Based Milk Market, by Type, 2023–2035 (USD Million)
Table 189 Rest of Europe: Plant-Based Milk Market, by Type, 2023–2035 (Tons)
Table 190 Rest of Europe: Dairy Alternatives Market, by Source, 2023–2035 (USD Million)
Table 191 Rest of Europe: Dairy Alternatives Market, by Formulation, 2023–2035 (USD Million)
Table 192 Rest of Europe: Dairy Alternatives Market, by Distribution Channel, 2023–2035 (USD Million)
Table 193 Rest of Europe: Business to Business Dairy Alternatives Market, by Type, 2023–2035 (USD Million)
Table 194 Rest of Europe: Business to Customer Dairy Alternatives Market, by Type 2023–2035 (USD Million)
Table 195 Asia-Pacific: Dairy Alternatives Market, by Country, 2023-2035 (USD Million)
Table 196 Asia-Pacific: Dairy Alternatives Market, by Country, 2023-2035 (Tons)
Table 197 Asia-Pacific: Dairy Alternatives Market, by Product Type, 2023–2035 (USD Million)
Table 198 Asia-Pacific: Dairy Alternatives Market, by Product Type, 2023–2035 (Tons)
Table 199 Asia-Pacific: Plant-Based Milk Market, by Type, 2023–2035 (USD Million)
Table 200 Asia-Pacific: Plant-Based Milk Market, by Type, 2023–2035 (Tons)
Table 201 Asia-Pacific: Dairy Alternatives Market, by Source, 2023–2035 (USD Million)
Table 202 Asia-Pacific: Dairy Alternatives Market, by Formulation, 2023–2035 (USD Million)
Table 203 Asia-Pacific: Dairy Alternatives Market, by Distribution Channel, 2023–2035 (USD Million)
Table 204 Asia-Pacific: Business to Business Dairy Alternatives Market, by Type, 2023–2035 (USD Million)
Table 205 Asia-Pacific: Business to Customer Dairy Alternatives Market, by Type 2023–2035 (USD Million)
Table 206 China: Dairy Alternatives Market, by Product Type, 2023–2035 (USD Million)
Table 207 China: Dairy Alternatives Market, by Product Type, 2023–2035 (Tons)
Table 208 China: Plant-Based Milk Market, by Type, 2023–2035 (USD Million)
Table 209 China: Plant-Based Milk Market, by Type, 2023–2035 (Tons)
Table 210 China: Dairy Alternatives Market, by Source, 2023–2035 (USD Million)
Table 211 China: Dairy Alternatives Market, by Formulation, 2023–2035 (USD Million)
Table 212 China: Dairy Alternatives Market, by Distribution Channel, 2023–2035 (USD Million)
Table 213 China: Business to Business Dairy Alternatives Market, by Type, 2023–2035 (USD Million)
Table 214 China: Business to Customer Dairy Alternatives Market, by Type 2023–2035 (USD Million)
Table 215 India: Dairy Alternatives Market, by Product Type, 2023–2035 (USD Million)
Table 216 India: Dairy Alternatives Market, by Product Type, 2023–2035 (Tons)
Table 217 India: Plant-Based Milk Market, by Type, 2023–2035 (USD Million)
Table 218 India: Plant-Based Milk Market, by Type, 2023–2035 (Tons)
Table 219 India: Dairy Alternatives Market, by Source, 2023–2035 (USD Million)
Table 220 India: Dairy Alternatives Market, by Formulation, 2023–2035 (USD Million)
Table 221 India: Dairy Alternatives Market, by Distribution Channel, 2023–2035 (USD Million)
Table 222 India: Business to Business Dairy Alternatives Market, by Type, 2023–2035 (USD Million)
Table 223 India: Business to Customer Dairy Alternatives Market, by Type 2023–2035 (USD Million)
Table 224 Japan: Dairy Alternatives Market, by Product Type, 2023–2035 (USD Million)
Table 225 Japan: Dairy Alternatives Market, by Product Type, 2023–2035 (Tons)
Table 226 Japan: Plant-Based Milk Market, by Type, 2023–2035 (USD Million)
Table 227 Japan: Plant-Based Milk Market, by Type, 2023–2035 (Tons)
Table 228 Japan: Dairy Alternatives Market, by Source, 2023–2035 (USD Million)
Table 229 Japan: Dairy Alternatives Market, by Formulation, 2023–2035 (USD Million)
Table 230 Japan: Dairy Alternatives Market, by Distribution Channel, 2023–2035 (USD Million)
Table 231 Japan: Business to Business Dairy Alternatives Market, by Type, 2023–2035 (USD Million)
Table 232 Japan: Business to Customer Dairy Alternatives Market, by Type 2023–2035 (USD Million)
Table 233 Australia: Dairy Alternatives Market, by Product Type, 2023–2035 (USD Million)
Table 234 Australia: Dairy Alternatives Market, by Product Type, 2023–2035 (Tons)
Table 235 Australia: Plant-Based Milk Market, by Type, 2023–2035 (USD Million)
Table 236 Australia: Plant-Based Milk Market, by Type, 2023–2035 (Tons)
Table 237 Australia: Dairy Alternatives Market, by Source, 2023–2035 (USD Million)
Table 238 Australia: Dairy Alternatives Market, by Formulation, 2023–2035 (USD Million)
Table 239 Australia: Dairy Alternatives Market, by Distribution Channel, 2023–2035 (USD Million)
Table 240 Australia: Business to Business Dairy Alternatives Market, by Type, 2023–2035 (USD Million)
Table 241 Australia: Business to Customer Dairy Alternatives Market, by Type 2023–2035 (USD Million)
Table 242 Thailand: Dairy Alternatives Market, by Product Type, 2023–2035 (USD Million)
Table 243 Thailand: Dairy Alternatives Market, by Product Type, 2023–2035 (Tons)
Table 244 Thailand: Plant-Based Milk Market, by Type, 2023–2035 (USD Million)
Table 245 Thailand: Plant-Based Milk Market, by Type, 2023–2035 (Tons)
Table 246 Thailand: Dairy Alternatives Market, by Source, 2023–2035 (USD Million)
Table 247 Thailand: Dairy Alternatives Market, by Formulation, 2023–2035 (USD Million)
Table 248 Thailand: Dairy Alternatives Market, by Distribution Channel, 2023–2035 (USD Million)
Table 249 Thailand: Business to Business Dairy Alternatives Market, by Type, 2023–2035 (USD Million)
Table 250 Thailand: Business to Customer Dairy Alternatives Market, by Type 2023–2035 (USD Million)
Table 251 South Korea: Dairy Alternatives Market, by Product Type, 2023–2035 (USD Million)
Table 252 South Korea: Dairy Alternatives Market, by Product Type, 2023–2035 (Tons)
Table 253 South Korea: Plant-Based Milk Market, by Type, 2023–2035 (USD Million)
Table 254 South Korea: Plant-Based Milk Market, by Type, 2023–2035 (Tons)
Table 255 South Korea: Dairy Alternatives Market, by Source, 2023–2035 (USD Million)
Table 256 South Korea: Dairy Alternatives Market, by Formulation, 2023–2035 (USD Million)
Table 257 South Korea: Dairy Alternatives Market, by Distribution Channel, 2023–2035 (USD Million)
Table 258 South Korea: Business to Business Dairy Alternatives Market, by Type, 2023–2035 (USD Million)
Table 259 South Korea: Business to Customer Dairy Alternatives Market, by Type 2023–2035 (USD Million)
Table 260 Rest of Asia-Pacific: Dairy Alternatives Market, by Product Type, 2023–2035 (USD Million)
Table 261 Rest of Asia-Pacific: Dairy Alternatives Market, by Product Type, 2023–2035 (Tons)
Table 262 Rest of Asia-Pacific: Plant-Based Milk Market, by Type, 2023–2035 (USD Million)
Table 263 Rest of Asia-Pacific: Plant-Based Milk Market, by Type, 2023–2035 (Tons)
Table 264 Rest of Asia-Pacific: Dairy Alternatives Market, by Source, 2023–2035 (USD Million)
Table 265 Rest of Asia-Pacific: Dairy Alternatives Market, by Formulation, 2023–2035 (USD Million)
Table 266 Rest of Asia-Pacific: Dairy Alternatives Market, by Distribution Channel, 2023–2035 (USD Million)
Table 267 Rest of Asia-Pacific: Business to Business Dairy Alternatives Market, by Type, 2023–2035 (USD Million)
Table 268 Rest of Asia-Pacific: Business to Customer Dairy Alternatives Market, by Type 2023–2035 (USD Million)
Table 269 Latin America: Dairy Alternatives Market, by Country, 2023-2035 (USD Million)
Table 270 Latin America: Dairy Alternatives Market, by Country, 2023-2035 (Tons)
Table 271 Latin America: Dairy Alternatives Market, by Product Type, 2023–2035 (USD Million)
Table 272 Latin America: Dairy Alternatives Market, by Product Type, 2023–2035 (Tons)
Table 273 Latin America: Plant-Based Milk Market, by Type, 2023–2035 (USD Million)
Table 274 Latin America: Plant-Based Milk Market, by Type, 2023–2035 (Tons)
Table 275 Latin America: Dairy Alternatives Market, by Source, 2023–2035 (USD Million)
Table 276 Latin America: Dairy Alternatives Market, by Formulation, 2023–2035 (USD Million)
Table 277 Latin America: Dairy Alternatives Market, by Distribution Channel, 2023–2035 (USD Million)
Table 278 Latin America: Business to Business Dairy Alternatives Market, by Type, 2023–2035 (USD Million)
Table 279 Latin America: Business to Customer Dairy Alternatives Market, by Type 2023–2035 (USD Million)
Table 280 Brazil: Dairy Alternatives Market, by Product Type, 2023–2035 (USD Million)
Table 281 Brazil: Dairy Alternatives Market, by Product Type, 2023–2035 (Tons)
Table 282 Brazil: Plant-Based Milk Market, by Type, 2023–2035 (USD Million)
Table 283 Brazil: Plant-Based Milk Market, by Type, 2023–2035 (Tons)
Table 284 Brazil: Dairy Alternatives Market, by Source, 2023–2035 (USD Million)
Table 285 Brazil: Dairy Alternatives Market, by Formulation, 2023–2035 (USD Million)
Table 286 Brazil: Dairy Alternatives Market, by Distribution Channel, 2023–2035 (USD Million)
Table 287 Brazil: Business to Business Dairy Alternatives Market, by Type, 2023–2035 (USD Million)
Table 288 Brazil: Business to Customer Dairy Alternatives Market, by Type 2023–2035 (USD Million)
Table 289 Mexico: Dairy Alternatives Market, by Product Type, 2023–2035 (USD Million)
Table 290 Mexico: Dairy Alternatives Market, by Product Type, 2023–2035 (Tons)
Table 291 Mexico: Plant-Based Milk Market, by Type, 2023–2035 (USD Million)
Table 292 Mexico: Plant-Based Milk Market, by Type, 2023–2035 (Tons)
Table 293 Mexico: Dairy Alternatives Market, by Source, 2023–2035 (USD Million)
Table 294 Mexico: Dairy Alternatives Market, by Formulation, 2023–2035 (USD Million)
Table 295 Mexico: Dairy Alternatives Market, by Distribution Channel, 2023–2035 (USD Million)
Table 296 Mexico: Business to Business Dairy Alternatives Market, by Type, 2023–2035 (USD Million)
Table 297 Mexico: Business to Customer Dairy Alternatives Market, by Type 2023–2035 (USD Million)
Table 298 Argentina: Dairy Alternatives Market, by Product Type, 2023–2035 (USD Million)
Table 299 Argentina: Dairy Alternatives Market, by Product Type, 2023–2035 (Tons)
Table 300 Argentina: Plant-Based Milk Market, by Type, 2023–2035 (USD Million)
Table 301 Argentina: Plant-Based Milk Market, by Type, 2023–2035 (Tons)
Table 302 Argentina: Dairy Alternatives Market, by Source, 2023–2035 (USD Million)
Table 303 Argentina: Dairy Alternatives Market, by Formulation, 2023–2035 (USD Million)
Table 304 Argentina: Dairy Alternatives Market, by Distribution Channel, 2023–2035 (USD Million)
Table 305 Argentina: Business to Business Dairy Alternatives Market, by Type, 2023–2035 (USD Million)
Table 306 Argentina: Business to Customer Dairy Alternatives Market, by Type 2023–2035 (USD Million)
Table 307 Rest of Latin America: Dairy Alternatives Market, by Product Type, 2023–2035 (USD Million)
Table 308 Rest of Latin America: Dairy Alternatives Market, by Product Type, 2023–2035 (Tons)
Table 309 Rest of Latin America: Plant-Based Milk Market, by Type, 2023–2035 (USD Million)
Table 310 Rest of Latin America: Plant-Based Milk Market, by Type, 2023–2035 (Tons)
Table 311 Rest of Latin America: Dairy Alternatives Market, by Source, 2023–2035 (USD Million)
Table 312 Rest of Latin America: Dairy Alternatives Market, by Formulation, 2023–2035 (USD Million)
Table 313 Rest of Latin America: Dairy Alternatives Market, by Distribution Channel, 2023–2035 (USD Million)
Table 314 Rest of Latin America: Business to Business Dairy Alternatives Market, by Type, 2023–2035 (USD Million)
Table 315 Rest of Latin America: Business to Customer Dairy Alternatives Market, by Type 2023–2035 (USD Million)
Table 316 Middle East & Africa: Dairy Alternatives Market, by Product Type, 2023–2035 (USD Million)
Table 317 Middle East & Africa: Dairy Alternatives Market, by Product Type, 2023–2035 (Tons)
Table 318 Middle East & Africa: Plant-Based Milk Market, by Type, 2023–2035 (USD Million)
Table 319 Middle East & Africa: Plant-Based Milk Market, by Type, 2023–2035 (Tons)
Table 320 Middle East & Africa: Dairy Alternatives Market, by Source, 2023–2035 (USD Million)
Table 321 Middle East & Africa: Dairy Alternatives Market, by Formulation, 2023–2035 (USD Million)
Table 322 Middle East & Africa: Dairy Alternatives Market, by Distribution Channel, 2023–2035 (USD Million)
Table 323 Middle East & Africa: Business to Business Dairy Alternatives Market, by Type, 2023–2035 (USD Million)
Table 324 Middle East & Africa: Business to Customer Dairy Alternatives Market, by Type 2023–2035 (USD Million)
Table 325 Recent Developments, by Company (2020–2024)
List of Figures
Figure 1 Research Process
Figure 2 Secondary Sources Referenced for this Study
Figure 3 Primary Research Techniques
Figure 4 Key Executives Interviewed
Figure 5 Breakdown of Primary Interviews (Supply Side & Demand Side)
Figure 6 Market Sizing and Growth Forecast Approach
Figure 7 In 2025, the Plant-based Milk Segment to Dominate the Global Dairy Alternatives Market
Figure 8 In 2025, the Almond Segment to Dominate the Global Dairy Alternatives Market
Figure 9 In 2025, the Unflavored Segment to Dominate the Global Dairy Alternatives Market
Figure 10 In 2025, the Business-to-Consumer (B2C) Segment to Dominate the Overall Dairy Alternatives Market
Figure 11 In 2025, Asia-Pacific Dominates the Overall Dairy Alternatives Market
Figure 12 Impact Analysis of Market Dynamics
Figure 13 Dairy Alternatives Market: Porter’s Five Forces Analysis
Figure 14 Global Dairy Alternatives Market, by Product Type, 2025 Vs. 2035 (USD Million)
Figure 15 Global Dairy Alternatives Market, by Product Type, 2025 Vs. 2035 (Tons)
Figure 16 Global Dairy Alternatives Market, by Source, 2025 Vs. 2035 (USD Million)
Figure 17 Global Dairy Alternatives Market, by Formulation, 2025 Vs. 2035 (USD Million)
Figure 18 Global Dairy Alternatives Market, by Distribution Channel, 2025 Vs. 2035 (USD Million)
Figure 19 North America: Dairy Alternatives Market Snapshot (2025)
Figure 20 Europe: Dairy Alternatives Market Snapshot (2025)
Figure 21 Asia-Pacific: Dairy Alternatives Market Snapshot (2025)
Figure 22 Latin America: Dairy Alternatives Market Snapshot (2025)
Figure 23 Middle East & Africa: Dairy Alternatives Market Snapshot (2025)
Figure 24 Key Growth Strategies Adopted by Leading Players (2022–2025)
Figure 25 Global Dairy Alternatives Market Competitive Benchmarking, by Product Type
Figure 26 Global Dairy Alternatives Market Competitive Benchmarking, by Source
Figure 27 Competitive Dashboard: Global Dairy Alternatives Market
Figure 28 Danone S.A.: Financial Overview (2024)
Figure 29 Hain Celestial Group, Inc.: Financial Overview (2024)
Figure 30 Valsoia S.p.A.: Financial Overview (2024)
Figure 31 SunOpta, Inc.: Financial Overview (2024)
Figure 32 Nestlé S.A.: Financial Overview (2024)
Figure 33 Oatly Group AB: Financial Overview (2024)
Figure 34 Blue Diamond Growers: Financial Overview (2024)


Published Date: Apr-2026
Published Date: May-2025
Published Date: Jan-2025
Published Date: Aug-2024
Subscribe to get the latest industry updates