Resources
About Us
Alternative Protein Market Size, Share, Forecast, & Trends Analysis by Type (Plant Protein [Soy, Pea, Potato], Insect Protein [Crickets, BSF], Microbial [Algae Protein, Fungal Proteins]), Application (Food & Beverage, Animal Feed) - Global Forecast to 2032
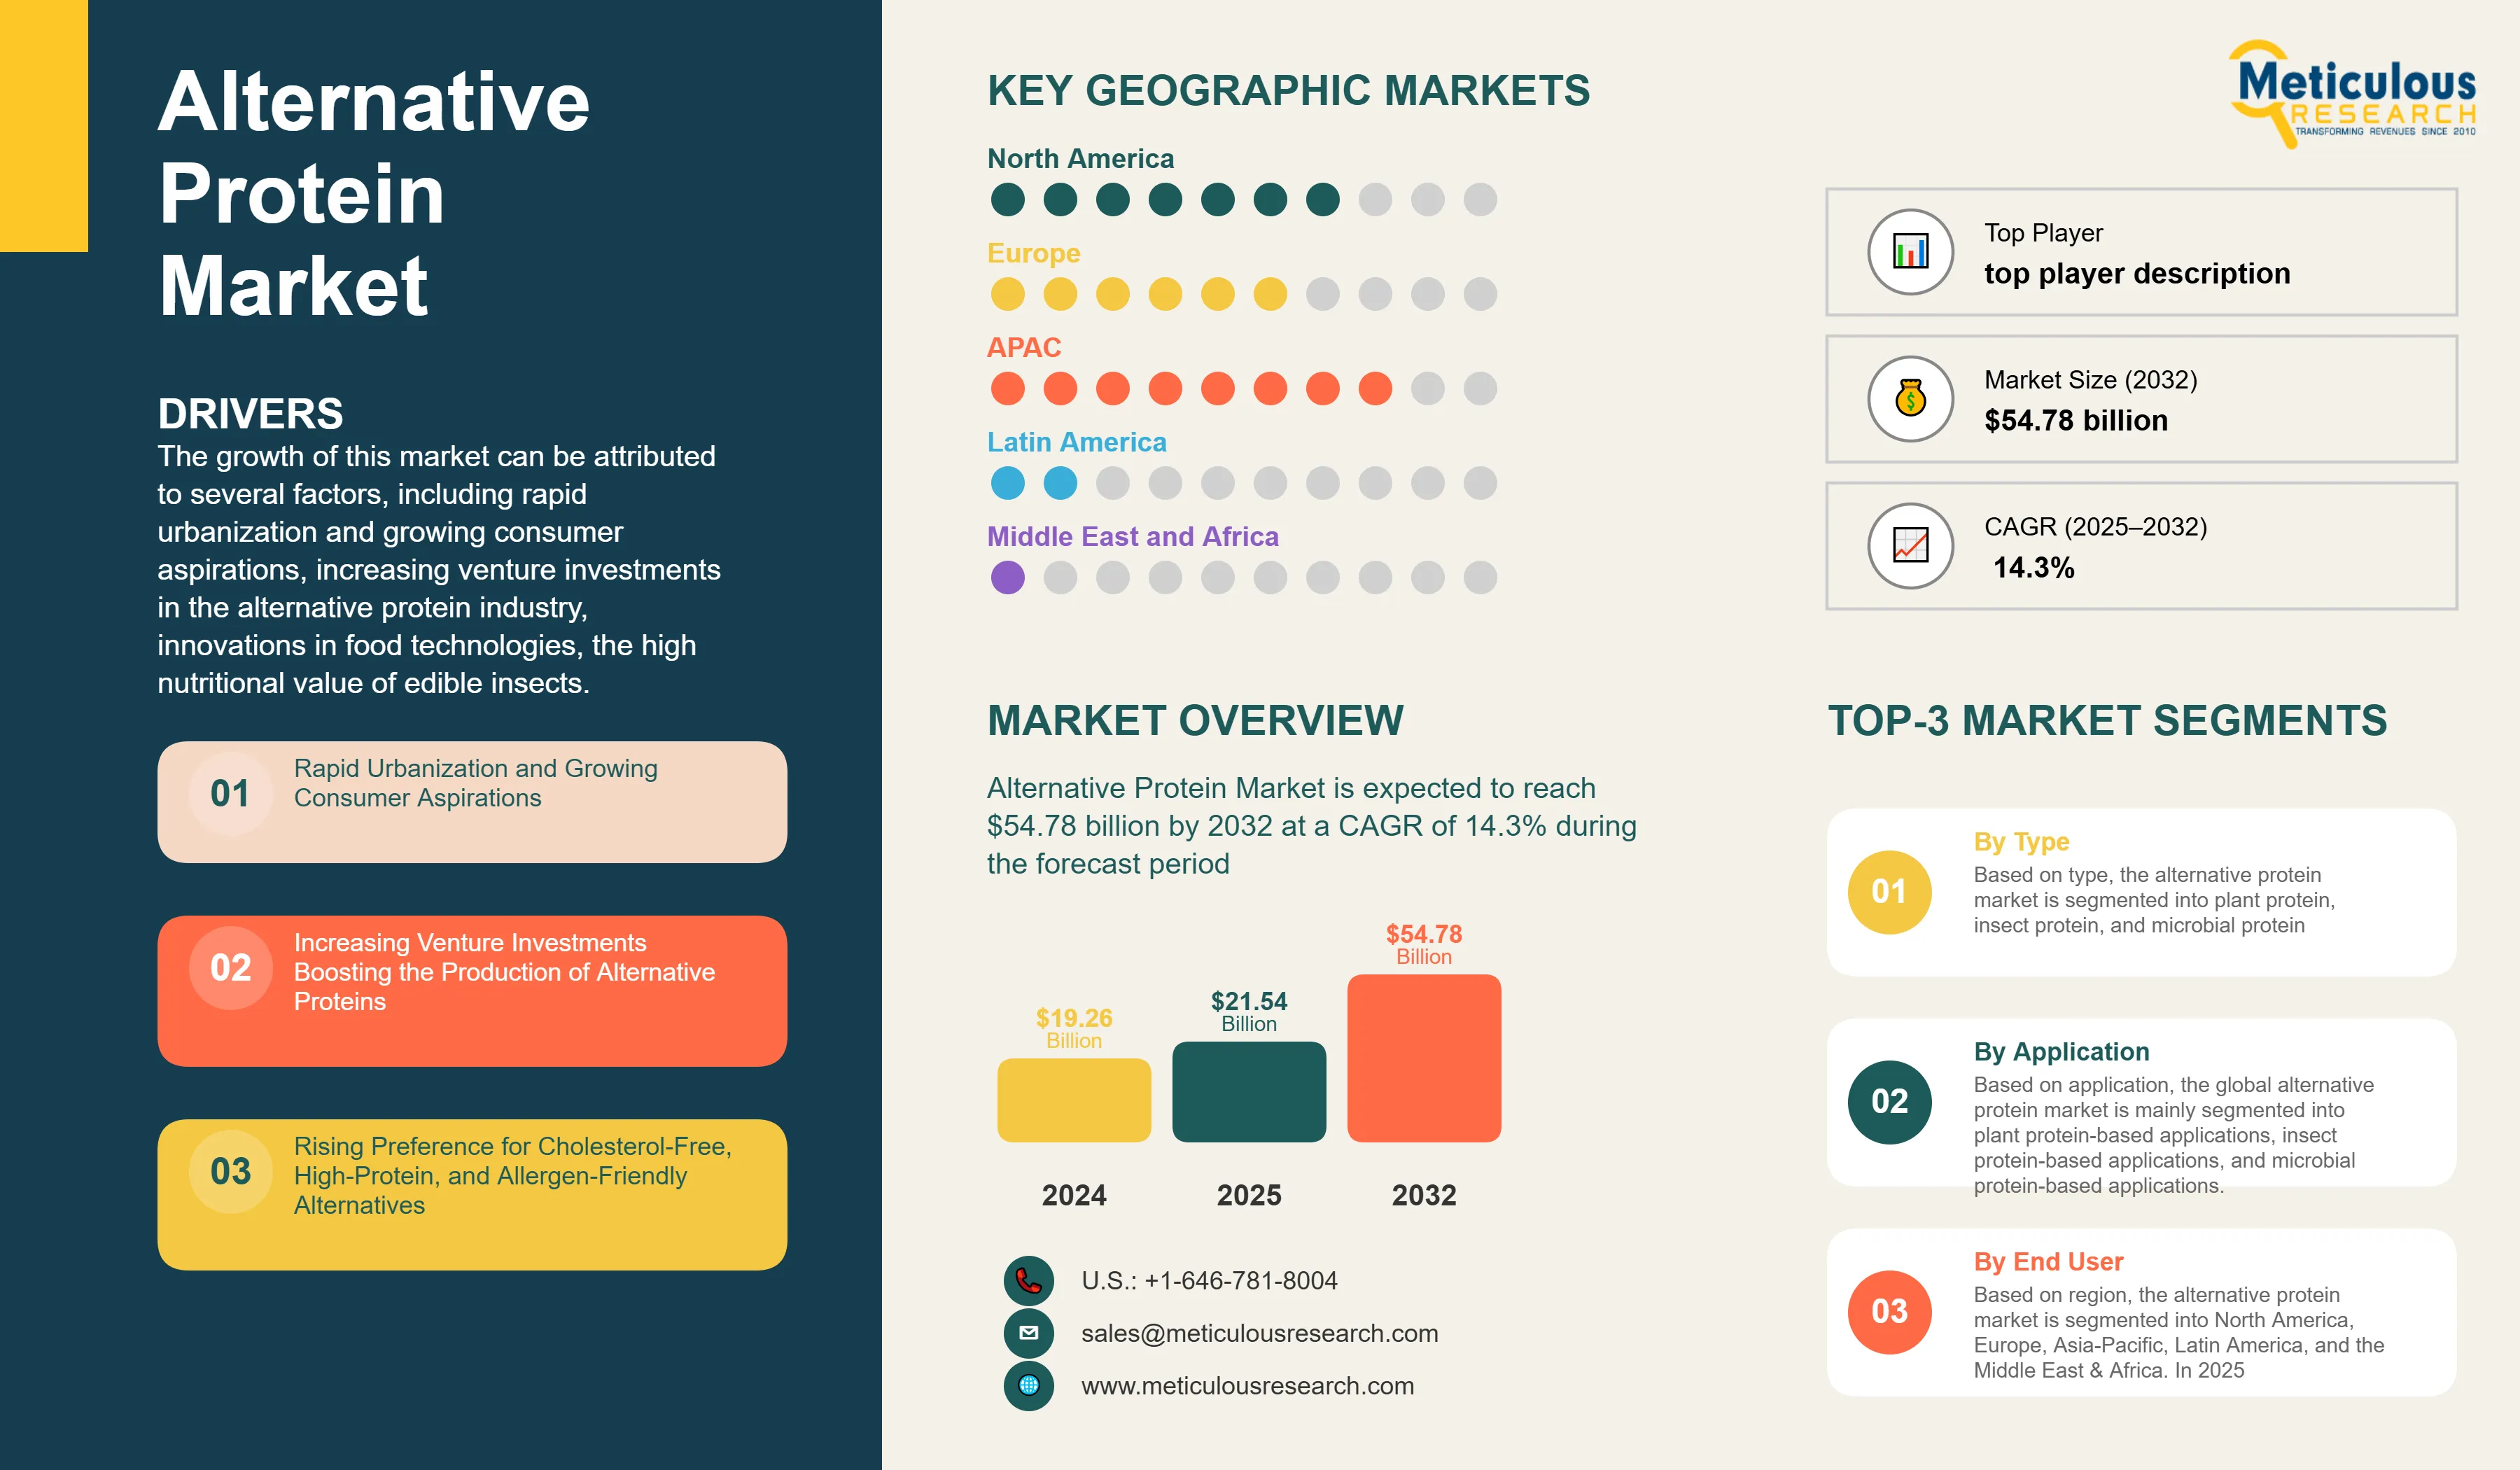
Report ID: MRFB - 104269 Pages: 700780 May-2025 Formats*: PDF Category: Food and Beverages Delivery: 2 to 4 Hours Download Free Sample ReportThe growth of this market can be attributed to several factors, including rapid urbanization and growing consumer aspirations, increasing venture investments in the alternative protein industry, innovations in food technologies, the high nutritional value of edible insects, and the environmental sustainability of alternative protein production and consumption. However, the higher costs of alternative protein compared to conventional protein and consumers’ high preference for animal-based products restrain the growth of this market. Furthermore, consumers’ increasing inclination toward plant-based foods is expected to generate growth opportunities for the players operating in the alternative protein market.
Well-established meat and dairy product manufacturers are being targeted by civil society groups and new food businesses due to ethical and animal welfare concerns. Plant-based products, including protein, are animal cruelty-free and, therefore, ethical and more sustainable. Protein diversification has the potential to transform food companies’ core business and value proposition due to its higher profitability, lower risk exposure, and the ability to compete and innovate.
The growing trend of millennials adopting flexitarian and meat-free diets indicates a change in consumption habits, a significant shift from earlier generations. Companies across the food value chain, from producers to retailers, are already investing in these opportunities. Some companies are hedging against or preparing for a decline in the demand for animal products and investing in companies that produce plant-based alternatives. In the past few years, market players have received investments/funding from several high-profile individuals, financial investors, and companies. According to the Good Food Institute, in 2023, the alternative protein industry received $1.6 billion, followed by an additional $899 million during the first three quarters of 2024. These contributions brought the cumulative investment in the sector to over $16 billion.
Alternative proteins are increasingly becoming a staple in modern-day diets. Consumer demand for ethical, sustainable, and healthy protein sources is driving investments and innovation in the meat and dairy substitutes industry. Innovative food is a category of agrifood tech encompassing novel food products and ingredients, such as alternative meat (plant-based and cell-culture-based), insect protein, alternative sugars, and flavor enhancers. According to the venture capital firm AgFunder, global investments in food tech and agtech start-ups reached $16 billion in 2024. The category is dominated by animal-free alternative meat and dairy products and healthy ingredient alternatives.
Advances in alternative protein-based products are generating a great deal of interest among consumers and the mainstream news. They are becoming increasingly common in retail outlets and foodservice menus. Animal agriculture is inherently inefficient, particularly in terms of feed conversion. According to the World Resources Institute (WRI), even the most efficient source of meat – chicken – converts only around 11% of gross feed energy into animal protein (WRI 2016). Innovations in food technologies have enabled the production of various alternative protein, ranging from advanced plant-based protein to cultured meat products without animals.
Thus, the food technology revolution is expected to fundamentally disrupt the current market and make protein more sustainable, supporting the growth of the alternative protein market.
In recent years, there has been a significant growth in vegetarianism and veganism globally due to increasing health and environmental awareness and compassion for animals. The popularity of vegan diets continues to rise, as evidenced by participation in the Veganuary campaign, which saw approximately 700,000 participants in January 2023, up from 692,000 in 2022, 582,000 in 2021, and 400,000 in 2020. Over 1.5 billion individuals worldwide identify as vegetarians (source: Great Green Wall organization), while the World Animal Foundation estimates approximately 88 million vegans globally. In Europe, the vegan population has risen from 13 million in 2016 to 2.5 million in 2020, representing 3.2% of the total European population, according to the European Vegetarian Union (EVU).
Veganism refers to the practice of refraining from using eggs, dairy, meat, and other animal-derived products. Vegans consume products that contain ingredients or components derived from plant sources. Increasing health concerns and allergic reactions to egg and dairy products have shifted consumers’ focus toward veganism. Additionally, consumers believe that veganism can help reduce the risk of chronic diseases such as heart disease and cancer. Increasing concerns regarding animal welfare and the environment have also encouraged many consumers to choose vegan foods. This growth in veganism has boosted the demand for plant-based products such as pea protein, soy protein, and flaxseeds.
According to the Academy of Nutrition and Dietetics, suitably planned vegetarian, including vegan diets, are healthful and nutritionally acceptable. They decrease the danger of certain ailments, including ischemic heart disease, Type 2 diabetes, hypertension, certain types of cancer, and obesity. These diets are suitable for all lifecycle stages, including pregnancy, lactation, infancy, childhood, adolescence, and older adulthood, as well as for athletes. Thus, increasing veganism is generating significant growth opportunities for the players operating in the alternative protein market.
Sustainability is a key driver in the growing demand for alternative protein, with environmental concerns influencing consumer choices and industry innovations. Traditional animal-based protein have a significant ecological footprint, contributing to greenhouse gas emissions, land use, and water consumption. In contrast, alternative protein—especially plant-based and insect-based options—are seen as more sustainable, offering a smaller environmental impact. Plant-based protein, such as those from soy, peas, and lentils, require fewer natural resources and produce lower emissions compared to livestock farming. Similarly, insect-based protein are emerging as an eco-friendly alternative, with insects requiring minimal space, water, and feed, while also having a high feed-to-protein conversion ratio.
As consumers become more conscious of the environmental effects of their food choices, the demand for sustainable protein sources continues to rise. This shift is driving innovation in the alternative protein sector, with companies focusing on improving the scalability and affordability of plant-based and insect protein. In response, many food producers are expanding their product lines to include more eco-friendly options, making sustainability a cornerstone of the future protein market.
Based on type, the alternative protein market is segmented into plant protein, insect protein, and microbial protein. In 2025, the plant protein segment is expected to account for the largest share of 81.3% of the alternative protein market. The large share of this market is mainly attributed to the growing demand from food & beverage manufacturers, the rising population of individuals adopting vegan diets, the increase in plant-based products, and the large number of plant protein manufacturers globally.
However, the insect protein segment is expected to grow at the highest CAGR of 29.4% during the forecast period of 2025–2032. The high growth rate of this segment is mainly driven by the growing demand for environmentally friendly protein-rich food and the growing investments in edible insect farming.
Based on type, the plant protein market is segmented into soy protein, wheat protein, pea protein, canola protein, potato protein, rice protein, corn protein, and other plant proteins. In 2025, the soy protein segment is expected to account for the largest share of 54.9% of the plant protein market. The large share of this segment is attributed to its easy availability, lower price of soy protein, increased demand for meat protein alternatives, a wide range of applications in various products, and multiple health benefits.
Soy protein is extensively used in food and beverage products such as meat substitutes, dairy alternatives, nutritional supplements, and bakery goods due to its high protein content and favorable amino acid profile. Additionally, growing awareness of lactose intolerance and cholesterol-related health issues has further propelled consumers toward soy-based products. The strong presence of soy protein in both developed and emerging markets, coupled with technological advancements in food processing, has also contributed to its market dominance. Furthermore, rising investments in plant-based food innovations and the increasing adoption of vegan and vegetarian lifestyles are expected to sustain the growth of the soy protein segment in the coming years.
Based on type, the insect protein market is segmented into crickets, black soldier fly (BSF), and other insect proteins. In 2025, the crickets segment is expected to account for the largest share of 47.3% of the insect protein market. The large share of this segment is attributed to its high nutritional value, the ease of farming and processing of crickets, the incorporation of crickets into various food recipes and products, and the increasing demand for cricket-based products, such as protein powders, protein bars, and snacks. However, the black soldier fly segment is expected to register the highest CAGR during the forecast period.
Based on type, the microbial protein market is segmented into algae protein, fungal protein, and bacterial protein. In 2025, the algae protein segment is expected to account for the largest share of 70.0% of the microbial protein market. The large market share of this segment is mainly attributed to the growth of the dietary supplements industry, the rising preference for spirulina-sourced products, and the increasing number of products that include algae as ingredients.
Moreover, this segment is expected to grow at the fastest CAGR of 14.0% during the forecast period. The high growth rate of this segment is driven by factors such as the increasing vegetarian population, the rising incidences of diet-related diseases, such as malnutrition, the growth of the nutraceutical industry, and the increasing usage of chlorella in aquaculture diets.
Based on application, the global alternative protein market is mainly segmented into plant protein-based applications, insect protein-based applications, and microbial protein-based applications. In 2025, the plant protein-based applications segment is expected to account for the largest share of 81.3% of the alternative protein market. The large share of this segment is attributed to the growing vegetarian and vegan population, consumers' rising demand for clean-label products, and the increasing investments and expansions by plant-based product manufacturers. However, the insect protein-based applications segment is expected to record the highest CAGR during the forecast period.
Based on application, the plant protein market is segmented into food & beverage, animal feed, nutrition & health supplements, pharmaceuticals, and other plant protein-based applications. In 2025, the food & beverage segment is expected to account for the largest share of 60.7% of the global plant protein market. The large market share of this segment is mainly attributed to increasing consumer preference for plant-based foods and ingredients, the growing awareness and demand for protein-rich food products, the versatile functionality and compatibility of plant-based protein with vegetarian and vegan lifestyles, and the rise of clean-label trends.
However, the nutrition & health supplements segment is expected to record a CAGR of 11.8% during the forecast period. The growth of this segment is mainly attributed to changing lifestyles, growing health & wellness trends, and the increasing prevalence of diseases.
Based on application, the insect protein market is segmented into food & beverage and animal feed. In 2025, the food & beverage segment is expected to account for the largest share of the global insect protein market. The large share of this segment is driven by the growing food shortage worldwide, the increasing consumption of processed whole insects as food, and the rising demand for high-quality alternative protein and amino acid sources among end users.
Based on application, the microbial protein market is segmented into nutraceuticals, food & beverage, animal feed, cosmetics, and other microbial protein-based applications. In 2025, the nutraceuticals segment is expected to account for the largest share of 50.1% of the overall microbial protein market. The large share of this market is mainly attributed to the wide use of microbial protein in health supplements and the improved nutritional value of these products with the addition of microbial protein ingredients. This segment is expected to grow at the fastest CAGR during the forecast period, fueled by increasing investments in research and development, expanding consumer awareness about the health benefits of alternative proteins, and the growing global market for functional foods and dietary supplements.
Asia-Pacific: Fastest Growing Market
Based on region, the alternative protein market is segmented into North America, Europe, Asia-Pacific, Latin America, and the Middle East & Africa. In 2025, North America is expected to account for the largest share of 38.0% of the global alternative protein market. North America’s alternative protein market is estimated to be worth USD 8.2 billion in 2025. The prominent position of North America in the alternative protein market is attributed to the increasing focus on producing protein using sustainable methods due to the rising environmental concerns and ethical aspects associated with animal protein, the increasing vegan population, the rising number of investments in alternative protein products, the increasing demand for healthy & nutritional products, and technological advancements in the food industry. Moreover, North America has become a hub for innovation in food technology, with significant investments from both private and public sectors into research and development of alternative protein sources such as plant-based, microbial, and cultured meat proteins. The presence of major market players, a strong startup ecosystem, and a high rate of product launches have further accelerated the market's growth.
However, Asia-Pacific is expected to record the highest CAGR of 16.4% during the forecast period. The growth of this regional market is mainly attributed to the increasing awareness regarding the importance of protein-rich diets, the increasing technological advancements in the food & beverages industry, the fast-growing economy, and the wide availability of raw materials. Additionally, the rising middle-class population and increasing urbanization in countries such as China, India, Indonesia, and Vietnam are driving higher consumption of convenient, nutritious, and sustainable food products. Government initiatives to improve food security and promote sustainable agricultural practices are also supporting the development and adoption of alternative proteins.
Moreover, the growing prevalence of lifestyle-related diseases, such as obesity and diabetes, is encouraging consumers to shift toward healthier, plant-based, and microbial protein options. The expanding vegan and flexitarian consumer base, along with increasing investments by domestic and international food tech companies, is further accelerating the growth of the alternative protein market in the Asia-Pacific region. Strategic partnerships, local production capabilities, and cultural openness to new food trends also contribute to the region’s strong market potential.
The report offers a competitive analysis based on an extensive assessment of the leading players’ product portfolios, geographic presence, and key growth strategies adopted in the last 3–4 years. Some of the key players operating in the global alternative protein market are Archer-Daniels-Midland Company (U.S.), Cargill, Incorporated (U.S.), Roquette Frères (France), Ingredion Incorporated (U.S.), Kerry Group plc (Ireland), International Flavors & Fragrances Inc. (IFF) (U.S.), Now Health Group, Inc. (U.S.), Tate & Lyle Plc (U.K.), Axiom Foods Inc. (U.S.), Burcon NutraScience Corporation (Canada), BENEO GmbH (A Part of Südzucker AG) (Germany), Glanbia Plc (Ireland), Sotexpro (France), Farbest-Tallman Foods Corporation (U.S.), CHS Inc. (U.S.), Ÿnsect (SAS) (France), Protix B.V. (Netherlands), Entomo Farms (Canada), Global Bugs Asia Co., Ltd. (Thailand), Aspire Food Group (U.S.), EnviroFlight, LLC (U.S.), Haocheng Mealworm Inc. (China), JR Unique Foods Ltd. (Thailand), Armstrong Cricket Farm Georgia (U.S.), Rocky Mountain Micro Ranch (U.S.), Cricket Lab Limited (U.K.), DIC Corporation (Japan), Cellena Inc. (U.S.), Taiwan Chlorella Manufacturing Company (Taiwan), Cyanotech Corporation (U.S.), Bluebiotech International GmbH (Germany), Pond Technologies Holdings Inc. (Canada), E.I.D.-Parry (India) Limited (India), Tianjin Norland Biotech Co., Ltd. (China), MycoTechnology Inc. (U.S.), Enough. (U.K.), Corbion NV (Netherlands), Sun Chlorella Corporation (Japan), Plantible Foods, Inc. (U.S.), Far East Bio-Tec Co., Ltd. (Taiwan), Far East Microalgae Industries, Co. Ltd. (Taiwan), Algenofarm Klötze Gmbh & Co. KG (Germany), Yaeyama Shokusan Co., Ltd. (Japan), Unibio Group (Denmark), String Bio (India), Calysta, Inc. (U.S.), Angel Yeast Co., Ltd (China), and Lesaffre (France).
|
Particulars |
Details |
|
Number of Pages |
700 |
|
Format |
|
|
Forecast Period |
2025–2032 |
|
Base Year |
2024 |
|
CAGR (Value) |
14.3% |
|
Market Size (Value) |
USD 54.78 Billion by 2032 |
|
Segments Covered |
By Type
By Application
|
|
Countries Covered |
North America (U.S., Canada), Asia-Pacific (China, India, Japan, Australia, and Rest of Asia-Pacific), Europe (France, Germany, Italy, Spain, U.K., and Rest of Europe), Latin America (Brazil, Mexico, Argentina, Colombia, Chile, Peru, Ecuador, and Rest of Latin America), and the Middle East & Africa. |
|
Key Companies |
Archer-Daniels-Midland Company (U.S.), Cargill, Incorporated (U.S.), Roquette Frères (France), Ingredion Incorporated (U.S.), Kerry Group plc (Ireland), International Flavors & Fragrances Inc. (IFF) (U.S.), Now Health Group, Inc. (U.S.), Tate & Lyle Plc (U.K.), Axiom Foods Inc. (U.S.), Burcon NutraScience Corporation (Canada), BENEO GmbH (A Part of Südzucker AG) (Germany), Glanbia Plc (Ireland), Sotexpro (France), Farbest-Tallman Foods Corporation (U.S.), CHS Inc. (U.S.), Ÿnsect (SAS) (France), Protix B.V. (Netherlands), Entomo Farms (Canada), Global Bugs Asia Co., Ltd. (Thailand), Aspire Food Group (U.S.), EnviroFlight, LLC (U.S.), Haocheng Mealworm Inc. (China), JR Unique Foods Ltd. (Thailand), Armstrong Cricket Farm Georgia (U.S.), Rocky Mountain Micro Ranch (U.S.), Cricket Lab Limited (U.K.), DIC Corporation (Japan), Cellena Inc. (U.S.), Taiwan Chlorella Manufacturing Company (Taiwan), Cyanotech Corporation (U.S.), Bluebiotech International GmbH (Germany), Pond Technologies Holdings Inc. (Canada), E.I.D.-Parry (India) Limited (India), Tianjin Norland Biotech Co., Ltd. (China), MycoTechnology Inc. (U.S.), Enough. (U.K.), Corbion NV (Netherlands), Sun Chlorella Corporation (Japan), Plantible Foods, Inc. (U.S.), Far East Bio-Tec Co., Ltd. (Taiwan), Far East Microalgae Industries, Co. Ltd. (Taiwan), Algenofarm Klötze Gmbh & Co. KG (Germany), Yaeyama Shokusan Co., Ltd. (Japan), Unibio Group (Denmark), String Bio (India), Calysta, Inc. (U.S.), Angel Yeast Co., Ltd (China), and Lesaffre (France). |
The report on the alternative protein market encompasses protein ingredients originating from a range of innovative sources as substitutes for traditional animal protein. These sources include plant-based, edible insect-based, and microbial-based protein ingredients.
This global alternative protein market report provides detailed market insights and market size & forecasts of alternative protein in terms of value (by type, application, and geography) & volume (by type and geography). Each segment provides the market size & forecast for five key geographies (North America, Europe, Asia-Pacific, Latin America, and the Middle East & Africa) along with the key countries.
The alternative protein market is projected to reach $54.78 billion by 2032, at a CAGR of 14.3% during the forecast period 2025–2032.
The plant protein segment is expected to hold the major share of the market in 2025.
The growth of this market is driven by rapid urbanization and growing consumer aspirations, increasing venture investments in the alternative protein industry, innovations in food technologies, the high nutritional value of edible insects, and the environmental sustainability of alternative protein production and consumption. Furthermore, the consumers’ increasing inclination toward plant-based diets is expected to support the growth of this market.
The key players operating in the global alternative protein market are Archer-Daniels-Midland Company (U.S.), Cargill, Incorporated (U.S.), Roquette Frères (France), Ingredion Incorporated (U.S.), Kerry Group plc (Ireland), International Flavors & Fragrances Inc. (IFF) (U.S.), Now Health Group, Inc. (U.S.), Tate & Lyle Plc (U.K.), Axiom Foods Inc. (U.S.), Burcon NutraScience Corporation (Canada), BENEO GmbH (A Part of Südzucker AG) (Germany), Glanbia Plc (Ireland), Sotexpro (France), Farbest-Tallman Foods Corporation (U.S.), CHS Inc. (U.S.), Ÿnsect (SAS) (France), Protix B.V. (Netherlands), Entomo Farms (Canada), Global Bugs Asia Co., Ltd. (Thailand), Aspire Food Group (U.S.), EnviroFlight, LLC (U.S.), Haocheng Mealworm Inc. (China), JR Unique Foods Ltd. (Thailand), Armstrong Cricket Farm Georgia (U.S.), Rocky Mountain Micro Ranch (U.S.), Cricket Lab Limited (U.K.), DIC Corporation (Japan), Cellena Inc. (U.S.), Taiwan Chlorella Manufacturing Company (Taiwan), Cyanotech Corporation (U.S.), Bluebiotech International GmbH (Germany), Pond Technologies Holdings Inc. (Canada), E.I.D.-Parry (India) Limited (India), Tianjin Norland Biotech Co., Ltd. (China), MycoTechnology Inc. (U.S.), Enough. (U.K.), Corbion NV (Netherlands), Sun Chlorella Corporation (Japan), Plantible Foods, Inc. (U.S.), Far East Bio-Tec Co., Ltd. (Taiwan), Far East Microalgae Industries, Co. Ltd. (Taiwan), Algenofarm Klötze Gmbh & Co. KG (Germany), Yaeyama Shokusan Co., Ltd. (Japan), Unibio Group (Denmark), String Bio (India), Calysta, Inc. (U.S.), Angel Yeast Co., Ltd (China), and Lesaffre (France).
The emerging countries from the Asia-Pacific and Latin America regions are expected to offer significant growth opportunities for vendors in the alternative protein market during the forecast period.


Published Date: May-2026
Published Date: May-2025
Published Date: Feb-2025
Published Date: Aug-2024
Published Date: May-2024
Please enter your corporate email id here to view sample report.
Subscribe to get the latest industry updates