Resources
About Us
Dairy Alternatives Market by Product Type (Plant-Based Milk, Cheese, Yogurt, Butter, Ice Cream), Source (Almond, Soy, Oat, Coconut), Form, Application, Distribution Channel, End User, & Geography - Global Forecast to 2035
Report ID: MRFB - 104432 Pages: 250 May-2025 Formats*: PDF Category: Food and Beverages Delivery: 24 to 48 Hours Download Free Sample ReportThis report examines the global market for dairy alternatives, focusing on how manufacturers and solution providers are responding to the rising incidence of lactose intolerance and dairy allergies, growing health consciousness, environmental sustainability concerns, and the increasing adoption of vegan and plant-based diets worldwide. It offers a strategic evaluation of market dynamics, forecasts growth through 2035, and assesses competitive positioning at both global and regional/country levels.
Key Market Drivers & Trends and Insights
Click here to: Get Free Sample Pages of this Report
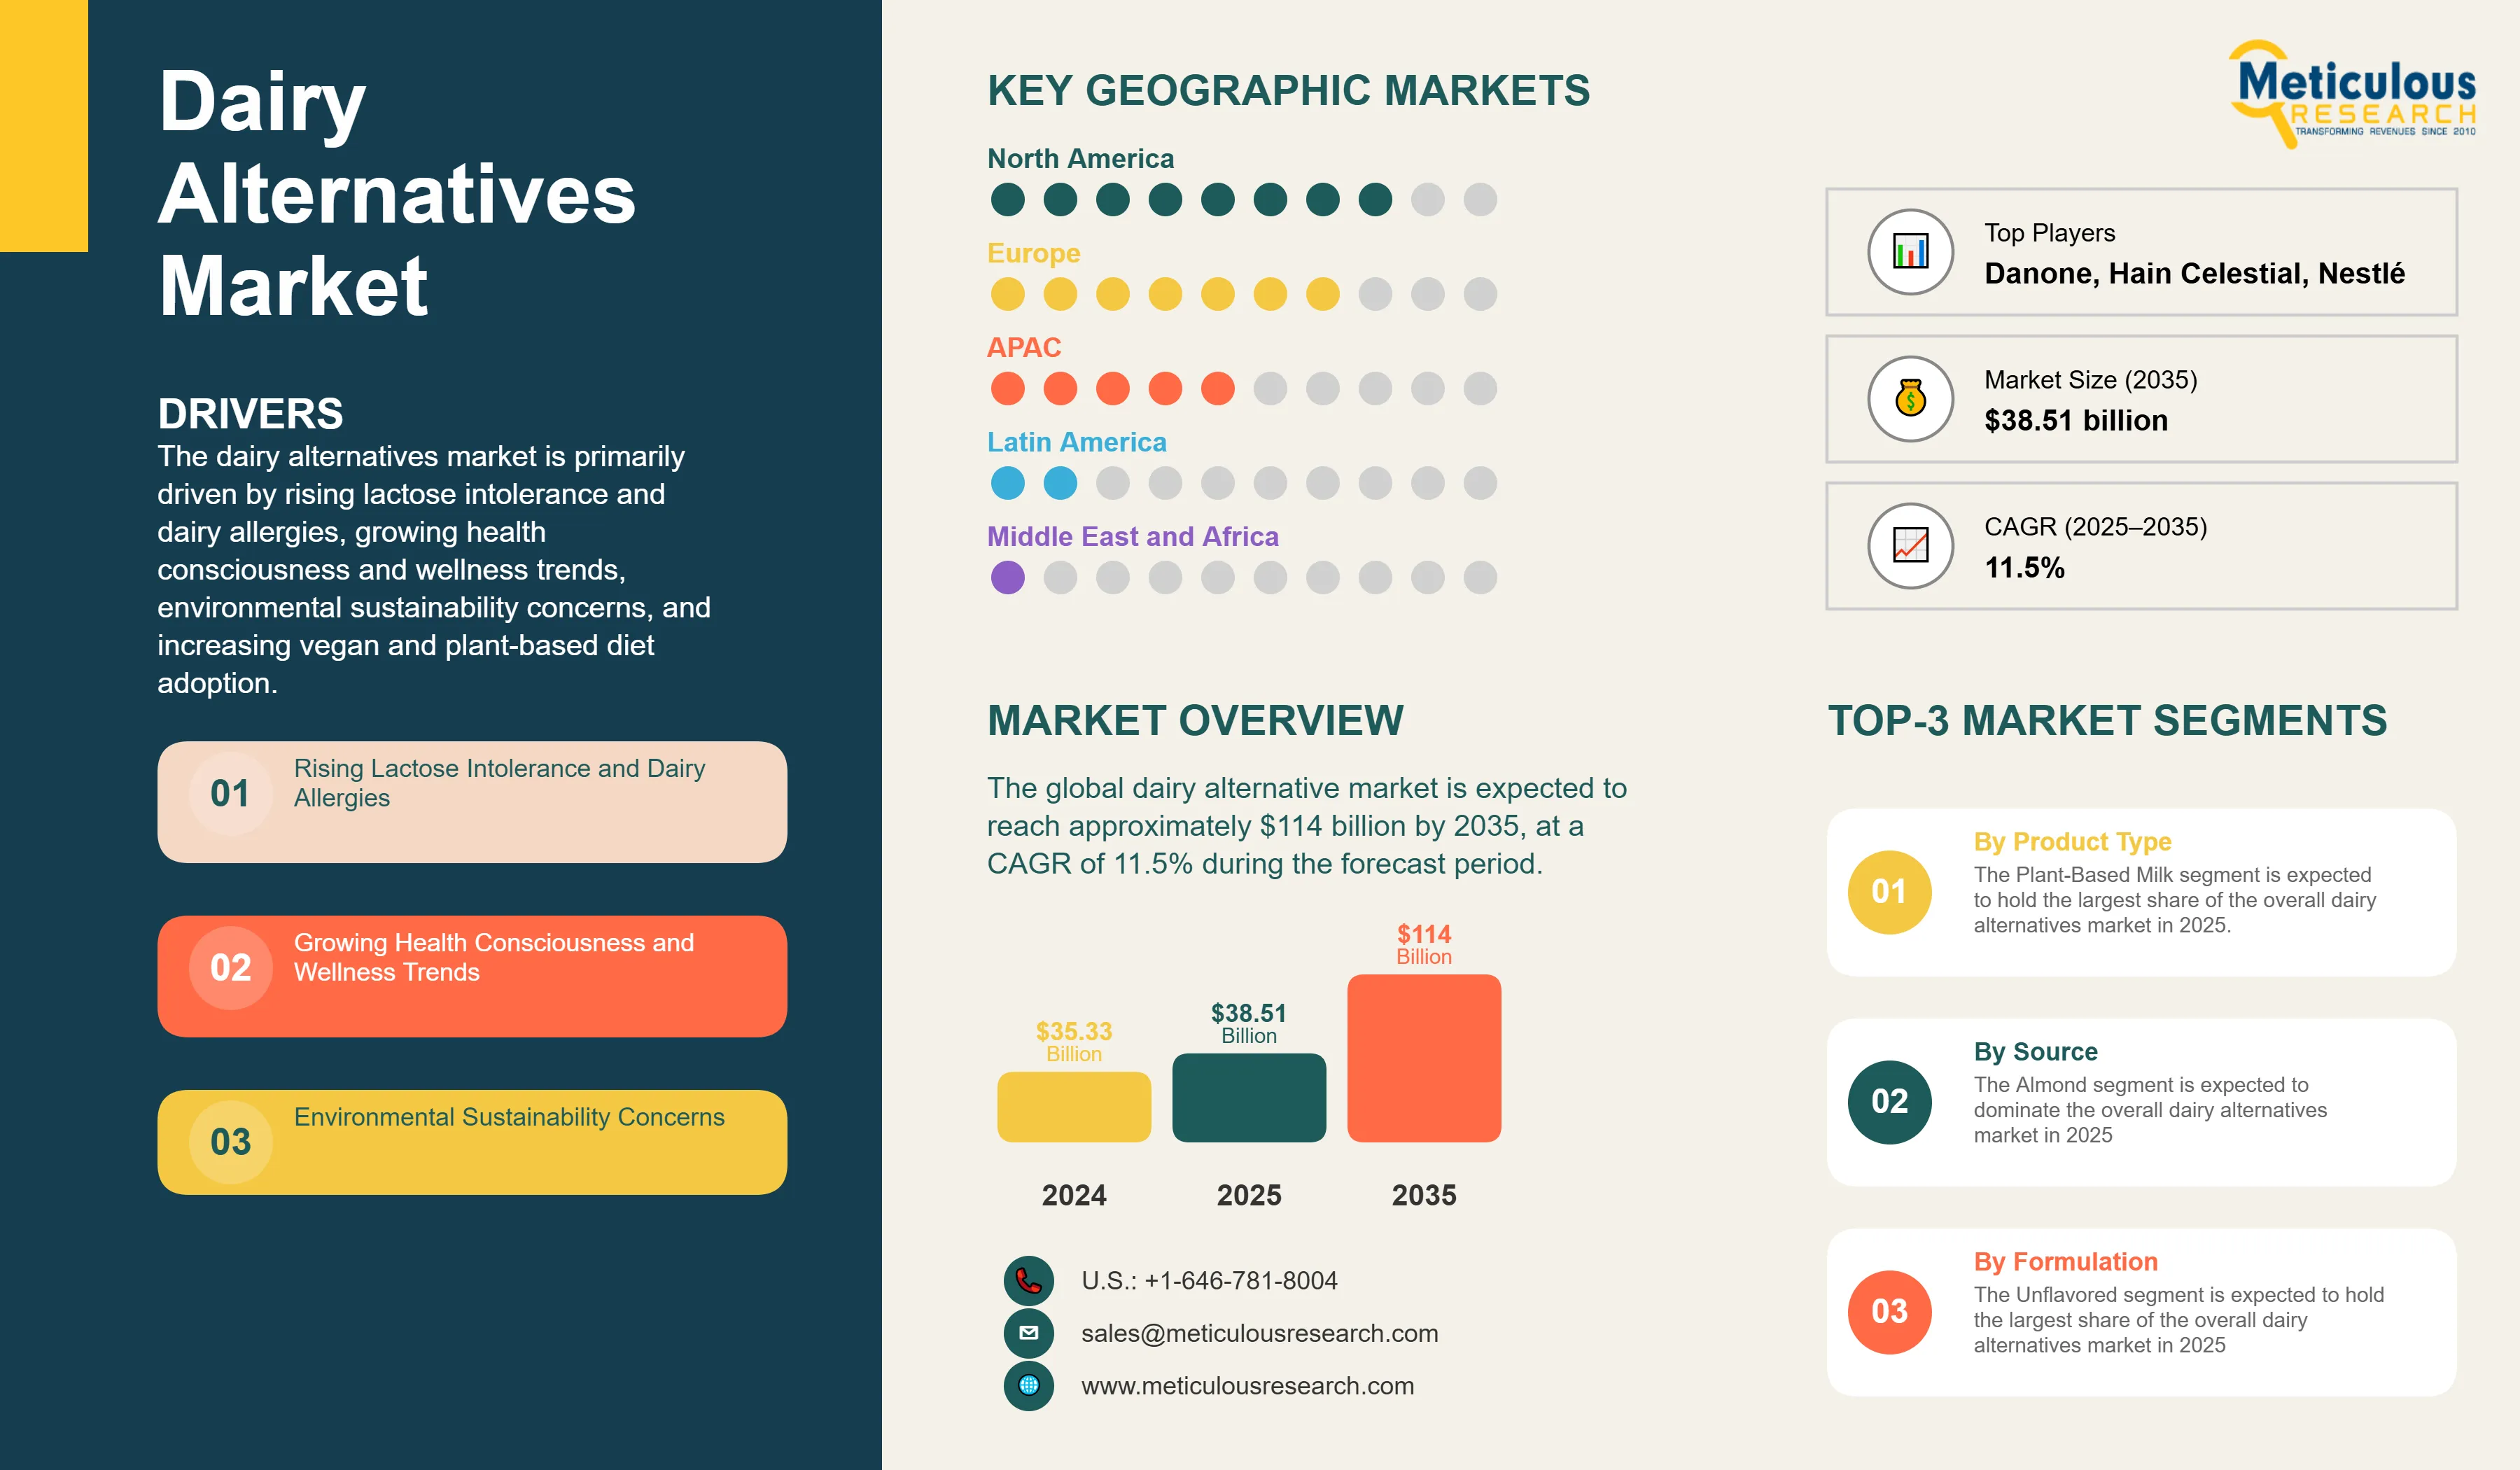
The dairy alternatives market is primarily driven by rising lactose intolerance and dairy allergies, growing health consciousness and wellness trends, environmental sustainability concerns, and increasing vegan and plant-based diet adoption. Product innovation and taste improvements are reshaping the industry, while premium and organic product lines, protein-enriched alternatives, and barista-quality products for coffee applications are gaining significant traction. Additionally, sustainable packaging solutions and the expansion of functional and fortified product development are further driving market growth, especially in developed markets with established retail infrastructure.
Key Challenges
Although the dairy alternatives market holds substantial growth potential, it encounters several challenges such as higher costs compared to conventional dairy products, taste and texture acceptance challenges, and nutritional content variations. Furthermore, hurdles like limited shelf life of some products, regulatory labeling requirements, supply chain complexity, and raw material price volatility pose significant barriers that could hinder market adoption in different parts of the world.
Growth Opportunities
The dairy alternatives market presents numerous avenues for high growth. Emerging markets offer substantial expansion opportunities for market players looking to reach new customer bases. Functional and fortified product development provides another key opportunity, enhancing the nutritional profile and appeal of dairy alternatives. Moreover, food service industry penetration and private label market growth are generating new revenue streams for solution providers as organizations seek efficient alternatives to conventional dairy products. The expansion of dairy alternatives in B2B channels, particularly through food services and hospitality sectors, institutional buyers, and food and beverage manufacturers, presents significant opportunities for bulk sales and ingredient applications.
Market Segmentation Highlights
By Product Type
The Plant-Based Milk segment is expected to hold the largest share of the overall dairy alternatives market in 2025, with oat milk and almond milk leading the category due to their superior taste profiles and growing consumer acceptance across the globe. However, the Cheese segment is expected to grow at the fastest CAGR during the forecast period, driven by continuous product innovations, improved taste and texture, and increasing applications in foodservice and retail sectors.
By Source
The Almond segment is expected to dominate the overall dairy alternatives market in 2025, primarily due to its established market presence and wide consumer acceptance. However, the Oat segment is expected to grow at the fastest CAGR through the forecast period, driven by its superior taste profile, creamy texture, and sustainability credentials that resonate with environmentally conscious consumers.
By Formulation
The Unflavored segment is expected to hold the largest share of the overall dairy alternatives market in 2025, due to its versatility in various applications and consumer preference for natural products. However, the Flavored segment is expected to experience the fastest growth rate during the forecast period, driven by increasing consumer demand for variety, improved taste profiles, and innovative flavor combinations.
Distribution Channel
The Business-to-Consumer (B2C) segment through Modern Groceries is expected to hold the largest share of the overall dairy alternatives market in 2025, due to the widespread availability and consumer shopping preferences. Within the B2B segment, Food Services and Hospitality is expected to dominate, driven by increasing adoption of dairy alternatives in restaurants, cafes, and hotels to cater to diverse dietary preferences. However, the Online Retail Stores segment within B2C is expected to experience the fastest growth rate during the forecast period, followed by Food and Beverage Manufacturers in the B2B segment, driven by expanding e-commerce infrastructure and growing use of dairy alternatives as ingredients in processed foods respectively.
By Geography
North America is expected to hold the largest share of the global dairy alternatives market in 2025, driven by high consumer awareness about health and wellness, established retail infrastructure, strong adoption of plant-based diets, and significant investments in product innovation. Additionally, favorable regulatory environment and high disposable income contribute significantly to market dominance. Europe follows as the second-largest market, bolstered by strong sustainability focus and increasing environmental consciousness. However, Asia-Pacific is witnessing the fastest growth rate during the forecast period, primarily driven by expanding middle-class population, growing awareness about lactose intolerance, rising disposable income, and the advantages dairy alternatives offer in addressing traditional dietary restrictions.
Competitive Landscape
The global dairy alternatives market is characterized by a diverse competitive environment, comprising established food and beverage manufacturers, specialized plant-based product companies, dairy industry leaders diversifying their portfolios, and innovative startups, each adopting unique approaches to advancing dairy alternative technologies and products.
Within this landscape, solution providers are segmented into industry leaders, market differentiators, vanguards, and emerging companies, with each group implementing distinct strategies to sustain their competitive edge. Leading companies are prioritizing integrated product portfolios that merge traditional dairy expertise with innovative plant-based solutions, while also addressing consumer preferences specific to various regions.
Key Players
The key players operating in the global dairy alternatives market are Danone S.A., Hain Celestial Group, Inc., Sahmyook Foods, Sanitarium Health and Wellbeing Company, Axiom Foods, Inc., Daiya Foods, Inc. (A Part of Otsuka Pharmaceutical Co., Ltd.), Earth's Own Food Company Inc., SunOpta Inc., Valsoia S.p.A., Plamil Foods Ltd., Nestlé S.A., Oatly Group AB, Sunrise Soy Foods, Miyoko's Creamery, Blue Diamond Growers, among others.
|
Particulars |
Details |
|
Number of Pages |
250 |
|
Format |
PDF & Excel |
|
Forecast Period |
2025–2035 |
|
Base Year |
2024 |
|
CAGR (Value) |
11.5% |
|
Market Size (Value) in 2025 |
USD 38.51 Billion |
|
Market Size (Value) in 2035 |
USD 114 Billion |
|
Segments Covered |
Market Assessment, by Product Type
Market Assessment, by Source
Market Assessment, by Formulation
Market Assessment, by Distribution Channel
|
|
Countries Covered |
North America (U.S., Canada), Europe (Germany, U.K., France, Italy, Spain, Netherlands, Belgium, Austria, Poland, Portugal, Rest of Europe), Asia-Pacific (China, Japan, India, Australia, Thailand, South Korea, Rest of Asia-Pacific), Latin America (Brazil, Mexico, Argentina, Rest of Latin America), Middle East & Africa |
|
Key Companies |
Danone S.A., Hain Celestial Group, Inc., Sahmyook Foods, Sanitarium Health and Wellbeing Company, Axiom Foods, Inc., Daiya Foods, Inc., Earth's Own Food Company Inc., SunOpta Inc., Valsoia S.p.A., Plamil Foods Ltd., Nestlé S.A., Oatly Group AB, Sunrise Soy Foods, Miyoko's Creamery, Blue Diamond Growers |
The global dairy alternative market size was valued at USD 35.33 billion in 2024 and is expected to reach approximately USD 114 billion by 2035, growing from an estimated USD 38.51 billion in 2025, at a CAGR of 11.5% during the forecast period of 2025–2035.
The global dairy alternative market is expected to grow at a CAGR of 11.5% during the forecast period of 2025–2035, driven by increasing health consciousness, environmental concerns, and growing adoption of plant-based diets.
The global dairy alternative market is expected to reach approximately USD 114 billion by 2035, growing from an estimated USD 38.51 billion in 2025, representing more than double the market size over the ten-year forecast period.
The key companies operating in this market include Danone S.A., Nestlé S.A., Oatly Group AB, Blue Diamond Growers, Hain Celestial Group, Inc., SunOpta Inc., Daiya Foods, Inc., Earth's Own Food Company Inc., Valsoia S.p.A., Miyoko's Creamery, and others.
Major trends shaping the market include premium and organic product lines, protein-enriched alternatives, sustainable packaging solutions, barista-quality products for coffee applications, and functional and fortified product development.
• In 2025, the Plant-Based Milk segment is expected to dominate the overall dairy alternatives market by product type
• Based on source, the Almond segment is expected to hold the largest share of the overall market in 2025
• Based on formulation, the Unflavored segment is expected to hold the largest share of the overall market in 2025
• Based on distribution channel, the Modern Groceries segment is expected to hold the largest share of the global market in 2025
North America is expected to hold the largest share of the global dairy alternatives market in 2025, driven by high consumer awareness, established retail infrastructure, and strong adoption of plant-based diets. Asia-Pacific is witnessing the fastest growth rate during the forecast period.
The growth of this market is driven by rising lactose intolerance and dairy allergies, growing health consciousness and wellness trends, environmental sustainability concerns, and increasing vegan and plant-based diet adoption.


Published Date: Apr-2026
Published Date: May-2025
Published Date: Jan-2025
Published Date: Aug-2024
Please enter your corporate email id here to view sample report.
Subscribe to get the latest industry updates