Resources
About Us
Key factors driving the growth of the cooling towers market include increasing industrial activities and power generation needs, rising demand for energy-efficient cooling solutions & HVAC applications in commercial buildings, and strict environmental regulations that support sustainable cooling technologies. However, high initial investment and installation costs, water scarcity and treatment issues, and maintenance and operational complexities requiring special skills are challenging the growth of this market to a certain extent.
There are also untapped opportunities in emerging markets with rapid industrialization. The integration of smart technologies and the Internet of Things for predictive maintenance, development of hybrid and modular cooling systems, and growing renewable energy sector offer significant growth potential for market players. Notable trends in this market include the use of eco-friendly and sustainable materials, modular and pre-fabricated cooling tower systems, advanced water treatment technologies, and digitalization with predictive maintenance capabilities.
Increasing Industrial Activities and Power Generation Requirements
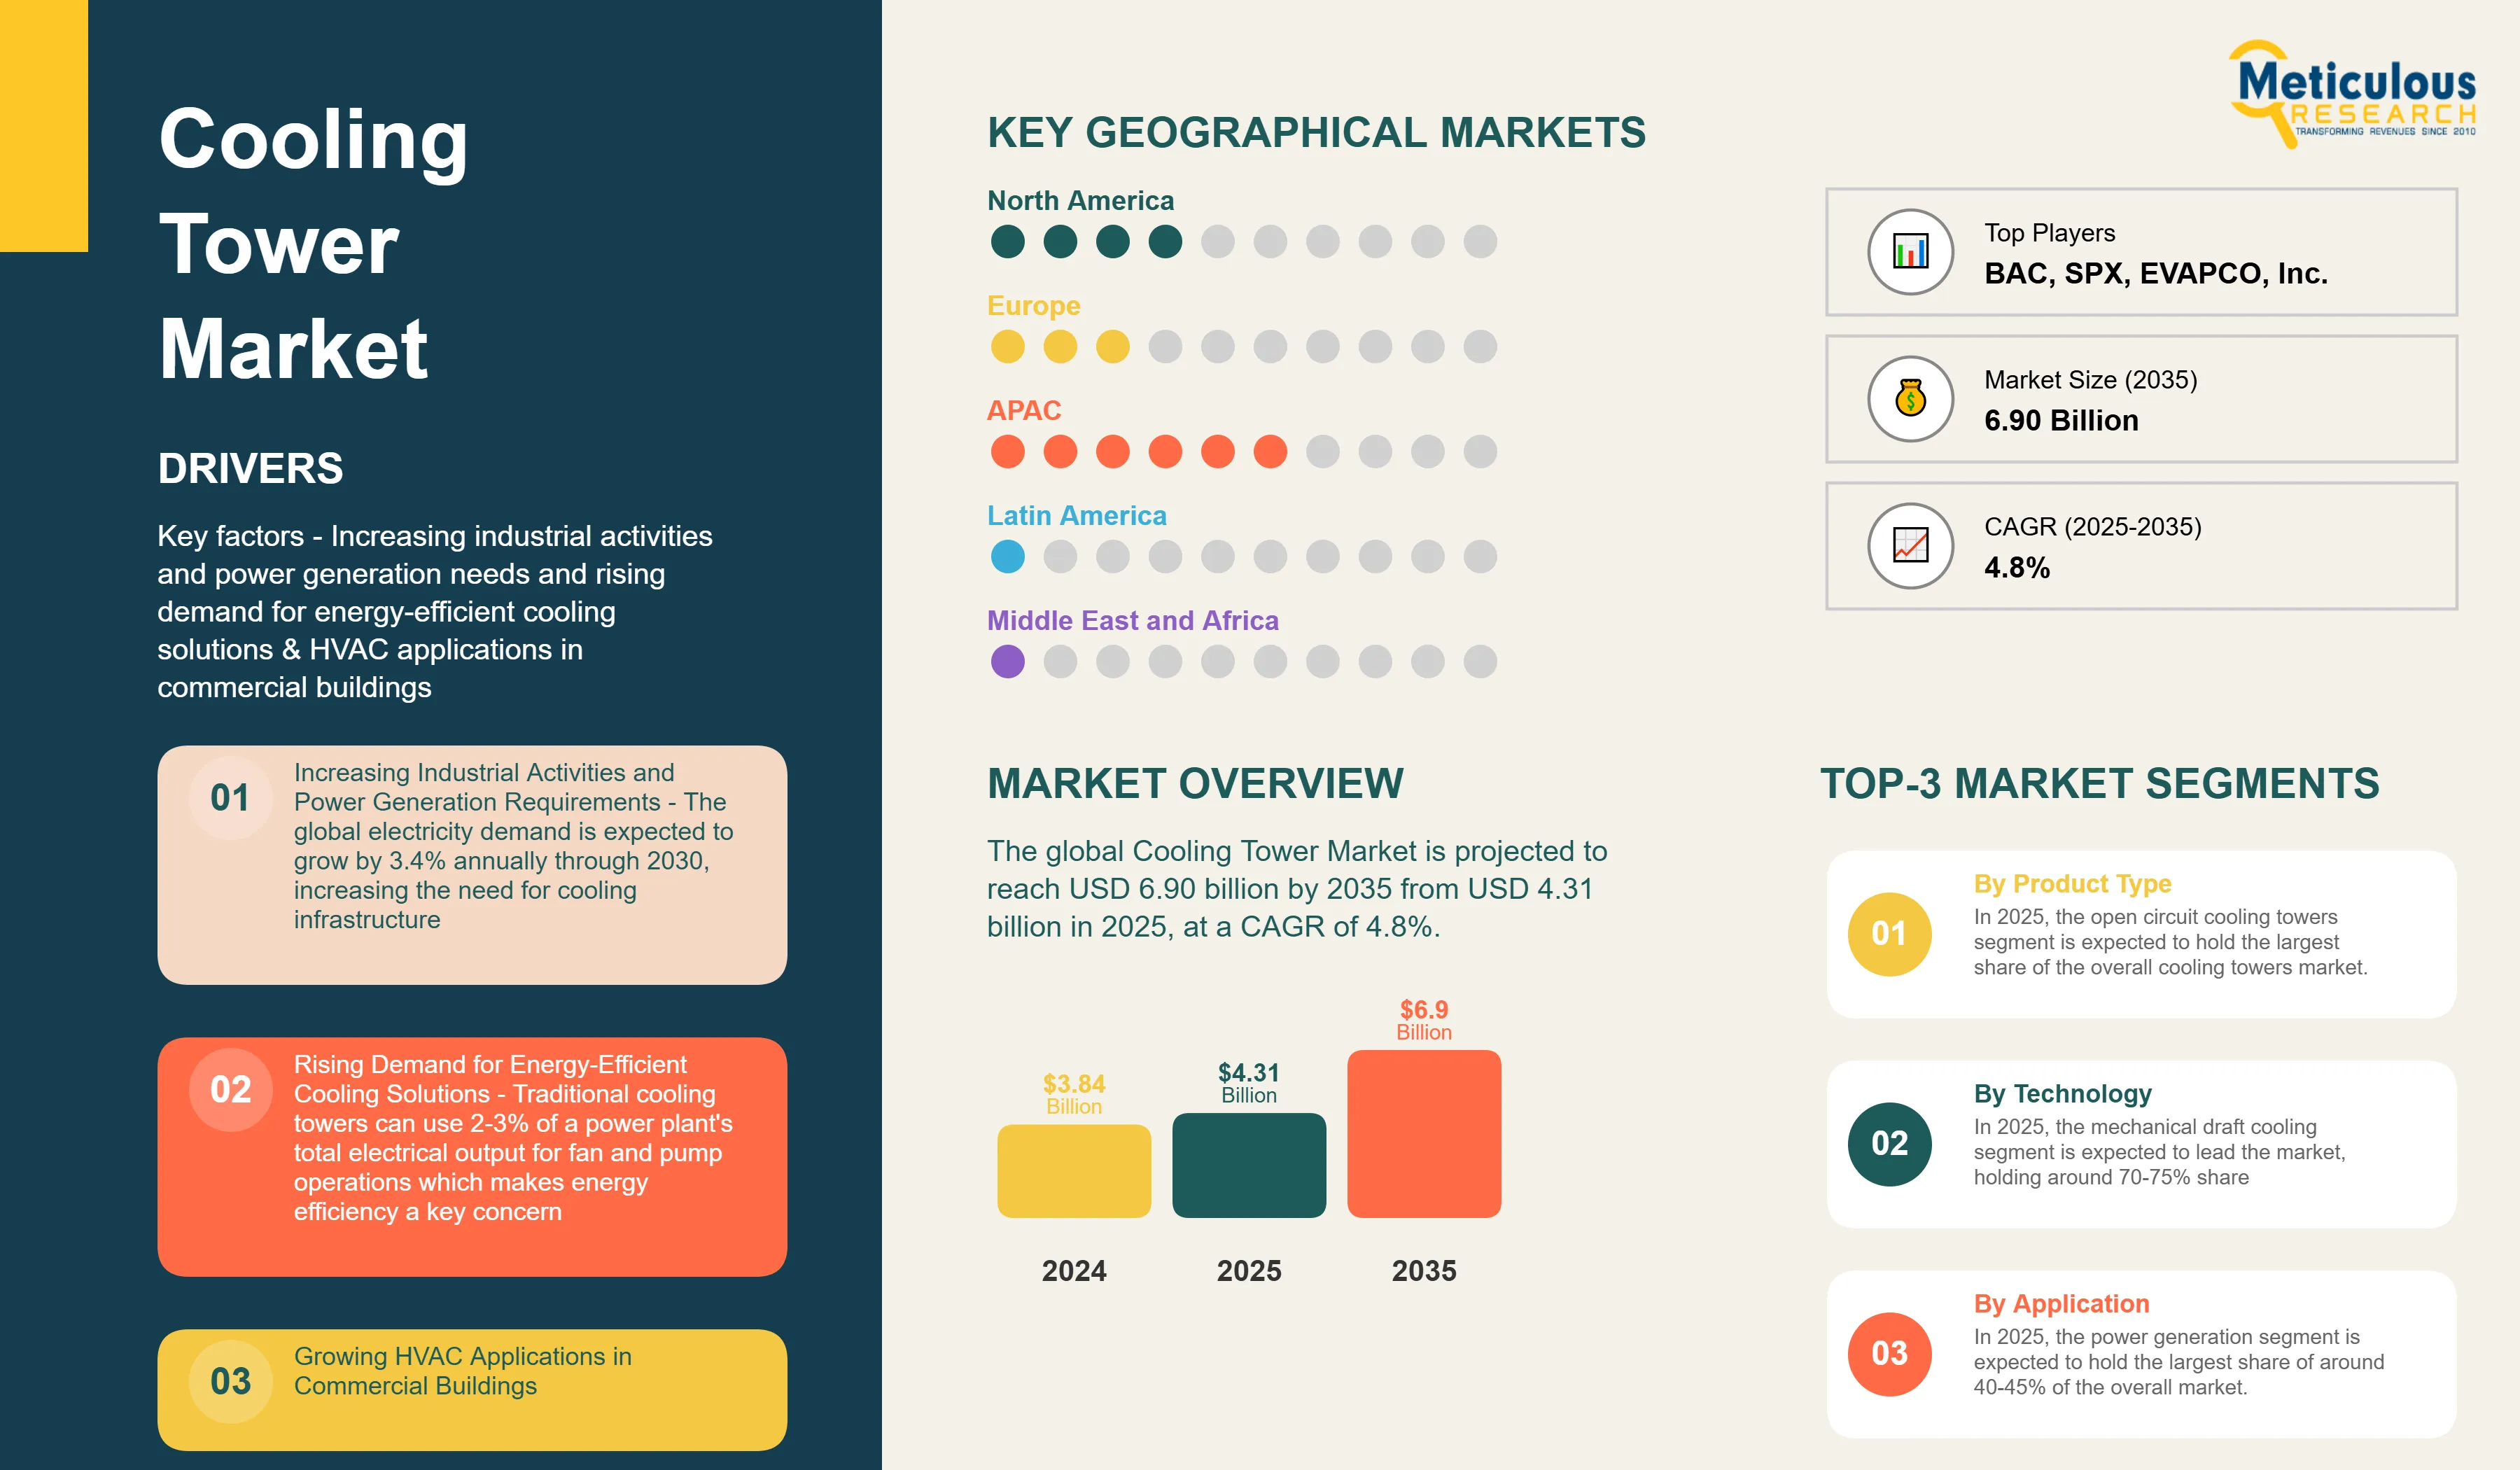
According to the IEA (International Energy Agency), global electricity demand is expected to grow by 3.4% annually through 2030, increasing the need for cooling infrastructure. Power plants make up about 40-45% of the global cooling tower market; they need effective heat rejection systems to keep operating temperatures in check and ensure reliable electricity production. As global industrialization expands—especially in emerging economies—sectors like manufacturing, chemical processing, steel, petrochemicals, and food & beverage are consuming more energy and producing more heat. These processes require efficient thermal management, making cooling towers essential to maintain operational safety and productivity.
According to the International Energy Agency, electricity demand is growing at ~3.4% annually through 2026, especially in regions like China, India, and Southeast Asia. The rise in air conditioning demand alone will add ~1,200 TWh to global electricity requirements by 2035—far exceeding growth from data centers, and largely centered in emerging economies. Power plants—both thermal and nuclear—rely on cooling towers to condense turbines and manage heat. As electricity generation expands to meet rising demand, so too does demand for cooling infrastructure. Each megawatt of installed power generation capacity usually requires cooling systems that can reject 2-3 times the electrical output as waste heat. This creates a strong need for cooling tower installations.
Industrial processes in petrochemical, steel, chemical, and manufacturing sectors produce large amounts of process heat that must be removed efficiently to maintain ideal production conditions. The growth of these industries, especially in emerging economies, is increasing the need for specialized cooling tower solutions tailored to specific industrial applications.
Rising Demand for Energy-Efficient Cooling Solutions
The increasing focus on energy efficiency and cutting operational costs is boosting demand for better cooling tower technologies. Traditional cooling towers can use 2-3% of a power plant's total electrical output for fan and pump operations. This makes energy efficiency a key concern for plant operators.
Modern cooling tower designs that include variable frequency drives (VFDs), high-efficiency fans, and improved heat transfer materials can lower energy use by 20-30% compared to older systems. Using smart controls and IoT sensors allows for real-time adjustments of cooling tower performance based on weather conditions and load needs.
The rising emphasis on sustainability and reducing carbon footprints is leading to the use of dry and hybrid cooling technologies. These methods lower water use while still providing efficient heat rejection. They are especially useful in areas with limited water supplies and for projects that aim to lessen their environmental impact.
Growing HVAC Applications in Commercial Buildings
The growth of commercial construction and the rising need for advanced HVAC systems in office buildings, shopping centers, hospitals, and data centers are creating significant opportunities for cooling tower manufacturers. Commercial HVAC systems need dependable heat rejection to keep indoor spaces comfortable and protect sensitive equipment.
Data centers are one of the fastest-growing parts of the cooling tower market. They need constant cooling to avoid equipment overheating and to ensure reliable operations. The rapid increase in data processing, cloud computing, and digital infrastructure is fueling the demand for specialized cooling tower solutions meant for critical applications.
The push for green building certifications and energy-efficient design is encouraging the use of high-performance cooling tower systems. These systems help reduce energy use and lessen environmental impact while still delivering optimal performance.
By Product Type
On the basis of product type, the cooling towers market is divided into open circuit cooling towers, closed circuit cooling towers, hybrid cooling towers, dry cooling towers, and evaporative condensers. In 2025, the open circuit cooling towers segment is expected to hold the largest share of the overall cooling towers market. This is mainly attributed to their lower initial cost, broad use in various industries, and proven reliability in different operating conditions.
However, the closed circuit cooling towers segment is projected to grow at the highest CAGR of 5.2% during the forecast period from 2025 to 2035. This can be attributed to the rising focus on contamination-free cooling applications, increased use in sensitive industrial processes, better resistance to corrosion, and lower maintenance needs compared to open circuit systems.
By Technology
Based on technology, the cooling towers market is divided into natural draft cooling, mechanical draft cooling, and hybrid draft cooling. In 2025, the mechanical draft cooling segment is expected to lead the market, holding around 70-75% share of the overall cooling towers market. The largest share is mainly attributed to their compact design, smaller space needs, and flexibility in installation and operation for different uses.
The mechanical draft cooling segment is also projected to grow at the highest CAGR during the forecast period. This growth is fueled by rising industrial applications, increasing demand for modular and pre-fabricated systems, and better controllability compared to natural draft systems.
By Flow Type
Based on flow type, the cooling towers market is divided into counterflow, crossflow, and parallel flow. In 2025, the counterflow segment is expected to lead the market with a share of about 60-65%. This growth is due to their better thermal efficiency, compact design, and lower water use compared to crossflow systems.
The counterflow segment is also projected to grow at the highest CAGR during the forecast period, fueled by the rising demand for energy-efficient cooling solutions, increasing use in spaces with limited room, and excellent performance in different operating conditions.
By Application
On the basis of application, the cooling towers market is categorized into power generation, oil & gas refining, petrochemical, chemical processing, steel & metal production, food & beverage processing, pharmaceutical manufacturing, data centers, HVAC systems, and others. In 2025, the power generation segment is expected to hold the largest share of around 40-45% of the overall market. This is due to the ongoing increase in power generation capacity and a growing need for efficient heat rejection systems.
On the other hand, the data centers segment is anticipated to grow at the highest CAGR of 5.8% from 2025 to 2035. This growth is driven by the rapid rise in data processing needs, expansion of cloud computing, digital transformation efforts, and rising demand for critical cooling solutions that ensure reliable operations.
Regional Analysis
Based on geography, the cooling towers market is divided into North America, Europe, Asia-Pacific, Latin America, and the Middle East & Africa. In 2025, the Asia-Pacific region is expected to hold the largest share of around 45-50% of the global cooling towers market. This is due to the region's fast industrial growth, large power generation expansion, growing manufacturing sector, and increasing infrastructure development.
The Asia-Pacific cooling towers market is also projected to grow at the highest CAGR during the forecast period from 2025 to 2035. Rising industrial activities, expansion in power generation capacity, rapid urbanization leading to commercial construction, and awareness of energy-efficient cooling technologies are some of the factors driving the growth of this regional segment. China and India are driving regional growth, while developed markets such as Japan and South Korea concentrate on incorporating advanced technologies and high-efficiency solutions.
Competitive Landscape
The cooling towers market includes a mix of established industrial equipment manufacturers, specialized cooling tower firms, and engineering companies that compete on technological innovation, energy efficiency, reliability, and service capabilities. Leading players in the global cooling towers market are Baltimore Aircoil Company (BAC), SPX Cooling Technologies (SPX Corporation), EVAPCO, Inc., Delta Cooling Towers, Inc., Johnson Controls International plc, Babcock & Wilcox Enterprises, Inc., Krones AG, John Cockerill (Belgium), Kelvion Holding GmbH, ENEXIO Water Technologies GmbH, Paharpur Cooling Towers Ltd., Thermax Limited, Seagull Cooling Tower Co., Ltd., Ebara Corporation, Hamon Corporation, MITA Cooling Technologies Srl, Tower Tech, Inc., Brentwood Industries, Inc., Cooling Tower Systems, Inc., and Longhua Group, among others.
These companies focus on strategies like developing energy-efficient and sustainable cooling technologies, investing in digitalization and IoT integration, expanding hybrid and dry cooling solutions, forming partnerships with power generation and industrial firms, and growing in high-growth emerging markets to strengthen their position and reach more customers.
|
Particulars |
Details |
|
Number of Pages |
178 |
|
Forecast Period |
2025–2035 |
|
Base Year |
2024 |
|
CAGR (Value) |
4.8% |
|
Market Size 2024 |
USD 3.84 billion |
|
Market Size 2025 |
USD 4.31 billion |
|
Market Size 2035 |
USD 6.90 billion |
|
Segments Covered |
By Product Type, Technology, Flow Type, Material, Application |
|
Countries Covered |
North America (U.S., Canada), Europe (Germany, France, U.K., Italy, Spain, Netherlands, Rest of Europe), Asia-Pacific (China, Japan, India, South Korea, Australia, Rest of Asia-Pacific), Latin America (Brazil, Mexico, Rest of Latin America), and the Middle East & Africa (Saudi Arabia, UAE, Rest of Middle East & Africa) |
The cooling towers market is projected to reach USD 6.90 billion by 2035 from USD 4.31 billion in 2025, at a CAGR of 4.8% during the forecast period.
In 2025, the open circuit cooling towers segment is projected to hold the major share of the cooling towers market, while the closed circuit cooling towers segment is slated to record the highest growth rate.
Key factors driving the growth include increasing industrial activities and power generation requirements, rising demand for energy-efficient cooling solutions, growing HVAC applications in commercial buildings, and stringent environmental regulations promoting sustainable cooling technologies.
Asia-Pacific leads the market with the highest share and is projected to record the highest growth rate during the forecast period, offering significant opportunities for cooling tower vendors.
Major opportunities include expansion in emerging markets with rapid industrialization, integration with smart technologies and IoT for predictive maintenance, development of hybrid and modular cooling systems, and growing renewable energy sector applications.
Key trends include adoption of eco-friendly and sustainable materials, modular and pre-fabricated cooling tower systems, advanced water treatment technologies, and digitalization with predictive maintenance capabilities.
The data centers segment is anticipated to record the highest growth rate during the forecast period, driven by exponential growth in data processing requirements, cloud computing expansion, and increasing demand for mission-critical cooling solutions.
1. Market Definition & Scope
1.1. Market Definition
1.2. Market Ecosystem
1.3. Currency
1.4. Key Stakeholders
2. Research Methodology
2.1. Research Approach
2.2. Process of Data Collection and Validation
2.2.1. Secondary Research
2.2.2. Primary Research/Interviews with Key Opinion Leaders from the Industry
2.3. Market Sizing and Forecast
2.3.1. Market Size Estimation Approach
2.3.1.1. Bottom-up Approach
2.3.1.2. Top-down Approach
2.3.2. Growth Forecast Approach
2.3.3. Assumptions for the Study
3. Executive Summary
3.1. Overview
3.2. Segmental Analysis
3.2.1. Cooling Towers Market, by Product Type
3.2.2. Cooling Towers Market, by Technology
3.2.3. Cooling Towers Market, by Flow Type
3.2.4. Cooling Towers Market, by Material
3.2.5. Cooling Towers Market, by Application
3.2.6. Cooling Towers Market, by Geography
3.3. Competitive Landscape
4. Market Insights
4.1. Overview
4.2. Factors Affecting Market Growth
4.2.1. Drivers
4.2.1.1. Increasing Industrial Activities and Power Generation
4.2.1.2. Rising Demand for Energy-Efficient Cooling Solutions
4.2.1.3. Growing HVAC Applications in Commercial Buildings
4.2.1.4. Stringent Environmental Regulations
4.2.2. Restraints
4.2.2.1. High Initial Investment and Installation Costs
4.2.2.2. Water Scarcity and Treatment Challenges
4.2.2.3. Maintenance and Operational Complexities
4.2.3. Opportunities
4.2.3.1. Expansion in Emerging Markets
4.2.3.2. Integration with Smart Technologies and IoT
4.2.3.3. Development of Hybrid and Modular Systems
4.2.3.4. Growing Renewable Energy Sector
4.2.4. Trends
4.2.4.1. Adoption of Eco-Friendly and Sustainable Materials
4.2.4.2. Modular and Pre-fabricated Cooling Tower Systems
4.2.4.3. Advanced Water Treatment Technologies
4.2.4.4. Digitalization and Predictive Maintenance
4.2.5. Challenges
4.2.5.1. Regulatory Compliance Across Different Regions
4.2.5.2. Legionella Prevention and Water Quality Management
4.2.5.3. Skilled Workforce Requirements
4.3. Porter’s Five Forces Analysis
4.3.1. Bargaining Power of Suppliers
4.3.2. Bargaining Power of Buyers
4.3.3. Threat of Substitutes
4.3.4. Threat of New Entrants
4.3.5. Degree of Competition
4.4. Sustainability Impact on the Cooling Towers Market
4.4.1. Environmental Sustainability Factors
4.4.1.1. Water Conservation Technologies
4.4.1.2. Energy-Efficient Fan Systems
4.4.1.3. Recyclable and Sustainable Materials
4.4.2. Market Response to Sustainability Demands
4.4.2.1. Regulatory Compliance and Green Building Standards
4.4.2.2. Manufacturer-led Sustainability Initiatives
4.4.3. Market Opportunities Created by Sustainability Focus
4.4.3.1. Dry and Hybrid Cooling Technologies
4.4.3.2. Challenges in Sustainable Manufacturing
5. Cooling Towers Market Assessment—By Product Type
5.1. Overview
5.2. Open Circuit Cooling Towers
5.3. Closed Circuit Cooling Towers
5.4. Hybrid Cooling Towers
5.5. Dry Cooling Towers
5.6. Evaporative Condensers
6. Cooling Towers Market Assessment—By Technology
6.1. Overview
6.2. Natural Draft Cooling
6.3. Mechanical Draft Cooling
6.4. Hybrid Draft Cooling
7. Cooling Towers Market Assessment—By Flow Type
7.1. Overview
7.2. Counterflow
7.3. Crossflow
7.4. Parallel Flow
8. Cooling Towers Market Assessment—By Material
8.1. Overview
8.2. Concrete
8.3. Fiberglass Reinforced Plastic (FRP)
8.4. Steel
8.5. Timber (Wood)
8.6. Others
9. Cooling Towers Market Assessment—By Application
9.1. Overview
9.2. Power Generation
9.3. Oil & Gas Refining
9.4. Petrochemical Industry
9.5. Chemical Processing
9.6. Steel & Metal Production
9.7. Food & Beverage Processing
9.8. Pharmaceutical Manufacturing
9.9. Data Centers
9.10. HVAC Systems
9.11. Others
10. Cooling Towers Market Assessment—By Geography
10.1. Overview
10.2. North America
10.2.1. U.S.
10.2.2. Canada
10.3. Europe
10.3.1. Germany
10.3.2. France
10.3.3. U.K.
10.3.4. Italy
10.3.5. Spain
10.3.6. Netherlands
10.3.7. Rest of Europe (RoE)
10.4. Asia-Pacific
10.4.1. China
10.4.2. Japan
10.4.3. India
10.4.4. South Korea
10.4.5. Australia
10.4.6. Rest of Asia-Pacific (RoAPAC)
10.5. Latin America
10.5.1. Brazil
10.5.2. Mexico
10.5.3. Rest of Latin America (RoLATAM)
10.6. Middle East & Africa
10.6.1. Saudi Arabia
10.6.2. United Arab Emirates (UAE)
10.6.3. Rest of Middle East & Africa (RoMEA)
11. Competitive Landscape
11.1. Overview
11.2. Key Growth Strategies
11.3. Competitive Benchmarking
11.4. Competitive Dashboard
11.4.1. Industry Leaders
11.4.2. Market Differentiators
11.4.3. Vanguards
11.4.4. Contemporary Stalwarts
11.5. Market Share/Ranking Analysis, by the Key Players, 2024
12. Company Profiles (Business Overview, Financial Overview, Product Portfolio, Strategic Developments, and SWOT Analysis*)
12.1. Baltimore Aircoil Company (BAC)
12.2. SPX Cooling Technologies (SPX Corporation)
12.3. EVAPCO, Inc.
12.4. Delta Cooling Towers, Inc.
12.5. Johnson Controls International plc
12.6. Babcock & Wilcox Enterprises, Inc.
12.7. Krones AG
12.8. John Cockerill (Belgium)
12.9. Kelvion Holding GmbH
12.10. ENEXIO Water Technologies GmbH
12.11. Paharpur Cooling Towers Ltd.
12.12. Thermax Limited
12.13. Seagull Cooling Tower Co., Ltd.
12.14. Ebara Corporation
12.15. Hamon Corporation
12.16. MITA Cooling Technologies Srl
12.17. Tower Tech, Inc.
12.18. Brentwood Industries, Inc.
12.19. Cooling Tower Systems, Inc.
12.20. Longhua Group
13. Appendix
13.1. Available Customization
13.2. Related Reports
LIST OF TABLES
Table 1. Global Cooling Towers Market, by Product Type, 2025–2035 (USD Million)
Table 2. Global Open Circuit Cooling Towers Market, by Country/Region, 2025–2035 (USD Million)
Table 3. Global Closed Circuit Cooling Towers Market, by Country/Region, 2025–2035 (USD Million)
Table 4. Global Hybrid Cooling Towers Market, by Country/Region, 2025–2035 (USD Million)
Table 5. Global Dry Cooling Towers Market, by Country/Region, 2025–2035 (USD Million)
Table 6. Global Evaporative Condensers Market, by Country/Region, 2025–2035 (USD Million)
Table 7. Global Cooling Towers Market, by Technology, 2025–2035 (USD Million)
Table 8. Global Natural Draft Cooling Market, by Country/Region, 2025–2035 (USD Million)
Table 9. Global Mechanical Draft Cooling Market, by Country/Region, 2025–2035 (USD Million)
Table 10. Global Hybrid Draft Cooling Market, by Country/Region, 2025–2035 (USD Million)
Table 11. Global Cooling Towers Market, by Flow Type, 2025–2035 (USD Million)
Table 12. Global Counterflow Cooling Towers Market, by Country/Region, 2025–2035 (USD Million)
Table 13. Global Crossflow Cooling Towers Market, by Country/Region, 2025–2035 (USD Million)
Table 14. Global Parallel Flow Cooling Towers Market, by Country/Region, 2025–2035 (USD Million)
Table 15. Global Cooling Towers Market, by Material, 2025–2035 (USD Million)
Table 16. Global Concrete Cooling Towers Market, by Country/Region, 2025–2035 (USD Million)
Table 17. Global Fiberglass Reinforced Plastic (FRP) Cooling Towers Market, by Country/Region, 2025–2035 (USD Million)
Table 18. Global Steel Cooling Towers Market, by Country/Region, 2025–2035 (USD Million)
Table 19. Global Timber (Wood) Cooling Towers Market, by Country/Region, 2025–2035 (USD Million)
Table 20. Global Other Cooling Towers Market, by Country/Region, 2025–2035 (USD Million)
Table 21. Global Cooling Towers Market, by Application, 2025–2035 (USD Million)
Table 22. Global Cooling Towers Market for Power Generation, by Country/Region, 2025–2035 (USD Million)
Table 23. Global Cooling Towers Market for Oil & Gas Refining, by Country/Region, 2025–2035 (USD Million)
Table 24. Global Cooling Towers Market for Petrochemical Industry, by Country/Region, 2025–2035 (USD Million)
Table 25. Global Cooling Towers Market for Chemical Processing, by Country/Region, 2025–2035 (USD Million)
Table 26. Global Cooling Towers Market for Steel & Metal Production, by Country/Region, 2025–2035 (USD Million)
Table 27. Global Cooling Towers Market for Food & Beverage Processing, by Country/Region, 2025–2035 (USD Million)
Table 28. Global Cooling Towers Market for Pharmaceutical Manufacturing, by Country/Region, 2025–2035 (USD Million)
Table 29. Global Cooling Towers Market for Data Centers, by Country/Region, 2025–2035 (USD Million)
Table 30. Global Cooling Towers Market for HVAC Systems, by Country/Region, 2025–2035 (USD Million)
Table 31. Global Cooling Towers Market for Other Applications, by Country/Region, 2025–2035 (USD Million)
Table 32. North America: Cooling Towers Market, by Product Type, 2025–2035 (USD Million)
Table 33. North America: Cooling Towers Market, by Technology, 2025–2035 (USD Million)
Table 34. North America: Cooling Towers Market, by Flow Type, 2025–2035 (USD Million)
Table 35. North America: Cooling Towers Market, by Material, 2025–2035 (USD Million)
Table 36. North America: Cooling Towers Market, by Application, 2025–2035 (USD Million)
Table 37. U.S.: Cooling Towers Market, by Product Type, 2025–2035 (USD Million)
Table 38. U.S.: Cooling Towers Market, by Technology, 2025–2035 (USD Million)
Table 39. U.S.: Cooling Towers Market, by Flow Type, 2025–2035 (USD Million)
Table 40. U.S.: Cooling Towers Market, by Material, 2025–2035 (USD Million)
Table 41. U.S.: Cooling Towers Market, by Application, 2025–2035 (USD Million)
Table 42. Canada: Cooling Towers Market, by Product Type, 2025–2035 (USD Million)
Table 43. Canada: Cooling Towers Market, by Technology, 2025–2035 (USD Million)
Table 44. Canada: Cooling Towers Market, by Flow Type, 2025–2035 (USD Million)
Table 45. Canada: Cooling Towers Market, by Material, 2025–2035 (USD Million)
Table 46. Canada: Cooling Towers Market, by Application, 2025–2035 (USD Million)
Table 47. Europe: Cooling Towers Market, by Product Type, 2025–2035 (USD Million)
Table 48. Europe: Cooling Towers Market, by Technology, 2025–2035 (USD Million)
Table 49. Europe: Cooling Towers Market, by Flow Type, 2025–2035 (USD Million)
Table 50. Europe: Cooling Towers Market, by Material, 2025–2035 (USD Million)
Table 51. Europe: Cooling Towers Market, by Application, 2025–2035 (USD Million)
Table 52. Germany: Cooling Towers Market, by Product Type, 2025–2035 (USD Million)
Table 53. Germany: Cooling Towers Market, by Technology, 2025–2035 (USD Million)
Table 54. Germany: Cooling Towers Market, by Flow Type, 2025–2035 (USD Million)
Table 55. Germany: Cooling Towers Market, by Material, 2025–2035 (USD Million)
Table 56. Germany: Cooling Towers Market, by Application, 2025–2035 (USD Million)
Table 57. France: Cooling Towers Market, by Product Type, 2025–2035 (USD Million)
Table 58. France: Cooling Towers Market, by Technology, 2025–2035 (USD Million)
Table 59. France: Cooling Towers Market, by Flow Type, 2025–2035 (USD Million)
Table 60. France: Cooling Towers Market, by Material, 2025–2035 (USD Million)
Table 61. France: Cooling Towers Market, by Application, 2025–2035 (USD Million)
Table 62. U.K.: Cooling Towers Market, by Product Type, 2025–2035 (USD Million)
Table 63. U.K.: Cooling Towers Market, by Technology, 2025–2035 (USD Million)
Table 64. U.K.: Cooling Towers Market, by Flow Type, 2025–2035 (USD Million)
Table 65. U.K.: Cooling Towers Market, by Material, 2025–2035 (USD Million)
Table 66. U.K.: Cooling Towers Market, by Application, 2025–2035 (USD Million)
Table 67. Italy: Cooling Towers Market, by Product Type, 2025–2035 (USD Million)
Table 68. Italy: Cooling Towers Market, by Technology, 2025–2035 (USD Million)
Table 69. Italy: Cooling Towers Market, by Flow Type, 2025–2035 (USD Million)
Table 70. Italy: Cooling Towers Market, by Material, 2025–2035 (USD Million)
Table 71. Italy: Cooling Towers Market, by Application, 2025–2035 (USD Million)
Table 72. Spain: Cooling Towers Market, by Product Type, 2025–2035 (USD Million)
Table 73. Spain: Cooling Towers Market, by Technology, 2025–2035 (USD Million)
Table 74. Spain: Cooling Towers Market, by Flow Type, 2025–2035 (USD Million)
Table 75. Spain: Cooling Towers Market, by Material, 2025–2035 (USD Million)
Table 76. Spain: Cooling Towers Market, by Application, 2025–2035 (USD Million)
Table 77. Netherlands: Cooling Towers Market, by Product Type, 2025–2035 (USD Million)
Table 78. Netherlands: Cooling Towers Market, by Technology, 2025–2035 (USD Million)
Table 79. Netherlands: Cooling Towers Market, by Flow Type, 2025–2035 (USD Million)
Table 80. Netherlands: Cooling Towers Market, by Material, 2025–2035 (USD Million)
Table 81. Netherlands: Cooling Towers Market, by Application, 2025–2035 (USD Million)
Table 82. Rest of Europe: Cooling Towers Market, by Product Type, 2025–2035 (USD Million)
Table 83. Rest of Europe: Cooling Towers Market, by Technology, 2025–2035 (USD Million)
Table 84. Rest of Europe: Cooling Towers Market, by Flow Type, 2025–2035 (USD Million)
Table 85. Rest of Europe: Cooling Towers Market, by Material, 2025–2035 (USD Million)
Table 86. Rest of Europe: Cooling Towers Market, by Application, 2025–2035 (USD Million)
Table 87. Asia-Pacific: Cooling Towers Market, by Product Type, 2025–2035 (USD Million)
Table 88. Asia-Pacific: Cooling Towers Market, by Technology, 2025–2035 (USD Million)
Table 89. Asia-Pacific: Cooling Towers Market, by Flow Type, 2025–2035 (USD Million)
Table 90. Asia-Pacific: Cooling Towers Market, by Material, 2025–2035 (USD Million)
Table 91. Asia-Pacific: Cooling Towers Market, by Application, 2025–2035 (USD Million)
Table 92. China: Cooling Towers Market, by Product Type, 2025–2035 (USD Million)
Table 93. China: Cooling Towers Market, by Technology, 2025–2035 (USD Million)
Table 94. China: Cooling Towers Market, by Flow Type, 2025–2035 (USD Million)
Table 95. China: Cooling Towers Market, by Material, 2025–2035 (USD Million)
Table 96. China: Cooling Towers Market, by Application, 2025–2035 (USD Million)
Table 97. Japan: Cooling Towers Market, by Product Type, 2025–2035 (USD Million)
Table 98. Japan: Cooling Towers Market, by Technology, 2025–2035 (USD Million)
Table 99. Japan: Cooling Towers Market, by Flow Type, 2025–2035 (USD Million)
Table 100. Japan: Cooling Towers Market, by Material, 2025–2035 (USD Million)
Table 101. Japan: Cooling Towers Market, by Application, 2025–2035 (USD Million)
Table 102. India: Cooling Towers Market, by Product Type, 2025–2035 (USD Million)
Table 103. India: Cooling Towers Market, by Technology, 2025–2035 (USD Million)
Table 104. India: Cooling Towers Market, by Flow Type, 2025–2035 (USD Million)
Table 105. India: Cooling Towers Market, by Material, 2025–2035 (USD Million)
Table 106. India: Cooling Towers Market, by Application, 2025–2035 (USD Million)
Table 107. South Korea: Cooling Towers Market, by Product Type, 2025–2035 (USD Million)
Table 108. South Korea: Cooling Towers Market, by Technology, 2025–2035 (USD Million)
Table 109. South Korea: Cooling Towers Market, by Flow Type, 2025–2035 (USD Million)
Table 110. South Korea: Cooling Towers Market, by Material, 2025–2035 (USD Million)
Table 111. South Korea: Cooling Towers Market, by Application, 2025–2035 (USD Million)
Table 112. Australia: Cooling Towers Market, by Product Type, 2025–2035 (USD Million)
Table 113. Australia: Cooling Towers Market, by Technology, 2025–2035 (USD Million)
Table 114. Australia: Cooling Towers Market, by Flow Type, 2025–2035 (USD Million)
Table 115. Australia: Cooling Towers Market, by Material, 2025–2035 (USD Million)
Table 116. Australia: Cooling Towers Market, by Application, 2025–2035 (USD Million)
Table 117. Rest of Asia-Pacific: Cooling Towers Market, by Product Type, 2025–2035 (USD Million)
Table 118. Rest of Asia-Pacific: Cooling Towers Market, by Technology, 2025–2035 (USD Million)
Table 119. Rest of Asia-Pacific: Cooling Towers Market, by Flow Type, 2025–2035 (USD Million)
Table 120. Rest of Asia-Pacific: Cooling Towers Market, by Material, 2025–2035 (USD Million)
Table 121. Rest of Asia-Pacific: Cooling Towers Market, by Application, 2025–2035 (USD Million)
Table 122. Latin America: Cooling Towers Market, by Product Type, 2025–2035 (USD Million)
Table 123. Latin America: Cooling Towers Market, by Technology, 2025–2035 (USD Million)
Table 124. Latin America: Cooling Towers Market, by Flow Type, 2025–2035 (USD Million)
Table 125. Latin America: Cooling Towers Market, by Material, 2025–2035 (USD Million)
Table 126. Latin America: Cooling Towers Market, by Application, 2025–2035 (USD Million)
Table 127. Brazil: Cooling Towers Market, by Product Type, 2025–2035 (USD Million)
Table 128. Brazil: Cooling Towers Market, by Technology, 2025–2035 (USD Million)
Table 129. Brazil: Cooling Towers Market, by Flow Type, 2025–2035 (USD Million)
Table 130. Brazil: Cooling Towers Market, by Material, 2025–2035 (USD Million)
Table 131. Brazil: Cooling Towers Market, by Application, 2025–2035 (USD Million)
Table 132. Mexico: Cooling Towers Market, by Product Type, 2025–2035 (USD Million)
Table 133. Mexico: Cooling Towers Market, by Technology, 2025–2035 (USD Million)
Table 134. Mexico: Cooling Towers Market, by Flow Type, 2025–2035 (USD Million)
Table 135. Mexico: Cooling Towers Market, by Material, 2025–2035 (USD Million)
Table 136. Mexico: Cooling Towers Market, by Application, 2025–2035 (USD Million)
Table 137. Rest of Latin America: Cooling Towers Market, by Product Type, 2025–2035 (USD Million)
Table 138. Rest of Latin America: Cooling Towers Market, by Technology, 2025–2035 (USD Million)
Table 139. Rest of Latin America: Cooling Towers Market, by Flow Type, 2025–2035 (USD Million)
Table 140. Rest of Latin America: Cooling Towers Market, by Material, 2025–2035 (USD Million)
Table 141. Rest of Latin America: Cooling Towers Market, by Application, 2025–2035 (USD Million)
Table 142. Middle East & Africa: Cooling Towers Market, by Product Type, 2025–2035 (USD Million)
Table 143. Middle East & Africa: Cooling Towers Market, by Technology, 2025–2035 (USD Million)
Table 144. Middle East & Africa: Cooling Towers Market, by Flow Type, 2025–2035 (USD Million)
Table 145. Middle East & Africa: Cooling Towers Market, by Material, 2025–2035 (USD Million)
Table 146. Middle East & Africa: Cooling Towers Market, by Application, 2025–2035 (USD Million)
Table 147. Saudi Arabia: Cooling Towers Market, by Product Type, 2025–2035 (USD Million)
Table 148. Saudi Arabia: Cooling Towers Market, by Technology, 2025–2035 (USD Million)
Table 149. Saudi Arabia: Cooling Towers Market, by Flow Type, 2025–2035 (USD Million)
Table 150. Saudi Arabia: Cooling Towers Market, by Material, 2025–2035 (USD Million)
Table 151. Saudi Arabia: Cooling Towers Market, by Application, 2025–2035 (USD Million)
Table 152. United Arab Emirates: Cooling Towers Market, by Product Type, 2025–2035 (USD Million)
Table 153. United Arab Emirates: Cooling Towers Market, by Technology, 2025–2035 (USD Million)
Table 154. United Arab Emirates: Cooling Towers Market, by Flow Type, 2025–2035 (USD Million)
Table 155. United Arab Emirates: Cooling Towers Market, by Material, 2025–2035 (USD Million)
Table 156. United Arab Emirates: Cooling Towers Market, by Application, 2025–2035 (USD Million)
Table 157. Rest of Middle East & Africa: Cooling Towers Market, by Product Type, 2025–2035 (USD Million)
Table 158. Rest of Middle East & Africa: Cooling Towers Market, by Technology, 2025–2035 (USD Million)
Table 159. Rest of Middle East & Africa: Cooling Towers Market, by Flow Type, 2025–2035 (USD Million)
Table 160. Rest of Middle East & Africa: Cooling Towers Market, by Material, 2025–2035 (USD Million)
Table 161. Rest of Middle East & Africa: Cooling Towers Market, by Application, 2025–2035 (USD Million)
LIST OF FIGURES
Figure 1. Research Process
Figure 2. Secondary Components Referenced for This Study
Figure 3. Primary Research Techniques
Figure 4. Key Executives Interviewed
Figure 5. Breakdown of Primary Interviews (Supply Side & Demand Side)
Figure 6. Market Sizing and Growth Forecast Approach
Figure 7. In 2025, the Open Circuit Cooling Towers segment to Account for the Largest Share
Figure 8. In 2025, the Mechanical Draft Cooling to Account for the Largest Share
Figure 9. In 2025, the Counterflow to Account for the Largest Share
Figure 10. In 2025, the Concrete to Account for the Largest Share
Figure 11. In 2025, the Power Generation to Account for the Largest Share
Figure 12. Asia-Pacific to be the Fastest-growing Regional Market
Figure 13. Impact Analysis of Market Dynamics
Figure 14. Global Cooling Towers Market: Porter's Five Forces Analysis
Figure 15. Global Cooling Towers Market, by Product Type, 2025 Vs. 2035 (USD Million)
Figure 16. Global Cooling Towers Market, by Technology, 2025 Vs. 2035 (USD Million)
Figure 17. Global Cooling Towers Market, by Flow Type, 2025 Vs. 2035 (USD Million)
Figure 18. Global Cooling Towers Market, by Material, 2025 Vs. 2035 (USD Million)
Figure 19. Global Cooling Towers Market, by Application, 2025 Vs. 2035 (USD Million)
Figure 20. Global Cooling Towers Market, by Region, 2025 Vs. 2035 (USD Million)
Figure 21. North America: Cooling Towers Market Snapshot (2025)
Figure 22. Europe: Cooling Towers Market Snapshot (2025)
Figure 23. Asia-Pacific: Cooling Towers Market Snapshot (2025)
Figure 24. Latin America: Cooling Towers Market Snapshot (2025)
Figure 25. Middle East & Africa: Cooling Towers Market Snapshot (2025)
Figure 26. Key Growth Strategies Adopted by Leading Players (2022–2025)
Figure 27. Global Cooling Towers Market Competitive Benchmarking, by Product Type
Figure 28. Competitive Dashboard: Global Cooling Towers Market
Figure 29. Global Cooling Towers Market Share/Ranking, by Key Player, 2024 (%)
Figure 30. Baltimore Aircoil Company (BAC): Financial Overview (2024)
Figure 31. SPX Cooling Technologies (SPX Corporation): Financial Overview (2024)
Figure 32. EVAPCO, Inc.: Financial Overview (2024)
Figure 33. Delta Cooling Towers, Inc.: Financial Overview (2024)
Figure 34. Johnson Controls International plc: Financial Overview (2024)
Figure 35. Babcock & Wilcox Enterprises, Inc.: Financial Overview (2024)
Figure 36. Krones AG: Financial Overview (2024)
Figure 37. John Cockerill (Belgium): Financial Overview (2024)
Figure 38. Kelvion Holding GmbH: Financial Overview (2024)
Figure 39. ENEXIO Water Technologies GmbH: Financial Overview (2024)
Figure 40. Paharpur Cooling Towers Ltd.: Financial Overview (2024)
Figure 41. Thermax Limited: Financial Overview (2024)
Figure 42. Seagull Cooling Tower Co., Ltd.: Financial Overview (2024)
Figure 43. Ebara Corporation: Financial Overview (2024)
Figure 44. Hamon Corporation: Financial Overview (2024)
Figure 45. MITA Cooling Technologies Srl: Financial Overview (2024)
Figure 46. Tower Tech, Inc.: Financial Overview (2024)
Figure 47. Brentwood Industries, Inc.: Financial Overview (2024)
Figure 48. Cooling Tower Systems, Inc.: Financial Overview (2024)
Figure 49. Longhua Group: Financial Overview (2024)


Published Date: Jan-2026
Published Date: Feb-2026
Published Date: Sep-2025
Published Date: Oct-2025
Subscribe to get the latest industry updates