Resources
About Us
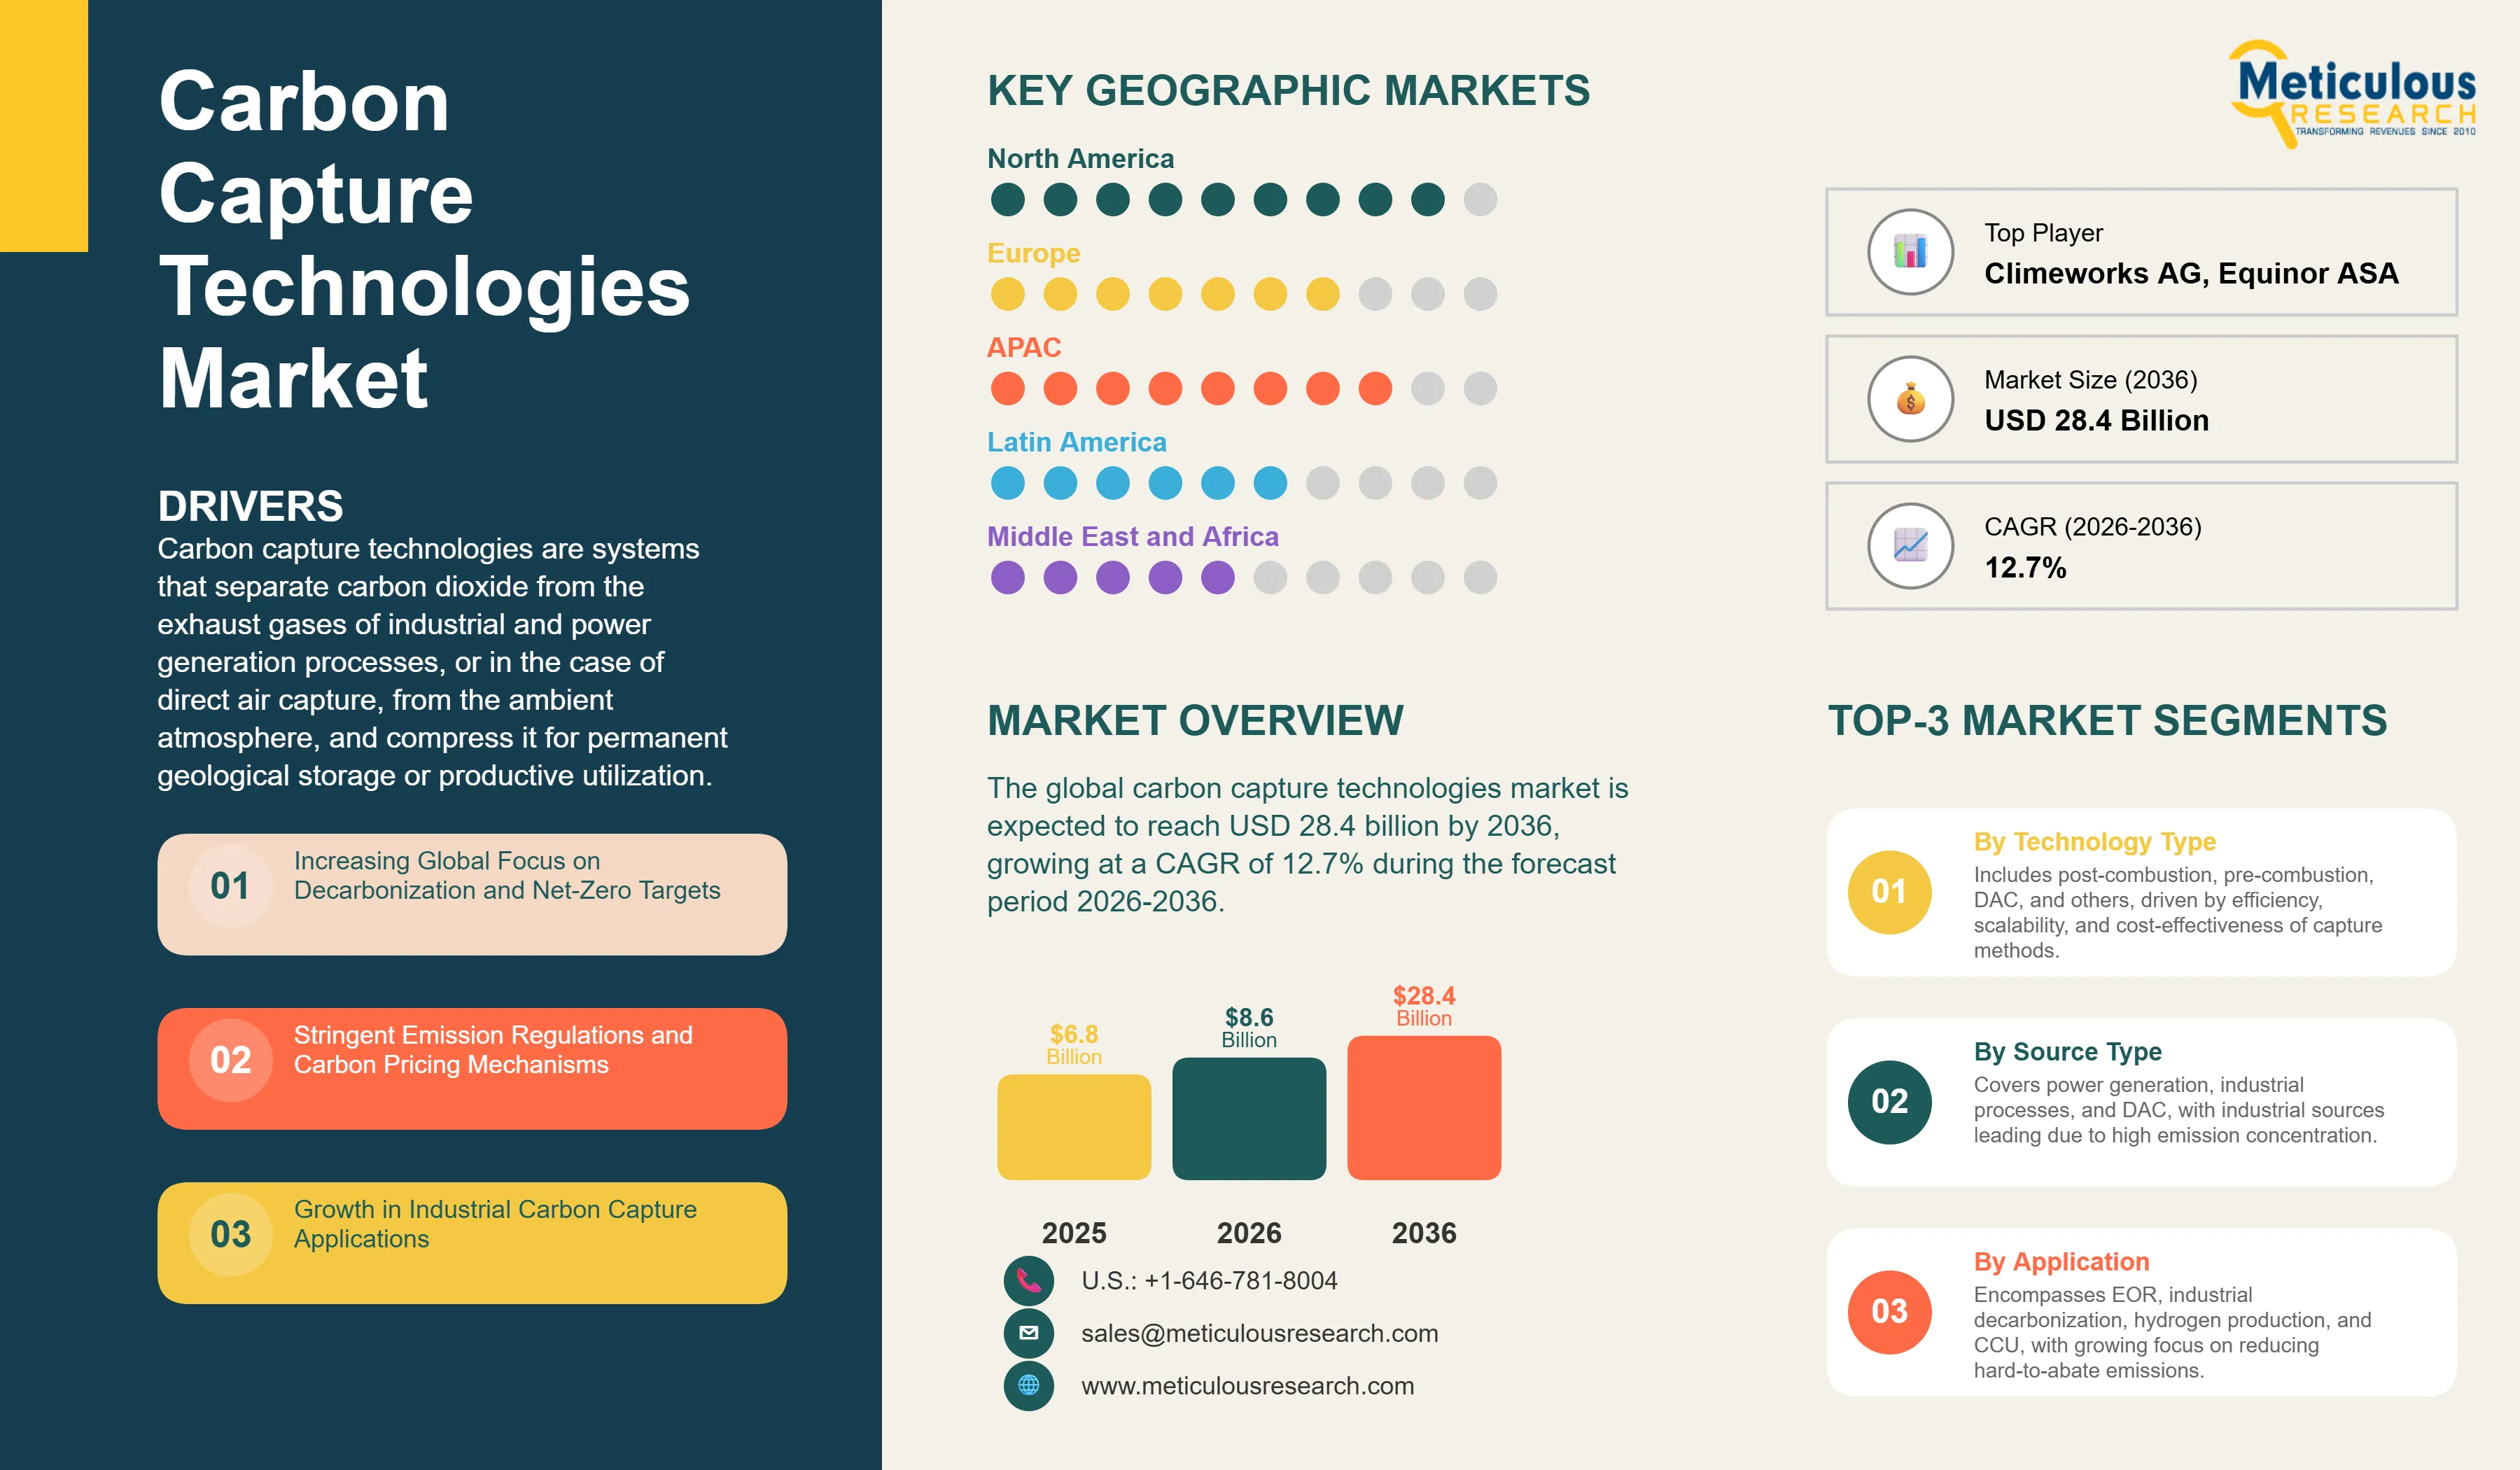
The global carbon capture technologies market was valued at USD 6.8 billion in 2025. This market is expected to reach USD 28.4 billion by 2036 from an estimated USD 8.6 billion in 2026, growing at a CAGR of 12.7% during the forecast period 2026-2036. According to the IEA's Carbon Capture, Utilisation and Storage 2024 report, global operational CCS capacity stood at approximately 50 million tonnes of CO2 per year (MtCO2/year) across all operating facilities by the end of 2024, with a pipeline of new projects under development that would more than double this capacity. The IEA states in its Net Zero by 2050 roadmap that carbon capture must scale to capture approximately 1 billion tonnes of CO2 per year by 2030 to stay on track for net-zero, meaning the current installed capacity represents less than 5% of what is needed, underscoring the enormous scale of deployment required and the commercial opportunity this represents.
 Click here to: Get Free Sample Pages of this Report
Carbon capture technologies are systems that separate carbon dioxide from the exhaust gases of industrial and power generation processes, or in the case of direct air capture, from the ambient atmosphere, and compress it for permanent geological storage or productive utilization. Post-combustion capture, the most commercially mature approach, passes flue gas through a liquid amine solvent that chemically absorbs CO2, which is then released by heating the solvent and compressed for transport. Pre-combustion capture converts fuel into a hydrogen-CO2 mixture before combustion and separates the CO2 before the remaining hydrogen is burned. Direct air capture pulls CO2 directly from the open atmosphere using large fans and chemical contactors, producing negative emissions when combined with permanent storage.
The market is growing because global energy-related CO2 emissions reached a record 37.8 billion tonnes in 2024 according to the IEA's CO2 Emissions from Energy Combustion and Industrial Processes 2025 report, and the scientific consensus documented in the IPCC's Sixth Assessment Report confirms that all credible pathways to limiting warming to 1.5 or 2 degrees Celsius require carbon capture and removal at significant scale. The U.S. Inflation Reduction Act, signed in 2022 but producing commercial deployment effects from 2024 onward, increased the Section 45Q tax credit for captured and permanently stored CO2 to USD 85 per tonne for industrial point source capture and USD 180 per tonne for direct air capture, levels that make a large number of projects financially viable that were previously uneconomical. The number of CCS projects in the global development pipeline reached 628 projects across all development stages in 2024 according to the Global CCS Institute's 2024 Status of CCS Report, up from 392 in 2022, demonstrating the accelerating commercial momentum.
Two opportunities are defining the near-term growth phase. Blue hydrogen production by steam methane reforming with CCS is the lowest-cost route to large-scale low-carbon hydrogen supply in most markets and is driving CCS investments at natural gas processing and hydrogen production facilities globally. The IEA's Global Hydrogen Review 2024 notes that over 40 large-scale low-carbon hydrogen projects with integrated CCS are in active development globally. The second opportunity is the Norwegian Northern Lights project, which became the world's first open-access CO2 transport and storage infrastructure in 2024, injecting CO2 captured from European industrial sources into subsea geological formations under the North Sea. This shared infrastructure model, where multiple industrial emitters can pipe CO2 to a common transport and storage hub, significantly reduces the per-project CCS investment cost and is the commercial model that most major European CCS cluster programs are following.
|
Parameters |
Details |
|
Market Size by 2036 |
USD 28.4 Billion |
|
Market Size in 2026 |
USD 8.6 Billion |
|
Market Size in 2025 |
USD 6.8 Billion |
|
Revenue Growth Rate (2026-2036) |
CAGR of 12.7% |
|
Dominating Technology Type |
Post-Combustion Capture (Amine-Based) |
|
Fastest Growing Technology Type |
Direct Air Capture (DAC) |
|
Dominating Source Type |
Industrial Processes |
|
Fastest Growing Source Type |
Direct Air Capture |
|
Dominating Application |
Industrial Decarbonization |
|
Fastest Growing Application |
Blue Hydrogen Production |
|
Dominating End-Use Industry |
Oil & Gas |
|
Fastest Growing End-Use Industry |
Cement |
|
Dominating Deployment Type |
Onshore Projects |
|
Fastest Growing Deployment Type |
Offshore Projects |
|
Dominating Capture Capacity |
Small-Scale (<1 MtCO2/year) |
|
Fastest Growing Capture Capacity |
Large-Scale (>5 MtCO2/year) |
|
Dominating Geography |
North America |
|
Fastest Growing Geography |
Asia-Pacific |
|
Base Year |
2025 |
|
Forecast Period |
2026 to 2036 |
U.S. 45Q Tax Credit Catalyzing a Wave of Commercial Project Development
The revised Section 45Q tax credit for carbon sequestration under the U.S. Inflation Reduction Act is the most commercially significant single policy measure in the global carbon capture market, having materially changed the project economics for point-source industrial CCS and direct air capture across the United States. At USD 85 per tonne of CO2 permanently stored from industrial facilities and USD 180 per tonne from direct air capture, the 45Q credit provides a revenue floor that makes a very large number of projects financially viable without depending on a high carbon price in an emission trading system. The credit is available for 12 years from first injection and is transferable, meaning project developers can monetize it through direct pay or transfer to tax-equity investors even if they have no U.S. tax liability.
According to the Global CCS Institute's 2024 Status of CCS Report, the number of U.S.-based CCS projects in active development more than doubled between 2022 and 2024, with the Midwest geological storage basins in Illinois, Indiana, and the Gulf Coast experiencing particular project development activity. According to ExxonMobil’s 2024 Baytown disclosures, the company planned a large-scale CCS-enabled low-carbon hydrogen project in Baytown, Texas, with carbon capture infrastructure capable of storing up to 10 million metric tons of CO2 per year as part of a broader Houston CCS hub. According to the U.S. Department of Energy, the Regional Direct Air Capture Hubs program was launched with $3.5 billion in funding to develop four domestic DAC hubs with initial project selections beginning in 2023, providing the large-scale government co-investment that commercial DAC developers need to demonstrate their technology at the scale required for cost reduction. These programs collectively represent the most concentrated government-backed investment in carbon capture in any country globally and are generating a substantial near-term project pipeline.
Northern Lights Proving the Commercial Viability of Shared CO2 Infrastructure
The Northern Lights project, operated by a joint venture of Equinor, Shell, and TotalEnergies in Norway, achieved a major commercial milestone in 2024 when it received and injected the first CO2 from an industrial source, marking the world's first commercial cross-border CO2 transport and storage operation. The project's infrastructure includes a receiving terminal at Oygarden on the Norwegian west coast and an offshore pipeline to an injection well in the Johansen geological formation under the North Sea, with initial capacity of 1.5 MtCO2 per year and plans to expand. Yara's Porsgrunn fertilizer plant in Norway and Heidelberg Materials' Brevik cement plant, which became the world's first cement plant to operate carbon capture at full industrial scale in 2024, are among the first customers committed to shipping CO2 to Northern Lights.
The commercial and technical significance of Northern Lights is that it demonstrates the cluster CCS model, where multiple industrial emitters in different locations share transport and storage infrastructure, can work at commercial scale. The per-tonne cost of storage for industrial emitters is substantially lower when shared infrastructure serves multiple projects than when each project must develop dedicated storage, making the economics of CCS at industrial emitters viable at lower carbon prices. The UK's East Coast Cluster and HyNet North West projects, the Netherlands' Porthos project injecting CO2 from Rotterdam industry into a depleted offshore gas field, and several other European CCS cluster programs are all following the Northern Lights model and reaching key development milestones in 2024 and 2025.
Direct Air Capture Reaching Early Commercial Scale with Strong Policy Support
Direct air capture moved from demonstration scale to the first small commercial operations in 2024, with Climeworks' Mammoth plant in Iceland, which opened in May 2024, becoming the world's largest operational DAC facility at the time of its launch with a nominal capacity of 36,000 tonnes of CO2 per year. Climeworks uses solid sorbent DAC technology where large modular units draw air through CO2-binding materials, heat them to release concentrated CO2, and inject it into basalt rock where it mineralizes permanently. The Mammoth plant represents a roughly ten-fold scale increase from Climeworks' previous Orca facility and provides the operating data that is essential for further cost reduction and scale-up.
According to Climeworks' published communications, the levelized cost of DAC at Mammoth remains in the hundreds of dollars per tonne range, well above the 45Q credit level and current voluntary carbon market prices, confirming that significant further cost reduction is needed for DAC to achieve broad commercial deployment. However, the trajectory of cost reduction in DAC follows patterns similar to other energy technologies where learning rates and scale economies drive rapid cost reduction with deployment scale, and the large-scale government investment from the U.S. DOE's DAC hub program and similar initiatives in Canada and the UK is providing the market-making support that allows this learning curve to advance. 1PointFive, the Occidental Petroleum subsidiary, is developing what it describes as the world's largest DAC plant, Stratos, in Texas, which reached mechanical completion in 2024 and targets 500,000 tonnes per year of CO2 removal at full scale.
Increasing Global Focus on Decarbonization and Net-Zero Targets
Global energy-related CO2 emissions reached a record 37.8 billion tonnes in 2024 according to the IEA's CO2 Emissions from Energy Combustion and Industrial Processes 2025 report, and industrial process emissions add further CO2 that is not attributable to energy combustion but to chemical reactions in cement, steel, and chemical manufacturing. The IPCC's Sixth Assessment Report, the most comprehensive scientific assessment of climate change, concludes that virtually all pathways compatible with limiting warming to 1.5 degrees Celsius involve significant deployment of carbon capture and carbon dioxide removal technologies. The IEA's Net Zero by 2050 Roadmap states that approximately 1 billion tonnes of CO2 per year must be captured by 2030 across all CCS and DAC applications to remain on track. Against the approximately 50 MtCO2/year of current operational capacity documented in the IEA's CCUS 2024 report, this represents a more than thirty-fold scale-up requirement in less than a decade, establishing the scale of the commercial opportunity with clarity.
Government Incentives and Funding for CCS/CCUS Projects
Government financial support for carbon capture has expanded substantially in the major emitting economies since 2022. The U.S. Inflation Reduction Act's Section 45Q credit at USD 85 per tonne for geological storage and USD 180 per tonne for DAC storage, combined with the U.S. Department of Energy's USD 3.5 billion DAC hub program announced in 2023, represent the most generous set of carbon capture incentives in any country globally. The UK government's industrial Carbon Capture business model, announced in 2024 as part of its Track-1 CCS cluster program, provides revenue support contracts for the East Coast Cluster and HyNet projects covering the commercial risk of CO2 transport and storage operations. The European Innovation Fund, which has funded multiple CCS and DAC demonstration projects with grants from EU emissions trading revenues, provides project-level support across member states. Canada's investment tax credit for carbon capture, announced in Budget 2022 and expanded in subsequent budgets, covers up to 50% of eligible CCS capital costs for direct air capture and 37.5% for most other applications.
Growth in Direct Air Capture (DAC)
Direct air capture represents the most commercially scalable pathway to carbon dioxide removal that can deliver permanent, verifiable, and durable negative emissions independently of bioenergy or land use. The opening of Climeworks' Mammoth facility in Iceland in May 2024 at 36,000 tonnes per year, the mechanical completion of 1PointFive's Stratos facility in Texas in 2024 targeting 500,000 tonnes per year at full scale, and the U.S. DOE's USD 3.5 billion commitment to four regional DAC hub demonstrations collectively represent the most significant commercial and policy progress in DAC's history. The corporate voluntary carbon market, where technology companies including Microsoft, Stripe, Shopify, and Alphabet have made multi-year purchase commitments for DAC carbon removal credits through the Frontier advance market commitment initiative, provides private demand signals that supplement government support and are essential for DAC project financing. According to the IEA's CCUS 2024 report, the global DAC project pipeline includes facilities with a combined potential capacity of several million tonnes per year in various stages of development, reflecting the strong commercial interest in scaling this technology.
Integration with Hydrogen Production and Industrial Decarbonization
The integration of carbon capture with steam methane reforming hydrogen production to produce blue hydrogen is one of the most commercially near-term and large-scale CCS application opportunities, as it creates a simultaneous revenue stream from hydrogen sales and decarbonizes an existing large-scale industrial process. According to the IEA’s Global Hydrogen Review 2024, low-emissions hydrogen projects continue to advance, with FID capacity doubling to 3.4 Mtpa in 2024 and a much larger announced pipeline that could reach 49 Mtpa by 2030, including a significant share of projects based on fossil fuels with carbon mitigation such as CCS. The UK's HyNet North West project, targeting blue hydrogen production in the northwest England industrial corridor with CO2 storage in the East Irish Sea, and the Acorn Project in Scotland, are among the most advanced European blue hydrogen plus CCS programs. The cement industry represents another high-priority industrial CCS application: global cement production accounts for approximately 7 to 8% of global CO2 emissions according to the Global Cement and Concrete Association's 2024 data, and the chemical decomposition of limestone that is inherent to cement chemistry means that no amount of fuel switching or renewable energy alone can eliminate cement's CO2 emissions without CCS.
By Technology Type: In 2026, Post-Combustion Capture to Dominate
Based on technology type, the global carbon capture technologies market is segmented into post-combustion capture (amine-based absorption, solvent-based systems, and solid sorbents), pre-combustion capture, oxy-fuel combustion, direct air capture (liquid solvent-based and solid sorbent-based), membrane-based capture, and cryogenic separation. In 2026, the post-combustion capture segment is expected to account for the largest share of the global carbon capture technologies market. Amine-based post-combustion capture is the most commercially proven and most widely deployed carbon capture technology, with decades of operational experience in natural gas processing, ammonia production, and the most advanced large-scale power station CCS projects. According to the Global CCS Institute's 2024 Status of CCS Report, the majority of the approximately 50 MtCO2/year of current global operational CCS capacity uses amine or solvent-based post-combustion or natural gas processing capture technology, establishing this as the dominant category by installed capacity.
However, the direct air capture segment is projected to register the highest CAGR during the forecast period, driven by the combination of very large government funding support, the growing corporate voluntary carbon market for permanent removal credits, and the irreplaceable role of DAC as the only scalable technology capable of directly removing previously emitted CO2 from the atmosphere when combined with permanent geological storage.
By Application: In 2026, Industrial Decarbonization to Hold the Largest Share
Based on application, the global carbon capture technologies market is segmented into enhanced oil recovery, industrial decarbonization (cement, steel, and chemicals), blue hydrogen production, carbon utilization, power generation, and other applications. In 2026, the industrial decarbonization segment is expected to account for the largest share of the global carbon capture technologies market. Cement, steel, and chemical manufacturing collectively account for a large fraction of global industrial CO2 emissions and are recognized as hard-to-abate sectors where CCS is one of the only viable pathways to deep decarbonization. The cement industry's particular urgency is confirmed by the fact that Heidelberg Materials' Brevik plant in Norway became the world's first full-scale cement CCS facility in 2024, and the industry's multiple global CCS project announcements in 2024 and 2025 reflect growing commercial investment in this application.
However, the blue hydrogen production segment is projected to register the highest CAGR during the forecast period, driven by the growing global hydrogen economy requiring large-scale low-carbon hydrogen supply and by the very competitive cost position of blue hydrogen relative to green hydrogen at current electrolyzer costs and electricity prices. The IEA's Global Hydrogen Review 2024 identifies blue hydrogen as the primary near-term supply pathway for low-carbon hydrogen at the scale required for industrial decarbonization applications.
Carbon Capture Technologies Market by Region: North America Leading by Share, Asia-Pacific by Growth
Based on geography, the global carbon capture technologies market is segmented into North America, Europe, Asia-Pacific, Latin America, and the Middle East and Africa.
In 2026, North America is expected to account for the largest share of the global market for carbon capture technologies. The United States has the world's most favorable policy environment for commercial CCS deployment following the Inflation Reduction Act, with the 45Q tax credit at USD 85 per tonne for geological storage and USD 180 per tonne for DAC creating a revenue certainty that project developers in no other country currently enjoy at equivalent levels. According to the Global CCS Institute's 2024 Status of CCS Report, the United States hosts the largest number of CCS projects in active development of any country globally, with particularly strong activity in the Gulf Coast, Midwest, and Great Plains regions where existing industrial infrastructure and favorable geology combine with IRA financial incentives. The U.S. DOE's Regional DAC Hub program, which allocated USD 3.5 billion to hub projects in Texas, Louisiana, and other states in 2023, is specifically designed to prove DAC at commercial scale. Canada complements the North American market through its investment tax credits for CCS and several large-scale CCS projects in Alberta's oil sands and industrial sectors.
However, the Asia-Pacific carbon capture technologies market is expected to grow at the fastest CAGR during the forecast period. Japan has made CCS a central element of its Green Transformation (GX) strategy, committing USD 150 billion over ten years to clean energy technologies with CCS specifically identified as a priority, and the Japanese government has published a CCS roadmap targeting 12 MtCO2/year of domestic and international CCS capacity by 2030. South Korea's Carbon Neutral 2050 strategy includes CCS at industrial facilities, and the government has been supporting CCS pilot projects at cement and steel plants. China's national carbon neutrality by 2060 commitment and its very large coal power and industrial base create enormous long-term CCS potential, and according to the IEA's CCUS 2024 report, China's CCS project activity increased significantly in 2023 and 2024 with several new industrial CCS projects announced. Australia's CCS program is anchored by the Gorgon LNG CCS project and a government commitment to developing CO2 storage hubs for industrial exports of CO2 from Japan and other Asian countries.
The carbon capture technologies market is served by large integrated energy and industrial companies that are both major CO2 emitters investing in CCS for their own operations and technology developers and service providers to the broader market, alongside specialist CCS technology companies developing proprietary capture processes, engineering and construction firms executing CCS project design and construction, and emerging companies developing direct air capture and next-generation capture materials. Competition is based on capture process efficiency and cost per tonne of CO2, technology reliability and track record, ability to execute large-scale EPC contracts, and regulatory relationships and project development expertise.
The report provides a comprehensive competitive analysis based on a thorough review of leading players' technology portfolios, project track records, geographic presence, and recent strategic developments. Some of the key players operating in the global carbon capture technologies market include Shell plc (UK/Netherlands), ExxonMobil Corporation (U.S.), Aker Carbon Capture ASA (Norway), Mitsubishi Heavy Industries Ltd. (Japan), Carbon Clean Solutions Limited (UK), Climeworks AG (Switzerland), Linde plc (UK/Ireland), Air Liquide (France), Fluor Corporation (U.S.), Honeywell International Inc. (U.S.), Siemens Energy AG (Germany), Baker Hughes Company (U.S.), Equinor ASA (Norway), Schlumberger Limited (U.S.), and Svante Inc. (Canada), among others.
The global carbon capture technologies market is expected to reach USD 28.4 billion by 2036 from an estimated USD 8.6 billion in 2026, at a CAGR of 12.7% during the forecast period 2026-2036.
In 2026, the post-combustion capture segment is expected to hold the largest share of the global carbon capture technologies market, reflecting amine-based absorption being the most commercially proven and most widely deployed technology across the existing global CCS installed base.
The direct air capture segment is projected to register the highest CAGR during the forecast period, driven by very large government funding commitments in the U.S., Canada, and the UK, growing corporate demand for permanent carbon removal credits, and the unique capability of DAC to deliver permanent negative emissions independently of land use or bioenergy.
In 2026, the industrial decarbonization segment is expected to hold the largest share of the global carbon capture technologies market, driven by cement, steel, and chemicals being hard-to-abate sectors where CCS is one of the only viable pathways to deep emission reductions and where commercial project activity is most concentrated.
The IRA's revised Section 45Q tax credit, at USD 85 per tonne for industrial geological storage and USD 180 per tonne for direct air capture, has materially improved project economics across the U.S. carbon capture market, more than doubling the number of CCS projects in active development in the country between 2022 and 2024 according to the Global CCS Institute's 2024 Status of CCS Report.
The market is primarily driven by the very large gap between current global CCS capacity of approximately 50 MtCO2/year and the approximately 1 billion tonnes per year required by 2030 per the IEA's Net Zero by 2050 roadmap, combined with the transformative financial incentives of the U.S. 45Q tax credit and the commercial validation provided by first-of-kind projects such as Northern Lights and Heidelberg Materials' Brevik cement CCS facility.
Key players are Shell plc (UK/Netherlands), ExxonMobil Corporation (U.S.), Aker Carbon Capture ASA (Norway), Mitsubishi Heavy Industries Ltd. (Japan), Carbon Clean Solutions Limited (UK), Climeworks AG (Switzerland), Linde plc (UK/Ireland), Air Liquide (France), Fluor Corporation (U.S.), Honeywell International Inc. (U.S.), Siemens Energy AG (Germany), Baker Hughes Company (U.S.), Equinor ASA (Norway), Schlumberger Limited (U.S.), and Svante Inc. (Canada), among others.
Asia-Pacific is expected to register the highest growth rate in the global carbon capture technologies market during the forecast period 2026-2036, driven by Japan's GX strategy committing USD 150 billion to clean energy with CCS as a priority, South Korea's Carbon Neutral 2050 industrial CCS programs, and China's carbon neutrality by 2060 commitment creating very large long-term CCS demand from its enormous industrial base.
1. Introduction
1.1 Market Definition
1.2 Market Ecosystem
1.3 Currency and Limitations
1.3.1 Currency
1.3.2 Limitations
1.4 Key Stakeholders
2. Research Methodology
2.1 Research Approach
2.2 Data Collection & Validation Process
2.2.1 Secondary Research
2.2.2 Primary Research & Validation
2.2.2.1 Primary Interviews with Experts
2.2.2.2 Approaches for Country-/Region-Level Analysis
2.3 Market Estimation
2.3.1 Bottom-Up Approach
2.3.2 Top-Down Approach
2.3.3 Growth Forecast
2.4 Data Triangulation
2.5 Assumptions for the Study
3. Executive Summary
4. Market Overview
4.1 Introduction
4.2 Market Dynamics
4.2.1 Drivers
4.2.1.1 Increasing Global Focus on Decarbonization and Net-Zero Targets
4.2.1.2 Stringent Emission Regulations and Carbon Pricing Mechanisms
4.2.1.3 Growth in Industrial Carbon Capture Applications
4.2.1.4 Government Incentives and Funding for CCS/CCUS Projects
4.2.2 Restraints
4.2.2.1 High Capital and Operational Costs
4.2.2.2 Limited Infrastructure for CO2 Transport and Storage
4.2.2.3 Energy Intensity of Capture Processes
4.2.3 Opportunities
4.2.3.1 Development of Advanced Capture Materials (MOFs, Solid Sorbents)
4.2.3.2 Integration with Hydrogen Production and Industrial Decarbonization
4.2.3.3 Growth in Direct Air Capture (DAC)
4.2.3.4 Carbon Utilization in Fuels and Chemicals
4.2.4 Challenges
4.2.4.1 Scaling Commercial Deployment
4.2.4.2 Public Acceptance and Regulatory Approvals
4.3 Technology Landscape
4.3.1 Post-Combustion Capture Technologies
4.3.2 Pre-Combustion Capture Technologies
4.3.3 Oxy-Fuel Combustion
4.3.4 Direct Air Capture (DAC)
4.3.5 Emerging Technologies (Cryogenic, Membrane-Based)
4.4 Carbon Capture Value Chain
4.4.1 CO2 Capture
4.4.2 CO2 Compression and Transportation
4.4.3 CO2 Storage (Geological Sequestration)
4.4.4 CO2 Utilization (CCUS Applications)
4.5 Value Chain Analysis
4.5.1 Technology Providers
4.5.2 EPC and Engineering Firms
4.5.3 Industrial Emitters
4.5.4 Transport and Storage Operators
4.5.5 End Users (Utilization Markets)
4.6 Regulatory and Policy Landscape
4.6.1 Carbon Pricing and Emission Trading Systems
4.6.2 Government Incentives (45Q, EU ETS)
4.6.3 Environmental and Storage Regulations
4.7 Porter's Five Forces Analysis
4.8 Investment and Industry Trends
4.8.1 Growth in CCS/CCUS Project Pipeline
4.8.2 Public-Private Partnerships
4.8.3 Investments in DAC and Negative Emission Technologies
4.9 Cost and Pricing Analysis
4.9.1 Cost per Ton of CO2 Captured
4.9.2 Capex and Opex Analysis
4.9.3 Cost Comparison Across Technologies
5. Carbon Capture Technologies Market, by Technology Type
5.1 Introduction
5.2 Post-Combustion Capture
5.2.1 Amine-Based Absorption
5.2.2 Solvent-Based Systems
5.2.3 Solid Sorbents
5.3 Pre-Combustion Capture
5.4 Oxy-Fuel Combustion
5.5 Direct Air Capture (DAC)
5.5.1 Liquid Solvent-Based DAC
5.5.2 Solid Sorbent-Based DAC
5.6 Membrane-Based Capture
5.7 Cryogenic Separation
6. Carbon Capture Technologies Market, by Source Type
6.1 Introduction
6.2 Power Generation
6.3 Industrial Processes
6.4 Natural Gas Processing
6.5 Direct Air Capture
7. Carbon Capture Technologies Market, by Application
7.1 Introduction
7.2 Enhanced Oil Recovery (EOR)
7.3 Industrial Decarbonization
7.3.1 Cement Industry
7.3.2 Steel Industry
7.3.3 Chemicals and Petrochemicals
7.4 Hydrogen Production (Blue Hydrogen)
7.5 Carbon Utilization (CCU)
7.5.1 Synthetic Fuels (e-Fuels)
7.5.2 Chemicals and Polymers
7.6 Power Generation
7.7 Other Applications
8. Carbon Capture Technologies Market, by End-Use Industry
8.1 Introduction
8.2 Oil & Gas
8.3 Power Generation
8.4 Cement
8.5 Steel
8.6 Chemicals
8.7 Others
9. Carbon Capture Technologies Market, by Deployment Type
9.1 Introduction
9.2 Onshore Projects
9.3 Offshore Projects
10. Carbon Capture Technologies Market, by Capture Capacity
10.1 Introduction
10.2 Small-Scale (<1 MtCO2/year)
10.3 Medium-Scale (1–5 MtCO2/year)
10.4 Large-Scale (>5 MtCO2/year)
11. Carbon Capture Technologies Market, by Geography
11.1 Introduction
11.2 North America
11.2.1 U.S.
11.2.2 Canada
11.3 Europe
11.3.1 Norway
11.3.2 U.K.
11.3.3 Germany
11.3.4 Netherlands
11.3.5 France
11.3.6 Sweden
11.3.7 Rest of Europe
11.4 Asia-Pacific
11.4.1 China
11.4.2 Japan
11.4.3 South Korea
11.4.4 India
11.4.5 Australia
11.4.6 Rest of Asia-Pacific
11.5 Latin America
11.5.1 Brazil
11.5.2 Mexico
11.5.3 Argentina
11.5.4 Chile
11.5.5 Colombia
11.5.6 Rest of Latin America
11.6 Middle East & Africa
11.6.1 Saudi Arabia
11.6.2 UAE
11.6.3 South Africa
11.6.4 Qatar
11.6.5 Rest of Middle East & Africa
12. Competitive Landscape
12.1 Overview
12.2 Key Growth Strategies
12.3 Competitive Benchmarking
12.4 Competitive Dashboard
12.4.1 Industry Leaders
12.4.2 Market Differentiators
12.4.3 Vanguards
12.4.4 Emerging Companies
12.5 Market Ranking/Positioning Analysis of Key Players, 2025
13. Company Profiles
(Business Overview, Financial Overview, Technology Portfolio, Strategic Developments, SWOT Analysis)
13.1 Shell plc
13.2 ExxonMobil Corporation
13.3 Aker Carbon Capture ASA
13.4 Mitsubishi Heavy Industries, Ltd.
13.5 Carbon Clean Solutions Limited
13.6 Climeworks AG
13.7 Linde plc
13.8 Air Liquide
13.9 Fluor Corporation
13.10 Honeywell International Inc.
13.11 Siemens Energy AG
13.12 Baker Hughes Company
13.13 Equinor ASA
13.14 Schlumberger Limited
13.15 Svante Inc.
14. Appendix
14.1 Additional Customization
14.2 Related Reports


Published Date: Feb-2026
Subscribe to get the latest industry updates