Resources
About Us
Report Overview
This comprehensive market research report analyzes the rapidly expanding AI-driven battery management systems market, evaluating how artificial intelligence and machine learning technologies are transforming traditional battery management to optimize performance, extend lifecycles, and enhance safety across various applications. The report provides a strategic analysis of market dynamics, growth projections till 2032, and competitive positioning across global and regional/country-level markets.
Market Dynamics Overview
Key Market Drivers & Trends
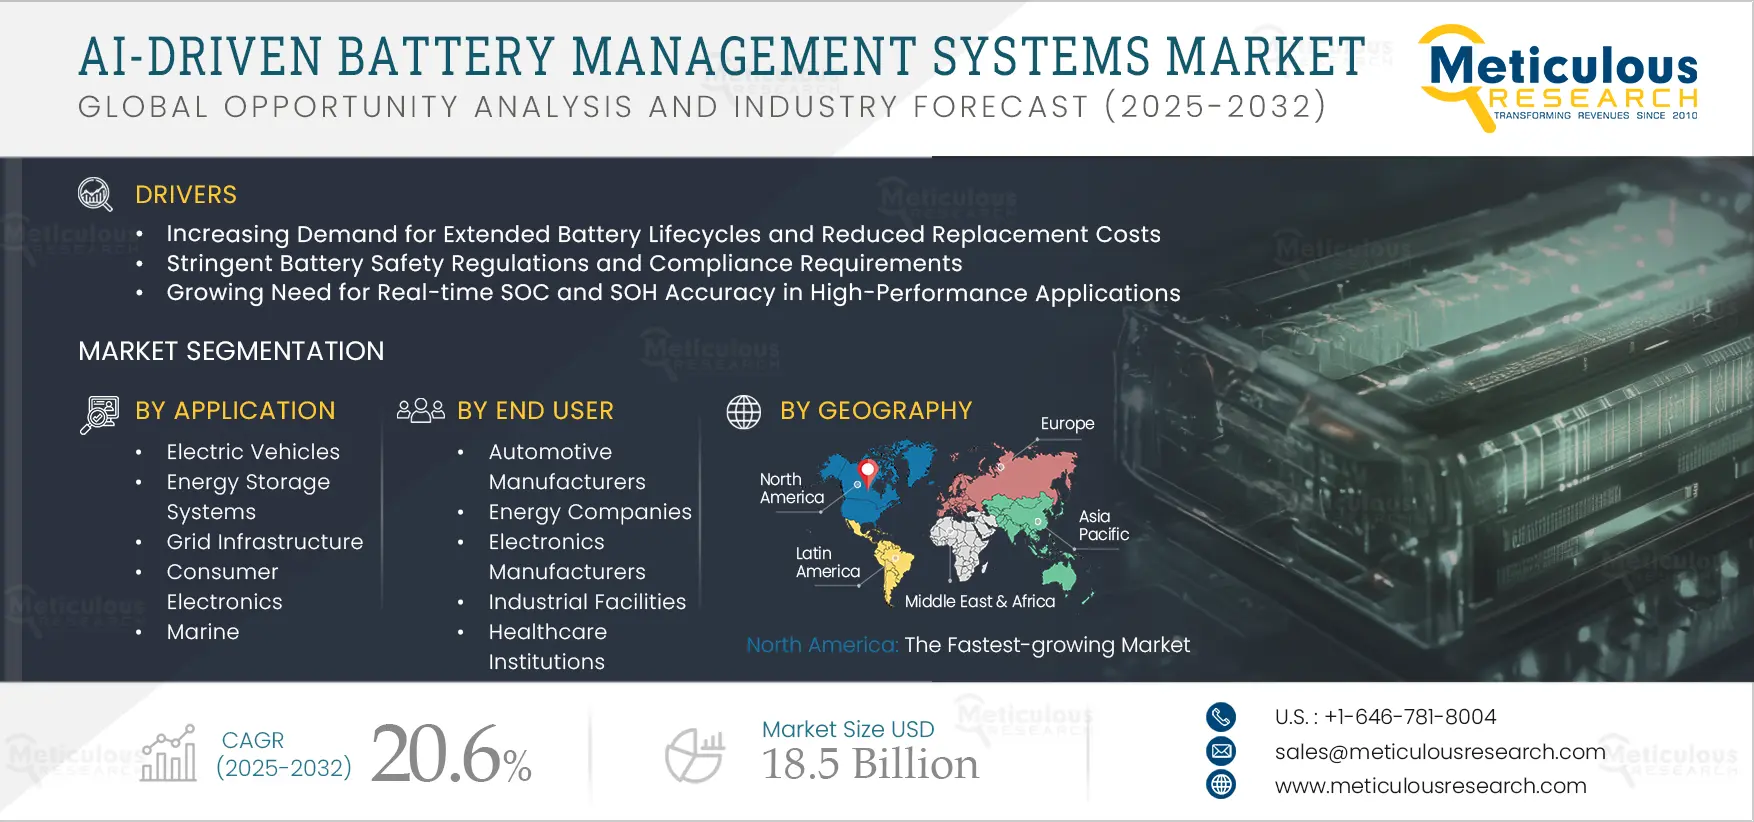
The AI-driven battery management systems (BMS) market is primarily driven by increasing demand for longer battery lifecycles, stringent safety regulations, the need for precise state-of-charge (SOC) and state-of-health (SOH) estimations, and the growing adoption of fast charging technologies that require advanced thermal management solutions. The shift from hardware-centric to software-defined BMS solutions is reshaping the industry, while the integration of digital twin technology for predictive battery modeling is gaining significant attention. Additionally, the adoption of wireless BMS architectures for weight reduction and the rise of performance-based licensing models are further accelerating the market growth, especially in electric vehicle (EV) and renewable energy applications.
Key Challenges
Despite growth prospects, the overall AI-driven battery management systems market faces challenges including high initial investment required for R&D and algorithm development, difficulties in collecting and standardizing battery data, and the ongoing challenge of balancing edge computing with cloud-based processing. Additionally, retrofitting AI capabilities into existing battery systems presents technical complexities, and verifying the performance and reliability of AI algorithms remains a significant barrier, potentially slowing down market penetration.
 Click here to: Get a Free Sample Copy of this report
Growth Opportunities
The AI driven battery management systems market offers several high-growth opportunities. The rise of second-life battery applications, driven by circular economic initiatives that are opening new avenues for repurposed battery usage. Another major opportunity lies in vehicle-to-grid (V2G) integration, which demands advanced BMS intelligence and holds strong potential for utility-scale deployments. Additionally, the growing adoption of Battery-as-a-Service (BaaS) models is helping reduce upfront capital expenditure while ensuring efficient, long-term battery performance. The development of multi-chemistry BMS solutions to support a wide range of applications, along with tailored offerings for emerging markets, further expands the growth landscape for both manufacturers and software developers.
Market Segmentation Highlights
By Component
The software and AI solutions segment is expected to dominate the overall AI-driven battery management systems market in 2025, primarily due to the growing adoption of predictive analytics and state estimation algorithms. These software components are essential for optimizing battery performance and ensuring safety, with key modules including state-of-charge (SOC), state-of-health (SOH), and remaining useful life (RUL) estimations, along with thermal management systems and cell balancing algorithms. These tools enhance decision-making, enable predictive maintenance, and support the overall efficiency of battery systems, especially critical in EV and energy storage applications. However, the Hardware segment is expected to witness a faster growth rate through 2032, driven by increasing demand for real-time, on-device processing. AI-optimized BMS processors are becoming vital for enabling edge computing, which minimizes latency and enhances system responsiveness. This shift is especially important for applications that require immediate data handling, such as electric vehicles and grid-scale storage. Additionally, the integration of advanced sensors and monitoring systems, used for precise data collection and real-time battery diagnostics is further fueling hardware demand.
Based on services, the implementation & integration services segment is expected to hold the largest share of the overall AI driven battery management systems market in 2025, due to the challenges involved in seamlessly incorporating AI technologies into existing battery infrastructures. These services are critical for ensuring compatibility, system reliability, and optimal performance during deployment. AI Model Training & Customization also represents significant market growth, driven by the growing need to tailor algorithms for specific applications, chemistry, and usage conditions. However, Data Analytics Services are expected to experience the highest growth rate through 2032, primarily driven by the increasing importance of leveraging battery performance data to gain actionable insights, enhance operational decision-making, and support predictive maintenance strategies. As organizations seek to transform raw battery data into strategic intelligence, demand for advanced analytics capabilities is set to surge the market growth.
By Application
The electric vehicles segment is expected to hold the largest share of the AI-driven battery management systems market in 2025, primarily driven by the need for better range, fast charging, and enhanced battery safety in the automotive sector. Energy Storage Systems are also growing significantly, especially in large-scale utility projects due to their role in stabilizing the grid, supporting renewable energy, managing peak demand, and improving energy resilience. However, the Data Centers segment is expected to grow at fastest rate during the forecast period, due to the critical need for uninterrupted power and precise battery monitoring in backup systems as AI enhanced BMS ensures real time battery health insights, predictive maintenance, and optimized energy usage, reducing downtime risks and operating costs.
By Distribution Channel
The direct channel leads the market now because AI-driven BMS solutions, primarily driven by the need for high customization and deep technical integration, especially in complex applications like electric vehicles, aerospace, and utility-scale storage. However, the indirect channel is experiencing the fastest growth during the forecast period due to the increasing standardization and maturity of AI driven battery management systems technologies. As solutions become more modular and easier to integrate, system integrators and solution providers are playing a larger role in delivering battery management systems to markets like commercial energy storage and industrial systems.
By End User
The automotive manufacturers segment is expected to hold the largest share of the global AI driven battery management systems market in 2025, primarily due to their early and largescale adoption of advanced battery technologies to support electric mobility. Energy Companies follow closely, leveraging AI battery management systems to enhance grid storage and renewable energy integration. On other hand, the data centers segment is expected to experience the fastest growth rate during the forecast period, driven by rising power density demands, escalating energy costs, and the vital need for uninterrupted power to support digital infrastructure. Meanwhile, Industrial Facilities and the telecommunications sector are also emerging as strong growth areas, as intelligent battery systems become increasingly important for maintaining operational continuity and managing long term energy expenses.
By Geography
North America is expected to hold the largest share of the global AI driven battery management systems market in 2025, followed by Europe, due to rising adoption of electric vehicles, significant R&D investments, and strong regulatory frameworks supporting battery safety and efficiency. However, the Asia Pacific region especially China, South Korea, and Japan is witnessing the fastest growth rate during the forecast period, primarily driven by large scale EV production, proactive government initiatives to advance battery technologies, and rising deployments of energy storage systems. Meanwhile, the Middle East & Africa region is showing significant growth potential, particularly due to many industries in this region focusing on modernizing grid infrastructure and integrating renewable energy sources.
Competitive Landscape
The global AI-driven battery management systems market features a diverse competitive landscape with established battery manufacturers and semiconductor companies expanding AI capabilities alongside innovative software-focused startups gaining significant market share.
Established Consumer Goods Companies
CATL (Contemporary Amperex Technology Co., Limited) leads the market among established players, offering a broad range of AI-enabled battery management solutions that support various battery chemistries and applications. LG Energy Solution, Ltd. has strengthened its market position by integrating proprietary algorithms that enhance cell-level optimization and enable predictive maintenance. Panasonic Holdings Corporation maintains a strong market presence through its long-standing collaborations with automotive OEMs and energy storage providers. These companies primarily compete based on large-scale manufacturing capabilities, robust hardware-software integration, and well-established customer relationships across diverse sectors
Independent Sustainable Manufacturers
Tesla, Inc. has significantly disrupted the AI-driven BMS market with its vertically integrated model, combining proprietary hardware and self-learning algorithms refined through extensive real-world data. TWAICE Technologies GmbH has gained strong industry recognition for its battery analytics software, offering cloud-based predictive maintenance and lifecycle insights. Siemens AG stands out through its advanced use of digital twin technology, particularly in industrial and grid-scale battery applications. These tech-driven players primarily compete on the precision of their algorithms, adaptive learning capabilities, and the flexibility of their software to integrate with diverse battery systems.
The broader manufacturing landscape is evolving through growing collaboration between battery producers and AI software developers, while semiconductor companies are increasingly investing in specialized processors tailored for battery management tasks. Leading manufacturers are shifting toward cloud-to-edge architectures, enabling real time local processing while continuously improving AI algorithms through fleet wide learning.
As the market matures, manufacturers will need to address data ownership and privacy concerns, establishing standardized performance metrics for evaluating AI algorithms, and delivering cost-effective solutions that demonstrate clear ROI beyond early adopters. To achieve extensive adoption, successful companies must strike a balance between offering advanced AI capabilities and ensuring seamless, practical implementation across a wide range of battery applications.
|
Particulars |
Details |
|
Number of Pages |
285 |
|
Format |
PDF & Excel |
|
Forecast Period |
2025–2032 |
|
Base Year |
2024 |
|
CAGR (Value) |
20.6% |
|
Market Size (Value)in 2025 |
USD 4.1 Billion |
|
Market Size (Value) in 2032 |
USD 18.5 Billion |
|
Segments Covered |
By Component
By Application,
By Distribution Channel,
By End User,
|
|
Countries Covered |
North America (U.S., Canada) |
|
Key Companies |
CATL (Contemporary Amperex Technology Co., Limited), LG Energy Solution, Ltd., Panasonic Holdings Corporation, Tesla, Inc., Samsung SDI Co., Ltd., BYD Company Limited, Siemens AG, Texas Instruments Incorporated, Analog Devices, Inc., NXP Semiconductors N.V., Northvolt AB, Infineon Technologies AG, TWAICE Technologies GmbH, ABB Ltd., and Bosch Mobility Solutions (Robert Bosch GmbH). |
The global AI-driven battery management systems market was valued at $3.4 billion in 2024. This market is expected to reach $18.5 billion by 2032 from an estimated $4.1 billion in 2025, at a CAGR of 20.6% during the forecast period of 2025–2032.
The global AI-driven battery management systems market is expected to grow at a CAGR of 20.6% during the forecast period of 2025–2032.
The global AI-driven battery management systems market is expected to reach $18.5 billion by 2032 from an estimated $4.1 billion in 2025, at a CAGR of 20.6% during the forecast period of 2025–2032.
The key companies operating in this market include CATL (Contemporary Amperex Technology Co., Limited), LG Energy Solution, Ltd., Panasonic Holdings Corporation, Tesla, Inc., Samsung SDI Co., Ltd., BYD Company Limited, Siemens AG, Texas Instruments Incorporated, Analog Devices, Inc., NXP Semiconductors N.V., Northvolt AB, Infineon Technologies AG, TWAICE Technologies GmbH, ABB Ltd., and Bosch Mobility Solutions (Robert Bosch GmbH).
Major trends shaping the market include shift from hardware-centric to software-defined BMS solutions, integration of digital twin technology for predictive battery modeling, wireless BMS architecture adoption, edge AI processors optimized for battery applications, and performance-based BMS licensing models.
North America leads the global market, followed by Europe, due to advanced electric vehicle adoption, substantial R&D investments, and strong regulatory push for battery performance. Asia-Pacific is witnessing the highest growth rate driven by massive manufacturing scale and government initiatives.
The growth of this market is driven by increasing demand for extended battery lifecycles, stringent safety regulations, growing need for SOC and SOH accuracy, rising adoption of fast charging technologies requiring advanced thermal management, and pressure to reduce battery warranty claims and recalls.
1. Market Definition & Scope
1.1. Market Definition
1.2. Market Ecosystem
1.3. Currency
1.4. Key Stakeholders
2. Research Methodology
2.1. Research Approach
2.2. Process of Data Collection and Validation
2.2.1. Secondary Research
2.2.2. Primary Research/Interviews with Key Opinion Leaders from the Industry
2.3. Market Sizing and Forecast
2.3.1. Market Size Estimation Approach
2.3.1.1. Bottom-up Approach
2.3.1.2. Top-down Approach
2.3.2. Growth Forecast Approach
2.3.3. Assumptions for the Study
3. Executive Summary
3.1. Overview
3.2. Segmental Analysis
3.2.1. AI-Driven Battery Management Systems Market, by Component
3.2.2. AI-Driven Battery Management Systems Market, by Application
3.2.3. AI-Driven Battery Management Systems Market, by Distribution Channel
3.2.4. AI-Driven Battery Management Systems Market, by End User
3.2.5. AI-Driven Battery Management Systems Market, by Geography
3.3. Competitive Landscape
4. Market Insights
4.1. Overview
4.2. Factors Affecting Market Growth
4.2.1. Drivers
4.2.1.1. Increasing Demand for Extended Battery Lifecycles and Reduced Replacement Costs
4.2.1.2. Stringent Battery Safety Regulations and Compliance Requirements
4.2.1.3. Growing Need for Real-time SOC and SOH Accuracy in High-Performance Applications
4.2.1.4. Rising Adoption of Fast-Charging Technologies Requiring Advanced Thermal Management
4.2.1.5. Pressure to Reduce Battery Warranty Claims and Recalls
4.2.2. Restraints
4.2.2.1. High Initial R&D Investment for Algorithm Development
4.2.2.2. Challenges in Battery Data Collection and Standardization
4.2.2.3. Computational Requirements for Edge Processing vs. Cloud Solutions
4.2.2.4. Retrofitting Difficulties in Existing Battery Systems
4.2.2.5. Algorithm Performance Verification and Validation Complexities
4.2.3. Opportunities
4.2.3.1. Second-Life Battery Applications and Circular Economy Initiatives
4.2.3.2. Vehicle-to-Grid (V2G) Integration Requiring Sophisticated BMS Intelligence
4.2.3.3. Battery-as-a-Service (BaaS) Business Models
4.2.3.4. Multi-Chemistry BMS Solutions for Diverse Applications
4.2.3.5. Customized BMS Solutions for Emerging Markets
4.2.4. Trends
4.2.4.1. Shift from Hardware-Centric to Software-Defined BMS Solutions
4.2.4.2. Integration of Digital Twin Technology for Predictive Battery Modeling
4.2.4.3. Wireless BMS Architecture Adoption for Weight Reduction
4.2.4.4. Edge AI Processors Optimized for Battery Applications
4.2.4.5. Performance-Based BMS Licensing and Battery-as-a-Service Models
4.2.5. Challenges
4.2.5.1. Balancing Edge Computing and Cloud Computing Capabilities
4.2.5.2. Intellectual Property Protection for Proprietary Algorithms
4.2.5.3. Managing Battery Data Ownership and Privacy Issues
4.2.5.4. Cross-Industry Compatibility and Interoperability Standards
4.2.5.5. Scaling AI Solutions From Laboratory to Mass Production
4.3. Porter’s Five Forces Analysis
4.3.1. Bargaining Power of Suppliers
4.3.2. Bargaining Power of Buyers
4.3.3. Threat of Substitutes
4.3.4. Threat of New Entrants
4.3.5. Degree of Competition
4.4. Sustainability Impact on AI-Driven Battery Management Systems Market
4.4.1. Key Sustainability Dimensions Driving Industry Strategy
4.4.1.1. Circular Economy Integration
4.4.1.2. Resource Efficiency Optimization
4.4.1.3. Carbon Footprint Reduction
4.4.2. Industry Adoption Strategies and Implementation Challenges
4.4.3. Implementation Challenges
4.4.4. Market Differentiation through Sustainability
4.4.5. Future Sustainability Trajectory
4.5. Market Size Relationship and Value Chain Analysis
4.5.1. Value Chain Overview and Revenue Distribution
4.5.2. Relationship Between Hardware Components and Software Solutions Market Sizing
4.5.3. Margin Analysis Across the AI-Driven BMS Value Chain
4.5.4. Revenue Attribution in AI-Driven BMS Business Models
4.5.5. Future Outlook and Strategic Implications
5. AI-Driven Battery Management Systems Market Assessment—by Component
5.1. Hardware
5.1.1. Sensors and Monitoring Systems
5.1.1.1. Current, Voltage, and Temperature Sensors
5.1.1.2. Integrated Multi-Parameter Sensing Systems
5.1.2. Control Units and Processing Hardware
5.1.2.1. Standard BMS Controllers
5.1.2.2. AI-Optimized BMS Processors
5.1.2.3. FPGA-Based Solutions
5.1.3. Communication Modules
5.1.4. Safety Circuits
5.1.5. Battery Balancing Hardware
5.2. Software and AI Solutions
5.2.1. BMS Core Software
5.2.1.1. State Estimation (SOC, SOH, RUL)
5.2.1.2. Thermal Management
5.2.1.3. Cell Balancing Algorithms
5.2.2. AI/ML Components
5.2.2.1. Predictive Analytics Models
5.2.2.2. Anomaly Detection Systems
5.2.2.3. Optimization Algorithms
5.2.2.4. AI Model Types (Neural Networks, Reinforcement Learning, etc.)
5.3. Services
5.3.1. Implementation & Integration Services
5.3.2. AI Model Training & Customization
5.3.3. Ongoing Support & Maintenance
5.3.4. Data Analytics Services
5.3.5. Consulting and Training Services
6. AI-Driven Battery Management Systems Market Assessment—by Application
6.1. Overview
6.2. Electric Vehicles
6.2.1. Passenger Cars
6.2.2. Commercial Vehicles
6.2.3. Two-Wheelers
6.3. Energy Storage Systems
6.3.1. Residential
6.3.2. Commercial/Industrial
6.3.3. Utility-Scale
6.4. Grid Infrastructure
6.5. Consumer Electronics
6.6. Industrial Equipment
6.7. Medical Devices
6.8. Data Centers
6.9. Aerospace and Defense
6.10. Marine
7. AI-Driven Battery Management Systems Market Assessment—by Distribution Channel
7.1. Overview
7.2. Direct Channel
7.2.1. Manufacturer Direct Sales
7.2.2. Manufacturer-Owned Digital Platforms
7.3. Indirect Channel
7.3.1. OEM Integration Partners
7.3.2. System Integrators & Solution Providers
7.3.3. Value-Added Resellers & Distributors
7.3.4. Third-Party Online Marketplaces
8. AI-Driven Battery Management Systems Market Assessment—by End User
8.1. Overview
8.2. Automotive Manufacturers
8.3. Energy Companies
8.4. Electronics Manufacturers
8.5. Industrial Facilities
8.6. Healthcare Institutions
8.7. Telecommunications
8.8. Data Centers
8.9. Government and Defense
9. AI-Driven Battery Management Systems Market Assessment—by Geography
9.1. Overview
9.2. North America
9.2.1. U.S.
9.2.2. Canada
9.3. Europe
9.3.1. Germany
9.3.2. France
9.3.3. U.K.
9.3.4. Italy
9.3.5. Spain
9.3.6. Netherlands
9.3.7. Rest of Europe (RoE)
9.4. Asia-Pacific
9.4.1. China
9.4.2. Japan
9.4.3. India
9.4.4. South Korea
9.4.5. Australia
9.4.6. Rest of Asia-Pacific (RoAPAC)
9.5. Latin America
9.5.1. Brazil
9.5.2. Mexico
9.5.3. Argentina
9.5.4. Rest of Latin America (RoLATAM)
9.6. Middle East & Africa
9.6.1. Saudi Arabia
9.6.2. South Africa
9.6.3. United Arab Emirates (UAE)
9.6.4. Rest of Middle East & Africa (RoMEA)
10. Competitive Landscape
10.1. Overview
10.2. Key Growth Strategies
10.3. Competitive Benchmarking
10.4. Competitive Dashboard
10.4.1. Industry Leaders
10.4.2. Market Differentiators
10.4.3. Vanguards
10.4.4. Contemporary Stalwarts
10.5. Market Share/Ranking Analysis, by the Key Players, 2024
11. Company Profiles (Business Overview, Financial Overview, Product Portfolio, Strategic Developments, and SWOT Analysis*)
11.1. CATL (Contemporary Amperex Technology Co., Limited)
11.2. LG Energy Solution, Ltd.
11.3. Panasonic Holdings Corporation
11.4. Tesla, Inc.
11.5. Samsung SDI Co., Ltd.
11.6. BYD Company Limited
11.7. Siemens AG
11.8. Texas Instruments Incorporated
11.9. Analog Devices, Inc.
11.10. NXP Semiconductors N.V.
11.11. Northvolt AB
11.12. Infineon Technologies AG
11.13. TWAICE Technologies GmbH
11.14. ABB Ltd.
11.15. Bosch Mobility Solutions (Robert Bosch GmbH)
12. Appendix
12.1. Available Customization
12.2. Related Reports
List of Tables
Table 1. Global AI-Driven Battery Management Systems Market, by Component, 2023–2032 (USD Million)
Table 2. Global AI-Driven Battery Management Hardware Systems Market, by Type, 2023–2032 (USD Million)
Table 3. Global AI-Driven Battery Management Hardware Systems Market, by Country/Region, 2023–2032 (USD Million)
Table 4. Global Sensors and Monitoring Systems Market, by Type, 2023–2032 (USD Million)
Table 5. Global Sensors and Monitoring Systems Market, by Country/Region, 2023–2032 (USD Million)
Table 6. Global Current, Voltage, and Temperature Sensors Market, by Country/Region, 2023–2032 (USD Million)
Table 7. Global Integrated Multi-Parameter Sensing Systems Market, by Country/Region, 2023–2032 (USD Million)
Table 8. Global Control Units and Processing Hardware Market, by Type, 2023–2032 (USD Million)
Table 9. Global Standard BMS Controllers Market, by Country/Region, 2023–2032 (USD Million)
Table 10. Global AI-Optimized BMS Processors Market, by Country/Region, 2023–2032 (USD Million)
Table 11. Global FPGA-Based Solutions Market, by Country/Region, 2023–2032 (USD Million)
Table 12. Global Communication Modules Market, by Country/Region, 2023–2032 (USD Million)
Table 13. Global Safety Circuits Market, by Country/Region, 2023–2032 (USD Million)
Table 14. Global Battery Balancing Hardware Market, by Country/Region, 2023–2032 (USD Million)
Table 15. Global AI-Driven Battery Management Software and AI Solutions Market, by Type, 2023–2032 (USD Million)
Table 16. Global AI-Driven Battery Management Software and AI Solutions Market, by Country/Region, 2023–2032 (USD Million)
Table 17. Global BMS Core Software Market, by Type, 2023–2032 (USD Million)
Table 18. Global BMS Core Software Market, by Country/Region, 2023–2032 (USD Million)
Table 19. Global State Estimation (SOC, SOH, RUL) Market, by Country/Region, 2023–2032 (USD Million)
Table 20. Global Thermal Management Market, by Country/Region, 2023–2032 (USD Million)
Table 21. Global Cell Balancing Algorithms Market, by Country/Region, 2023–2032 (USD Million)
Table 22. Global AI/ML Components Market, by Type, 2023–2032 (USD Million)
Table 23. Global AI/ML Components Market, by Country/Region, 2023–2032 (USD Million)
Table 24. Global Predictive Analytics Models Market, by Country/Region, 2023–2032 (USD Million)
Table 25. Global Anomaly Detection Systems Market, by Country/Region, 2023–2032 (USD Million)
Table 26. Global Optimization Algorithms Market, by Country/Region, 2023–2032 (USD Million)
Table 27. Global AI Model Types (Neural Networks, Reinforcement Learning, etc.) Market, by Country/Region, 2023–2032 (USD Million)
Table 28. Global AI-Driven Battery Management Services Market, by Type, 2023–2032 (USD Million)
Table 29. Global AI-Driven Battery Management Services Market, by Country/Region, 2023–2032 (USD Million)
Table 30. Global Implementation & Integration Services Market, by Country/Region, 2023–2032 (USD Million)
Table 31. Global AI Model Training & Customization Market, by Country/Region, 2023–2032 (USD Million)
Table 32. Global Ongoing Support & Maintenance Market, by Country/Region, 2023–2032 (USD Million)
Table 33. Global Data Analytics Services Market, by Country/Region, 2023–2032 (USD Million)
Table 34. Global Consulting and Training Services Market, by Country/Region, 2023–2032 (USD Million)
Table 35. Global AI-Driven Battery Management Systems Market, by Application, 2023–2032 (USD Million)
Table 36. Global AI-Driven Battery Management Systems Market for Electric Vehicles, by Type, 2023–2032 (USD Million)
Table 37. Global AI-Driven Battery Management Systems Market for Electric Vehicles, by Country/Region, 2023–2032 (USD Million)
Table 38. Global AI-Driven Battery Management Systems Market for Passenger Cars, by Country/Region, 2023–2032 (USD Million)
Table 39. Global AI-Driven Battery Management Systems Market for Commercial Vehicles, by Country/Region, 2023–2032 (USD Million)
Table 40. Global AI-Driven Battery Management Systems Market for Two-Wheelers, by Country/Region, 2023–2032 (USD Million)
Table 41. Global AI-Driven Battery Management Systems Market for Stationary Energy Storage, by Type, 2023–2032 (USD Million)
Table 42. Global AI-Driven Battery Management Systems Market for Stationary Energy Storage, by Country/Region, 2023–2032 (USD Million)
Table 43. Global AI-Driven Battery Management Systems Market for Residential, by Country/Region, 2023–2032 (USD Million)
Table 44. Global AI-Driven Battery Management Systems Market for Commercial/Industrial, by Country/Region, 2023–2032 (USD Million)
Table 45. Global AI-Driven Battery Management Systems Market for Utility-Scale, by Country/Region, 2023–2032 (USD Million)
Table 46. Global AI-Driven Battery Management Systems Market for Grid Infrastructure, by Country/Region, 2023–2032 (USD Million)
Table 47. Global AI-Driven Battery Management Systems Market for Consumer Electronics, by Country/Region, 2023–2032 (USD Million)
Table 48. Global AI-Driven Battery Management Systems Market for Industrial Equipment, by Country/Region, 2023–2032 (USD Million)
Table 49. Global AI-Driven Battery Management Systems Market for Medical Devices, by Country/Region, 2023–2032 (USD Million)
Table 50. Global AI-Driven Battery Management Systems Market for Data Centers, by Country/Region, 2023–2032 (USD Million)
Table 51. Global AI-Driven Battery Management Systems Market for Aerospace and Defense, by Country/Region, 2023–2032 (USD Million)
Table 52. Global AI-Driven Battery Management Systems Market for Marine, by Country/Region, 2023–2032 (USD Million)
Table 53. Global AI-Driven Battery Management Systems Market, by Distribution Channel, 2023–2032 (USD Million)
Table 54. Global AI-Driven Battery Management Systems Market for Direct Channel, by Type, 2023–2032 (USD Million)
Table 55. Global AI-Driven Battery Management Systems Market for Direct Channel, by Country/Region, 2023–2032 (USD Million)
Table 56. Global AI-Driven Battery Management Systems Market for Manufacturer Direct Sales, by Country/Region, 2023–2032 (USD Million)
Table 57. Global AI-Driven Battery Management Systems Market for Manufacturer-Owned Digital Platforms, by Country/Region, 2023–2032 (USD Million)
Table 58. Global AI-Driven Battery Management Systems Market for Indirect Channel, by Type, 2023–2032 (USD Million)
Table 59. Global AI-Driven Battery Management Systems Market for Indirect Channel, by Country/Region, 2023–2032 (USD Million)
Table 60. Global AI-Driven Battery Management Systems Market for OEM Integration Partners, by Country/Region, 2023–2032 (USD Million)
Table 61. Global AI-Driven Battery Management Systems Market for System Integrators & Solution Providers, by Country/Region, 2023–2032 (USD Million)
Table 62. Global AI-Driven Battery Management Systems Market for Value-Added Resellers & Distributors, by Country/Region, 2023–2032 (USD Million)
Table 63. Global AI-Driven Battery Management Systems Market for Third-Party Online Marketplaces, by Country/Region, 2023–2032 (USD Million)
Table 64. Global AI-Driven Battery Management Systems Market, by End User, 2023–2032 (USD Million)
Table 65. Global AI-Driven Battery Management Systems Market for Automotive Manufacturers, by Country/Region, 2023–2032 (USD Million)
Table 66. Global AI-Driven Battery Management Systems Market for Energy Companies, by Country/Region, 2023–2032 (USD Million)
Table 67. Global AI-Driven Battery Management Systems Market for Electronics Manufacturers, by Country/Region, 2023–2032 (USD Million)
Table 68. Global AI-Driven Battery Management Systems Market for Industrial Facilities, by Country/Region, 2023–2032 (USD Million)
Table 69. Global AI-Driven Battery Management Systems Market for Healthcare Institutions, by Country/Region, 2023–2032 (USD Million)
Table 70. Global AI-Driven Battery Management Systems Market for Telecommunications, by Country/Region, 2023–2032 (USD Million)
Table 71. Global AI-Driven Battery Management Systems Market for Data Centers, by Country/Region, 2023–2032 (USD Million)
Table 72. Global AI-Driven Battery Management Systems Market for Government and Defense, by Country/Region, 2023–2032 (USD Million)
Table 73. North America: AI-Driven Battery Management Systems Market, by Component, 2023–2032 (USD Million)
Table 74. North America: AI-Driven Battery Management Hardware Systems Market, by Type, 2023–2032 (USD Million)
Table 75. North America: Sensors and Monitoring Systems Market, by Type, 2023–2032 (USD Million)
Table 76. North America: Control Units and Processing Hardware Market, by Type, 2023–2032 (USD Million)
Table 77. North America: AI-Driven Battery Management Software and AI Solutions Market, by Type, 2023–2032 (USD Million)
Table 78. North America: BMS Core Software Market, by Type, 2023–2032 (USD Million)
Table 79. North America: AI/ML Components Market, by Type, 2023–2032 (USD Million)
Table 80. North America: AI-Driven Battery Management Services Market, by Type, 2023–2032 (USD Million)
Table 81. North America: AI-Driven Battery Management Systems Market, by Application, 2023–2032 (USD Million)
Table 82. North America: AI-Driven Battery Management Systems Market for Electric Vehicles, by Type, 2023–2032 (USD Million)
Table 83. North America: AI-Driven Battery Management Systems Market for Stationary Energy Storage, by Type, 2023–2032 (USD Million)
Table 84. North America: AI-Driven Battery Management Systems Market, by Distribution Channel, 2023–2032 (USD Million)
Table 85. North America: AI-Driven Battery Management Systems Market for Direct Channel, by Type, 2023–2032 (USD Million)
Table 86. North America: AI-Driven Battery Management Systems Market for Indirect Channel, by Type, 2023–2032 (USD Million)
Table 87. North America: AI-Driven Battery Management Systems Market, by End User, 2023–2032 (USD Million)
Table 88. U.S.: AI-Driven Battery Management Systems Market, by Component, 2023–2032 (USD Million)
Table 89. U.S.: AI-Driven Battery Management Hardware Systems Market, by Type, 2023–2032 (USD Million)
Table 90. U.S.: Sensors and Monitoring Systems Market, by Type, 2023–2032 (USD Million)
Table 91. U.S.: Control Units and Processing Hardware Market, by Type, 2023–2032 (USD Million)
Table 92. U.S.: AI-Driven Battery Management Software and AI Solutions Market, by Type, 2023–2032 (USD Million)
Table 93. U.S.: BMS Core Software Market, by Type, 2023–2032 (USD Million)
Table 94. U.S.: AI/ML Components Market, by Type, 2023–2032 (USD Million)
Table 95. U.S.: AI-Driven Battery Management Services Market, by Type, 2023–2032 (USD Million)
Table 96. U.S.: AI-Driven Battery Management Systems Market, by Application, 2023–2032 (USD Million)
Table 97. U.S.: AI-Driven Battery Management Systems Market for Electric Vehicles, by Type, 2023–2032 (USD Million)
Table 98. U.S.: AI-Driven Battery Management Systems Market for Stationary Energy Storage, by Type, 2023–2032 (USD Million)
Table 99. U.S.: AI-Driven Battery Management Systems Market, by Distribution Channel, 2023–2032 (USD Million)
Table 100. U.S.: AI-Driven Battery Management Systems Market for Direct Channel, by Type, 2023–2032 (USD Million)
Table 101. U.S.: AI-Driven Battery Management Systems Market for Indirect Channel, by Type, 2023–2032 (USD Million)
Table 102. U.S.: AI-Driven Battery Management Systems Market, by End User, 2023–2032 (USD Million)
Table 103. Canada: AI-Driven Battery Management Systems Market, by Component, 2023–2032 (USD Million)
Table 104. Canada: AI-Driven Battery Management Hardware Systems Market, by Type, 2023–2032 (USD Million)
Table 105. Canada: Sensors and Monitoring Systems Market, by Type, 2023–2032 (USD Million)
Table 106. Canada: Control Units and Processing Hardware Market, by Type, 2023–2032 (USD Million)
Table 107. Canada: AI-Driven Battery Management Software and AI Solutions Market, by Type, 2023–2032 (USD Million)
Table 108. Canada: BMS Core Software Market, by Type, 2023–2032 (USD Million)
Table 109. Canada: AI/ML Components Market, by Type, 2023–2032 (USD Million)
Table 110. Canada: AI-Driven Battery Management Services Market, by Type, 2023–2032 (USD Million)
Table 111. Canada: AI-Driven Battery Management Systems Market, by Application, 2023–2032 (USD Million)
Table 112. Canada: AI-Driven Battery Management Systems Market for Electric Vehicles, by Type, 2023–2032 (USD Million)
Table 113. Canada: AI-Driven Battery Management Systems Market for Stationary Energy Storage, by Type, 2023–2032 (USD Million)
Table 114. Canada: AI-Driven Battery Management Systems Market, by Distribution Channel, 2023–2032 (USD Million)
Table 115. Canada: AI-Driven Battery Management Systems Market for Direct Channel, by Type, 2023–2032 (USD Million)
Table 116. Canada: AI-Driven Battery Management Systems Market for Indirect Channel, by Type, 2023–2032 (USD Million)
Table 117. Canada: AI-Driven Battery Management Systems Market, by End User, 2023–2032 (USD Million)
Table 118. Europe: AI-Driven Battery Management Systems Market, by Component, 2023–2032 (USD Million)
Table 119. Europe: AI-Driven Battery Management Hardware Systems Market, by Type, 2023–2032 (USD Million)
Table 120. Europe: Sensors and Monitoring Systems Market, by Type, 2023–2032 (USD Million)
Table 121. Europe: Control Units and Processing Hardware Market, by Type, 2023–2032 (USD Million)
Table 122. Europe: AI-Driven Battery Management Software and AI Solutions Market, by Type, 2023–2032 (USD Million)
Table 123. Europe: BMS Core Software Market, by Type, 2023–2032 (USD Million)
Table 124. Europe: AI/ML Components Market, by Type, 2023–2032 (USD Million)
Table 125. Europe: AI-Driven Battery Management Services Market, by Type, 2023–2032 (USD Million)
Table 126. Europe: AI-Driven Battery Management Systems Market, by Application, 2023–2032 (USD Million)
Table 127. Europe: AI-Driven Battery Management Systems Market for Electric Vehicles, by Type, 2023–2032 (USD Million)
Table 128. Europe: AI-Driven Battery Management Systems Market for Stationary Energy Storage, by Type, 2023–2032 (USD Million)
Table 129. Europe: AI-Driven Battery Management Systems Market, by Distribution Channel, 2023–2032 (USD Million)
Table 130. Europe: AI-Driven Battery Management Systems Market for Direct Channel, by Type, 2023–2032 (USD Million)
Table 131. Europe: AI-Driven Battery Management Systems Market for Indirect Channel, by Type, 2023–2032 (USD Million)
Table 132. Europe: AI-Driven Battery Management Systems Market, by End User, 2023–2032 (USD Million)
Table 133. Germany: AI-Driven Battery Management Systems Market, by Component, 2023–2032 (USD Million)
Table 134. Germany: AI-Driven Battery Management Hardware Systems Market, by Type, 2023–2032 (USD Million)
Table 135. Germany: Sensors and Monitoring Systems Market, by Type, 2023–2032 (USD Million)
Table 136. Germany: Control Units and Processing Hardware Market, by Type, 2023–2032 (USD Million)
Table 137. Germany: AI-Driven Battery Management Software and AI Solutions Market, by Type, 2023–2032 (USD Million)
Table 138. Germany: BMS Core Software Market, by Type, 2023–2032 (USD Million)
Table 139. Germany: AI/ML Components Market, by Type, 2023–2032 (USD Million)
Table 140. Germany: AI-Driven Battery Management Services Market, by Type, 2023–2032 (USD Million)
Table 141. Germany: AI-Driven Battery Management Systems Market, by Application, 2023–2032 (USD Million)
Table 142. Germany: AI-Driven Battery Management Systems Market for Electric Vehicles, by Type, 2023–2032 (USD Million)
Table 143. Germany: AI-Driven Battery Management Systems Market for Stationary Energy Storage, by Type, 2023–2032 (USD Million)
Table 144. Germany: AI-Driven Battery Management Systems Market, by Distribution Channel, 2023–2032 (USD Million)
Table 145. Germany: AI-Driven Battery Management Systems Market for Direct Channel, by Type, 2023–2032 (USD Million)
Table 146. Germany: AI-Driven Battery Management Systems Market for Indirect Channel, by Type, 2023–2032 (USD Million)
Table 147. Germany: AI-Driven Battery Management Systems Market, by End User, 2023–2032 (USD Million)
Table 148. France: AI-Driven Battery Management Systems Market, by Component, 2023–2032 (USD Million)
Table 149. France: AI-Driven Battery Management Hardware Systems Market, by Type, 2023–2032 (USD Million)
Table 150. France: Sensors and Monitoring Systems Market, by Type, 2023–2032 (USD Million)
Table 151. France: Control Units and Processing Hardware Market, by Type, 2023–2032 (USD Million)
Table 152. France: AI-Driven Battery Management Software and AI Solutions Market, by Type, 2023–2032 (USD Million)
Table 153. France: BMS Core Software Market, by Type, 2023–2032 (USD Million)
Table 154. France: AI/ML Components Market, by Type, 2023–2032 (USD Million)
Table 155. France: AI-Driven Battery Management Services Market, by Type, 2023–2032 (USD Million)
Table 156. France: AI-Driven Battery Management Systems Market, by Application, 2023–2032 (USD Million)
Table 157. France: AI-Driven Battery Management Systems Market for Electric Vehicles, by Type, 2023–2032 (USD Million)
Table 158. France: AI-Driven Battery Management Systems Market for Stationary Energy Storage, by Type, 2023–2032 (USD Million)
Table 159. France: AI-Driven Battery Management Systems Market, by Distribution Channel, 2023–2032 (USD Million)
Table 160. France: AI-Driven Battery Management Systems Market for Direct Channel, by Type, 2023–2032 (USD Million)
Table 161. France: AI-Driven Battery Management Systems Market for Indirect Channel, by Type, 2023–2032 (USD Million)
Table 162. France: AI-Driven Battery Management Systems Market, by End User, 2023–2032 (USD Million)
Table 163. U.K.: AI-Driven Battery Management Systems Market, by Component, 2023–2032 (USD Million)
Table 164. U.K.: AI-Driven Battery Management Hardware Systems Market, by Type, 2023–2032 (USD Million)
Table 165. U.K.: Sensors and Monitoring Systems Market, by Type, 2023–2032 (USD Million)
Table 166. U.K.: Control Units and Processing Hardware Market, by Type, 2023–2032 (USD Million)
Table 167. U.K.: AI-Driven Battery Management Software and AI Solutions Market, by Type, 2023–2032 (USD Million)
Table 168. U.K.: BMS Core Software Market, by Type, 2023–2032 (USD Million)
Table 169. U.K.: AI/ML Components Market, by Type, 2023–2032 (USD Million)
Table 170. U.K.: AI-Driven Battery Management Services Market, by Type, 2023–2032 (USD Million)
Table 171. U.K.: AI-Driven Battery Management Systems Market, by Application, 2023–2032 (USD Million)
Table 172. U.K.: AI-Driven Battery Management Systems Market for Electric Vehicles, by Type, 2023–2032 (USD Million)
Table 173. U.K.: AI-Driven Battery Management Systems Market for Stationary Energy Storage, by Type, 2023–2032 (USD Million)
Table 174. U.K.: AI-Driven Battery Management Systems Market, by Distribution Channel, 2023–2032 (USD Million)
Table 175. U.K.: AI-Driven Battery Management Systems Market for Direct Channel, by Type, 2023–2032 (USD Million)
Table 176. U.K.: AI-Driven Battery Management Systems Market for Indirect Channel, by Type, 2023–2032 (USD Million)
Table 177. U.K.: AI-Driven Battery Management Systems Market, by End User, 2023–2032 (USD Million)
Table 178. Italy: AI-Driven Battery Management Systems Market, by Component, 2023–2032 (USD Million)
Table 179. Italy: AI-Driven Battery Management Hardware Systems Market, by Type, 2023–2032 (USD Million)
Table 180. Italy: Sensors and Monitoring Systems Market, by Type, 2023–2032 (USD Million)
Table 181. Italy: Control Units and Processing Hardware Market, by Type, 2023–2032 (USD Million)
Table 182. Italy: AI-Driven Battery Management Software and AI Solutions Market, by Type, 2023–2032 (USD Million)
Table 183. Italy: BMS Core Software Market, by Type, 2023–2032 (USD Million)
Table 184. Italy: AI/ML Components Market, by Type, 2023–2032 (USD Million)
Table 185. Italy: AI-Driven Battery Management Services Market, by Type, 2023–2032 (USD Million)
Table 186. Italy: AI-Driven Battery Management Systems Market, by Application, 2023–2032 (USD Million)
Table 187. Italy: AI-Driven Battery Management Systems Market for Electric Vehicles, by Type, 2023–2032 (USD Million)
Table 188. Italy: AI-Driven Battery Management Systems Market for Stationary Energy Storage, by Type, 2023–2032 (USD Million)
Table 189. Italy: AI-Driven Battery Management Systems Market, by Distribution Channel, 2023–2032 (USD Million)
Table 190. Italy: AI-Driven Battery Management Systems Market for Direct Channel, by Type, 2023–2032 (USD Million)
Table 191. Italy: AI-Driven Battery Management Systems Market for Indirect Channel, by Type, 2023–2032 (USD Million)
Table 192. Italy: AI-Driven Battery Management Systems Market, by End User, 2023–2032 (USD Million)
Table 193. Spain: AI-Driven Battery Management Systems Market, by Component, 2023–2032 (USD Million)
Table 194. Spain: AI-Driven Battery Management Hardware Systems Market, by Type, 2023–2032 (USD Million)
Table 195. Spain: Sensors and Monitoring Systems Market, by Type, 2023–2032 (USD Million)
Table 196. Spain: Control Units and Processing Hardware Market, by Type, 2023–2032 (USD Million)
Table 197. Spain: AI-Driven Battery Management Software and AI Solutions Market, by Type, 2023–2032 (USD Million)
Table 198. Spain: BMS Core Software Market, by Type, 2023–2032 (USD Million)
Table 199. Spain: AI/ML Components Market, by Type, 2023–2032 (USD Million)
Table 200. Spain: AI-Driven Battery Management Services Market, by Type, 2023–2032 (USD Million)
Table 201. Spain: AI-Driven Battery Management Systems Market, by Application, 2023–2032 (USD Million)
Table 202. Spain: AI-Driven Battery Management Systems Market for Electric Vehicles, by Type, 2023–2032 (USD Million)
Table 203. Spain: AI-Driven Battery Management Systems Market for Stationary Energy Storage, by Type, 2023–2032 (USD Million)
Table 204. Spain: AI-Driven Battery Management Systems Market, by Distribution Channel, 2023–2032 (USD Million)
Table 205. Spain: AI-Driven Battery Management Systems Market for Direct Channel, by Type, 2023–2032 (USD Million)
Table 206. Spain: AI-Driven Battery Management Systems Market for Indirect Channel, by Type, 2023–2032 (USD Million)
Table 207. Spain: AI-Driven Battery Management Systems Market, by End User, 2023–2032 (USD Million)
Table 208. Netherland: AI-Driven Battery Management Systems Market, by Component, 2023–2032 (USD Million)
Table 209. Netherland: AI-Driven Battery Management Hardware Systems Market, by Type, 2023–2032 (USD Million)
Table 210. Netherland: Sensors and Monitoring Systems Market, by Type, 2023–2032 (USD Million)
Table 211. Netherland: Control Units and Processing Hardware Market, by Type, 2023–2032 (USD Million)
Table 212. Netherland: AI-Driven Battery Management Software and AI Solutions Market, by Type, 2023–2032 (USD Million)
Table 213. Netherland: BMS Core Software Market, by Type, 2023–2032 (USD Million)
Table 214. Netherland: AI/ML Components Market, by Type, 2023–2032 (USD Million)
Table 215. Netherland: AI-Driven Battery Management Services Market, by Type, 2023–2032 (USD Million)
Table 216. Netherland: AI-Driven Battery Management Systems Market, by Application, 2023–2032 (USD Million)
Table 217. Netherland: AI-Driven Battery Management Systems Market for Electric Vehicles, by Type, 2023–2032 (USD Million)
Table 218. Netherland: AI-Driven Battery Management Systems Market for Stationary Energy Storage, by Type, 2023–2032 (USD Million)
Table 219. Netherland: AI-Driven Battery Management Systems Market, by Distribution Channel, 2023–2032 (USD Million)
Table 220. Netherland: AI-Driven Battery Management Systems Market for Direct Channel, by Type, 2023–2032 (USD Million)
Table 221. Netherland: AI-Driven Battery Management Systems Market for Indirect Channel, by Type, 2023–2032 (USD Million)
Table 222. Netherland: AI-Driven Battery Management Systems Market, by End User, 2023–2032 (USD Million)
Table 223. Rest of Europe: AI-Driven Battery Management Systems Market, by Component, 2023–2032 (USD Million)
Table 224. Rest of Europe: AI-Driven Battery Management Hardware Systems Market, by Type, 2023–2032 (USD Million)
Table 225. Rest of Europe: Sensors and Monitoring Systems Market, by Type, 2023–2032 (USD Million)
Table 226. Rest of Europe: Control Units and Processing Hardware Market, by Type, 2023–2032 (USD Million)
Table 227. Rest of Europe: AI-Driven Battery Management Software and AI Solutions Market, by Type, 2023–2032 (USD Million)
Table 228. Rest of Europe: BMS Core Software Market, by Type, 2023–2032 (USD Million)
Table 229. Rest of Europe: AI/ML Components Market, by Type, 2023–2032 (USD Million)
Table 230. Rest of Europe: AI-Driven Battery Management Services Market, by Type, 2023–2032 (USD Million)
Table 231. Rest of Europe: AI-Driven Battery Management Systems Market, by Application, 2023–2032 (USD Million)
Table 232. Rest of Europe: AI-Driven Battery Management Systems Market for Electric Vehicles, by Type, 2023–2032 (USD Million)
Table 233. Rest of Europe: AI-Driven Battery Management Systems Market for Stationary Energy Storage, by Type, 2023–2032 (USD Million)
Table 234. Rest of Europe: AI-Driven Battery Management Systems Market, by Distribution Channel, 2023–2032 (USD Million)
Table 235. Rest of Europe: AI-Driven Battery Management Systems Market for Direct Channel, by Type, 2023–2032 (USD Million)
Table 236. Rest of Europe: AI-Driven Battery Management Systems Market for Indirect Channel, by Type, 2023–2032 (USD Million)
Table 237. Rest of Europe: AI-Driven Battery Management Systems Market, by End User, 2023–2032 (USD Million)
Table 238. Asia-Pacific: AI-Driven Battery Management Systems Market, by Component, 2023–2032 (USD Million)
Table 239. Asia-Pacific: AI-Driven Battery Management Hardware Systems Market, by Type, 2023–2032 (USD Million)
Table 240. Asia-Pacific: Sensors and Monitoring Systems Market, by Type, 2023–2032 (USD Million)
Table 241. Asia-Pacific: Control Units and Processing Hardware Market, by Type, 2023–2032 (USD Million)
Table 242. Asia-Pacific: AI-Driven Battery Management Software and AI Solutions Market, by Type, 2023–2032 (USD Million)
Table 243. Asia-Pacific: BMS Core Software Market, by Type, 2023–2032 (USD Million)
Table 244. Asia-Pacific: AI/ML Components Market, by Type, 2023–2032 (USD Million)
Table 245. Asia-Pacific: AI-Driven Battery Management Services Market, by Type, 2023–2032 (USD Million)
Table 246. Asia-Pacific: AI-Driven Battery Management Systems Market, by Application, 2023–2032 (USD Million)
Table 247. Asia-Pacific: AI-Driven Battery Management Systems Market for Electric Vehicles, by Type, 2023–2032 (USD Million)
Table 248. Asia-Pacific: AI-Driven Battery Management Systems Market for Stationary Energy Storage, by Type, 2023–2032 (USD Million)
Table 249. Asia-Pacific: AI-Driven Battery Management Systems Market, by Distribution Channel, 2023–2032 (USD Million)
Table 250. Asia-Pacific: AI-Driven Battery Management Systems Market for Direct Channel, by Type, 2023–2032 (USD Million)
Table 251. Asia-Pacific: AI-Driven Battery Management Systems Market for Indirect Channel, by Type, 2023–2032 (USD Million)
Table 252. Asia-Pacific: AI-Driven Battery Management Systems Market, by End User, 2023–2032 (USD Million)
Table 253. China: AI-Driven Battery Management Systems Market, by Component, 2023–2032 (USD Million)
Table 254. China: AI-Driven Battery Management Hardware Systems Market, by Type, 2023–2032 (USD Million)
Table 255. China: Sensors and Monitoring Systems Market, by Type, 2023–2032 (USD Million)
Table 256. China: Control Units and Processing Hardware Market, by Type, 2023–2032 (USD Million)
Table 257. China: AI-Driven Battery Management Software and AI Solutions Market, by Type, 2023–2032 (USD Million)
Table 258. China: BMS Core Software Market, by Type, 2023–2032 (USD Million)
Table 259. China: AI/ML Components Market, by Type, 2023–2032 (USD Million)
Table 260. China: AI-Driven Battery Management Services Market, by Type, 2023–2032 (USD Million)
Table 261. China: AI-Driven Battery Management Systems Market, by Application, 2023–2032 (USD Million)
Table 262. China: AI-Driven Battery Management Systems Market for Electric Vehicles, by Type, 2023–2032 (USD Million)
Table 263. China: AI-Driven Battery Management Systems Market for Stationary Energy Storage, by Type, 2023–2032 (USD Million)
Table 264. China: AI-Driven Battery Management Systems Market, by Distribution Channel, 2023–2032 (USD Million)
Table 265. China: AI-Driven Battery Management Systems Market for Direct Channel, by Type, 2023–2032 (USD Million)
Table 266. China: AI-Driven Battery Management Systems Market for Indirect Channel, by Type, 2023–2032 (USD Million)
Table 267. China: AI-Driven Battery Management Systems Market, by End User, 2023–2032 (USD Million)
Table 268. Japan: AI-Driven Battery Management Systems Market, by Component, 2023–2032 (USD Million)
Table 269. Japan: AI-Driven Battery Management Hardware Systems Market, by Type, 2023–2032 (USD Million)
Table 270. Japan: Sensors and Monitoring Systems Market, by Type, 2023–2032 (USD Million)
Table 271. Japan: Control Units and Processing Hardware Market, by Type, 2023–2032 (USD Million)
Table 272. Japan: AI-Driven Battery Management Software and AI Solutions Market, by Type, 2023–2032 (USD Million)
Table 273. Japan: BMS Core Software Market, by Type, 2023–2032 (USD Million)
Table 274. Japan: AI/ML Components Market, by Type, 2023–2032 (USD Million)
Table 275. Japan: AI-Driven Battery Management Services Market, by Type, 2023–2032 (USD Million)
Table 276. Japan: AI-Driven Battery Management Systems Market, by Application, 2023–2032 (USD Million)
Table 277. Japan: AI-Driven Battery Management Systems Market for Electric Vehicles, by Type, 2023–2032 (USD Million)
Table 278. Japan: AI-Driven Battery Management Systems Market for Stationary Energy Storage, by Type, 2023–2032 (USD Million)
Table 279. Japan: AI-Driven Battery Management Systems Market, by Distribution Channel, 2023–2032 (USD Million)
Table 280. Japan: AI-Driven Battery Management Systems Market for Direct Channel, by Type, 2023–2032 (USD Million)
Table 281. Japan: AI-Driven Battery Management Systems Market for Indirect Channel, by Type, 2023–2032 (USD Million)
Table 282. Japan: AI-Driven Battery Management Systems Market, by End User, 2023–2032 (USD Million)
Table 283. India: AI-Driven Battery Management Systems Market, by Component, 2023–2032 (USD Million)
Table 284. India: AI-Driven Battery Management Hardware Systems Market, by Type, 2023–2032 (USD Million)
Table 285. India: Sensors and Monitoring Systems Market, by Type, 2023–2032 (USD Million)
Table 286. India: Control Units and Processing Hardware Market, by Type, 2023–2032 (USD Million)
Table 287. India: AI-Driven Battery Management Software and AI Solutions Market, by Type, 2023–2032 (USD Million)
Table 288. India: BMS Core Software Market, by Type, 2023–2032 (USD Million)
Table 289. India: AI/ML Components Market, by Type, 2023–2032 (USD Million)
Table 290. India: AI-Driven Battery Management Services Market, by Type, 2023–2032 (USD Million)
Table 291. India: AI-Driven Battery Management Systems Market, by Application, 2023–2032 (USD Million)
Table 292. India: AI-Driven Battery Management Systems Market for Electric Vehicles, by Type, 2023–2032 (USD Million)
Table 293. India: AI-Driven Battery Management Systems Market for Stationary Energy Storage, by Type, 2023–2032 (USD Million)
Table 294. India: AI-Driven Battery Management Systems Market, by Distribution Channel, 2023–2032 (USD Million)
Table 295. India: AI-Driven Battery Management Systems Market for Direct Channel, by Type, 2023–2032 (USD Million)
Table 296. India: AI-Driven Battery Management Systems Market for Indirect Channel, by Type, 2023–2032 (USD Million)
Table 297. India: AI-Driven Battery Management Systems Market, by End User, 2023–2032 (USD Million)
Table 298. South Korea: AI-Driven Battery Management Systems Market, by Component, 2023–2032 (USD Million)
Table 299. South Korea: AI-Driven Battery Management Hardware Systems Market, by Type, 2023–2032 (USD Million)
Table 300. South Korea: Sensors and Monitoring Systems Market, by Type, 2023–2032 (USD Million)
Table 301. South Korea: Control Units and Processing Hardware Market, by Type, 2023–2032 (USD Million)
Table 302. South Korea: AI-Driven Battery Management Software and AI Solutions Market, by Type, 2023–2032 (USD Million)
Table 303. South Korea: BMS Core Software Market, by Type, 2023–2032 (USD Million)
Table 304. South Korea: AI/ML Components Market, by Type, 2023–2032 (USD Million)
Table 305. South Korea: AI-Driven Battery Management Services Market, by Type, 2023–2032 (USD Million)
Table 306. South Korea: AI-Driven Battery Management Systems Market, by Application, 2023–2032 (USD Million)
Table 307. South Korea: AI-Driven Battery Management Systems Market for Electric Vehicles, by Type, 2023–2032 (USD Million)
Table 308. South Korea: AI-Driven Battery Management Systems Market for Stationary Energy Storage, by Type, 2023–2032 (USD Million)
Table 309. South Korea: AI-Driven Battery Management Systems Market, by Distribution Channel, 2023–2032 (USD Million)
Table 310. South Korea: AI-Driven Battery Management Systems Market for Direct Channel, by Type, 2023–2032 (USD Million)
Table 311. South Korea: AI-Driven Battery Management Systems Market for Indirect Channel, by Type, 2023–2032 (USD Million)
Table 312. South Korea: AI-Driven Battery Management Systems Market, by End User, 2023–2032 (USD Million)
Table 313. Australia: AI-Driven Battery Management Systems Market, by Component, 2023–2032 (USD Million)
Table 314. Australia: AI-Driven Battery Management Hardware Systems Market, by Type, 2023–2032 (USD Million)
Table 315. Australia: Sensors and Monitoring Systems Market, by Type, 2023–2032 (USD Million)
Table 316. Australia: Control Units and Processing Hardware Market, by Type, 2023–2032 (USD Million)
Table 317. Australia: AI-Driven Battery Management Software and AI Solutions Market, by Type, 2023–2032 (USD Million)
Table 318. Australia: BMS Core Software Market, by Type, 2023–2032 (USD Million)
Table 319. Australia: AI/ML Components Market, by Type, 2023–2032 (USD Million)
Table 320. Australia: AI-Driven Battery Management Services Market, by Type, 2023–2032 (USD Million)
Table 321. Australia: AI-Driven Battery Management Systems Market, by Application, 2023–2032 (USD Million)
Table 322. Australia: AI-Driven Battery Management Systems Market for Electric Vehicles, by Type, 2023–2032 (USD Million)
Table 323. Australia: AI-Driven Battery Management Systems Market for Stationary Energy Storage, by Type, 2023–2032 (USD Million)
Table 324. Australia: AI-Driven Battery Management Systems Market, by Distribution Channel, 2023–2032 (USD Million)
Table 325. Australia: AI-Driven Battery Management Systems Market for Direct Channel, by Type, 2023–2032 (USD Million)
Table 326. Australia: AI-Driven Battery Management Systems Market for Indirect Channel, by Type, 2023–2032 (USD Million)
Table 327. Australia: AI-Driven Battery Management Systems Market, by End User, 2023–2032 (USD Million)
Table 328. Rest of Asia-Pacific: AI-Driven Battery Management Systems Market, by Component, 2023–2032 (USD Million)
Table 329. Rest of Asia-Pacific: AI-Driven Battery Management Hardware Systems Market, by Type, 2023–2032 (USD Million)
Table 330. Rest of Asia-Pacific: Sensors and Monitoring Systems Market, by Type, 2023–2032 (USD Million)
Table 331. Rest of Asia-Pacific: Control Units and Processing Hardware Market, by Type, 2023–2032 (USD Million)
Table 332. Rest of Asia-Pacific: AI-Driven Battery Management Software and AI Solutions Market, by Type, 2023–2032 (USD Million)
Table 333. Rest of Asia-Pacific: BMS Core Software Market, by Type, 2023–2032 (USD Million)
Table 334. Rest of Asia-Pacific: AI/ML Components Market, by Type, 2023–2032 (USD Million)
Table 335. Rest of Asia-Pacific: AI-Driven Battery Management Services Market, by Type, 2023–2032 (USD Million)
Table 336. Rest of Asia-Pacific: AI-Driven Battery Management Systems Market, by Application, 2023–2032 (USD Million)
Table 337. Rest of Asia-Pacific: AI-Driven Battery Management Systems Market for Electric Vehicles, by Type, 2023–2032 (USD Million)
Table 338. Rest of Asia-Pacific: AI-Driven Battery Management Systems Market for Stationary Energy Storage, by Type, 2023–2032 (USD Million)
Table 339. Rest of Asia-Pacific: AI-Driven Battery Management Systems Market, by Distribution Channel, 2023–2032 (USD Million)
Table 340. Rest of Asia-Pacific: AI-Driven Battery Management Systems Market for Direct Channel, by Type, 2023–2032 (USD Million)
Table 341. Rest of Asia-Pacific: AI-Driven Battery Management Systems Market for Indirect Channel, by Type, 2023–2032 (USD Million)
Table 342. Rest of Asia-Pacific: AI-Driven Battery Management Systems Market, by End User, 2023–2032 (USD Million)
Table 343. Latin America: AI-Driven Battery Management Systems Market, by Component, 2023–2032 (USD Million)
Table 344. Latin America: AI-Driven Battery Management Hardware Systems Market, by Type, 2023–2032 (USD Million)
Table 345. Latin America: Sensors and Monitoring Systems Market, by Type, 2023–2032 (USD Million)
Table 346. Latin America: Control Units and Processing Hardware Market, by Type, 2023–2032 (USD Million)
Table 347. Latin America: AI-Driven Battery Management Software and AI Solutions Market, by Type, 2023–2032 (USD Million)
Table 348. Latin America: BMS Core Software Market, by Type, 2023–2032 (USD Million)
Table 349. Latin America: AI/ML Components Market, by Type, 2023–2032 (USD Million)
Table 350. Latin America: AI-Driven Battery Management Services Market, by Type, 2023–2032 (USD Million)
Table 351. Latin America: AI-Driven Battery Management Systems Market, by Application, 2023–2032 (USD Million)
Table 352. Latin America: AI-Driven Battery Management Systems Market for Electric Vehicles, by Type, 2023–2032 (USD Million)
Table 353. Latin America: AI-Driven Battery Management Systems Market for Stationary Energy Storage, by Type, 2023–2032 (USD Million)
Table 354. Latin America: AI-Driven Battery Management Systems Market, by Distribution Channel, 2023–2032 (USD Million)
Table 355. Latin America: AI-Driven Battery Management Systems Market for Direct Channel, by Type, 2023–2032 (USD Million)
Table 356. Latin America: AI-Driven Battery Management Systems Market for Indirect Channel, by Type, 2023–2032 (USD Million)
Table 357. Latin America: AI-Driven Battery Management Systems Market, by End User, 2023–2032 (USD Million)
Table 358. Brazil: AI-Driven Battery Management Systems Market, by Component, 2023–2032 (USD Million)
Table 359. Brazil: AI-Driven Battery Management Hardware Systems Market, by Type, 2023–2032 (USD Million)
Table 360. Brazil: Sensors and Monitoring Systems Market, by Type, 2023–2032 (USD Million)
Table 361. Brazil: Control Units and Processing Hardware Market, by Type, 2023–2032 (USD Million)
Table 362. Brazil: AI-Driven Battery Management Software and AI Solutions Market, by Type, 2023–2032 (USD Million)
Table 363. Brazil: BMS Core Software Market, by Type, 2023–2032 (USD Million)
Table 364. Brazil: AI/ML Components Market, by Type, 2023–2032 (USD Million)
Table 365. Brazil: AI-Driven Battery Management Services Market, by Type, 2023–2032 (USD Million)
Table 366. Brazil: AI-Driven Battery Management Systems Market, by Application, 2023–2032 (USD Million)
Table 367. Brazil: AI-Driven Battery Management Systems Market for Electric Vehicles, by Type, 2023–2032 (USD Million)
Table 368. Brazil: AI-Driven Battery Management Systems Market for Stationary Energy Storage, by Type, 2023–2032 (USD Million)
Table 369. Brazil: AI-Driven Battery Management Systems Market, by Distribution Channel, 2023–2032 (USD Million)
Table 370. Brazil: AI-Driven Battery Management Systems Market for Direct Channel, by Type, 2023–2032 (USD Million)
Table 371. Brazil: AI-Driven Battery Management Systems Market for Indirect Channel, by Type, 2023–2032 (USD Million)
Table 372. Brazil: AI-Driven Battery Management Systems Market, by End User, 2023–2032 (USD Million)
Table 373. Mexico: AI-Driven Battery Management Systems Market, by Component, 2023–2032 (USD Million)
Table 374. Mexico: AI-Driven Battery Management Hardware Systems Market, by Type, 2023–2032 (USD Million)
Table 375. Mexico: Sensors and Monitoring Systems Market, by Type, 2023–2032 (USD Million)
Table 376. Mexico: Control Units and Processing Hardware Market, by Type, 2023–2032 (USD Million)
Table 377. Mexico: AI-Driven Battery Management Software and AI Solutions Market, by Type, 2023–2032 (USD Million)
Table 378. Mexico: BMS Core Software Market, by Type, 2023–2032 (USD Million)
Table 379. Mexico: AI/ML Components Market, by Type, 2023–2032 (USD Million)
Table 380. Mexico: AI-Driven Battery Management Services Market, by Type, 2023–2032 (USD Million)
Table 381. Mexico: AI-Driven Battery Management Systems Market, by Application, 2023–2032 (USD Million)
Table 382. Mexico: AI-Driven Battery Management Systems Market for Electric Vehicles, by Type, 2023–2032 (USD Million)
Table 383. Mexico: AI-Driven Battery Management Systems Market for Stationary Energy Storage, by Type, 2023–2032 (USD Million)
Table 384. Mexico: AI-Driven Battery Management Systems Market, by Distribution Channel, 2023–2032 (USD Million)
Table 385. Mexico: AI-Driven Battery Management Systems Market for Direct Channel, by Type, 2023–2032 (USD Million)
Table 386. Mexico: AI-Driven Battery Management Systems Market for Indirect Channel, by Type, 2023–2032 (USD Million)
Table 387. Mexico: AI-Driven Battery Management Systems Market, by End User, 2023–2032 (USD Million)
Table 388. Argentina: AI-Driven Battery Management Systems Market, by Component, 2023–2032 (USD Million)
Table 389. Argentina: AI-Driven Battery Management Hardware Systems Market, by Type, 2023–2032 (USD Million)
Table 390. Argentina: Sensors and Monitoring Systems Market, by Type, 2023–2032 (USD Million)
Table 391. Argentina: Control Units and Processing Hardware Market, by Type, 2023–2032 (USD Million)
Table 392. Argentina: AI-Driven Battery Management Software and AI Solutions Market, by Type, 2023–2032 (USD Million)
Table 393. Argentina: BMS Core Software Market, by Type, 2023–2032 (USD Million)
Table 394. Argentina: AI/ML Components Market, by Type, 2023–2032 (USD Million)
Table 395. Argentina: AI-Driven Battery Management Services Market, by Type, 2023–2032 (USD Million)
Table 396. Argentina: AI-Driven Battery Management Systems Market, by Application, 2023–2032 (USD Million)
Table 397. Argentina: AI-Driven Battery Management Systems Market for Electric Vehicles, by Type, 2023–2032 (USD Million)
Table 398. Argentina: AI-Driven Battery Management Systems Market for Stationary Energy Storage, by Type, 2023–2032 (USD Million)
Table 399. Argentina: AI-Driven Battery Management Systems Market, by Distribution Channel, 2023–2032 (USD Million)
Table 400. Argentina: AI-Driven Battery Management Systems Market for Direct Channel, by Type, 2023–2032 (USD Million)
Table 401. Argentina: AI-Driven Battery Management Systems Market for Indirect Channel, by Type, 2023–2032 (USD Million)
Table 402. Argentina: AI-Driven Battery Management Systems Market, by End User, 2023–2032 (USD Million)
Table 403. Rest of Latin America: AI-Driven Battery Management Systems Market, by Component, 2023–2032 (USD Million)
Table 404. Rest of Latin America: AI-Driven Battery Management Hardware Systems Market, by Type, 2023–2032 (USD Million)
Table 405. Rest of Latin America: Sensors and Monitoring Systems Market, by Type, 2023–2032 (USD Million)
Table 406. Rest of Latin America: Control Units and Processing Hardware Market, by Type, 2023–2032 (USD Million)
Table 407. Rest of Latin America: AI-Driven Battery Management Software and AI Solutions Market, by Type, 2023–2032 (USD Million)
Table 408. Rest of Latin America: BMS Core Software Market, by Type, 2023–2032 (USD Million)
Table 409. Rest of Latin America: AI/ML Components Market, by Type, 2023–2032 (USD Million)
Table 410. Rest of Latin America: AI-Driven Battery Management Services Market, by Type, 2023–2032 (USD Million)
Table 411. Rest of Latin America: AI-Driven Battery Management Systems Market, by Application, 2023–2032 (USD Million)
Table 412. Rest of Latin America: AI-Driven Battery Management Systems Market for Electric Vehicles, by Type, 2023–2032 (USD Million)
Table 413. Rest of Latin America: AI-Driven Battery Management Systems Market for Stationary Energy Storage, by Type, 2023–2032 (USD Million)
Table 414. Rest of Latin America: AI-Driven Battery Management Systems Market, by Distribution Channel, 2023–2032 (USD Million)
Table 415. Rest of Latin America: AI-Driven Battery Management Systems Market for Direct Channel, by Type, 2023–2032 (USD Million)
Table 416. Rest of Latin America: AI-Driven Battery Management Systems Market for Indirect Channel, by Type, 2023–2032 (USD Million)
Table 417. Rest of Latin America: AI-Driven Battery Management Systems Market, by End User, 2023–2032 (USD Million)
Table 418. Middle East and Africa: AI-Driven Battery Management Systems Market, by Component, 2023–2032 (USD Million)
Table 419. Middle East and Africa: AI-Driven Battery Management Hardware Systems Market, by Type, 2023–2032 (USD Million)
Table 420. Middle East and Africa: Sensors and Monitoring Systems Market, by Type, 2023–2032 (USD Million)
Table 421. Middle East and Africa: Control Units and Processing Hardware Market, by Type, 2023–2032 (USD Million)
Table 422. Middle East and Africa: AI-Driven Battery Management Software and AI Solutions Market, by Type, 2023–2032 (USD Million)
Table 423. Middle East and Africa: BMS Core Software Market, by Type, 2023–2032 (USD Million)
Table 424. Middle East and Africa: AI/ML Components Market, by Type, 2023–2032 (USD Million)
Table 425. Middle East and Africa: AI-Driven Battery Management Services Market, by Type, 2023–2032 (USD Million)
Table 426. Middle East and Africa: AI-Driven Battery Management Systems Market, by Application, 2023–2032 (USD Million)
Table 427. Middle East and Africa: AI-Driven Battery Management Systems Market for Electric Vehicles, by Type, 2023–2032 (USD Million)
Table 428. Middle East and Africa: AI-Driven Battery Management Systems Market for Stationary Energy Storage, by Type, 2023–2032 (USD Million)
Table 429. Middle East and Africa: AI-Driven Battery Management Systems Market, by Distribution Channel, 2023–2032 (USD Million)
Table 430. Middle East and Africa: AI-Driven Battery Management Systems Market for Direct Channel, by Type, 2023–2032 (USD Million)
Table 431. Middle East and Africa: AI-Driven Battery Management Systems Market for Indirect Channel, by Type, 2023–2032 (USD Million)
Table 432. Middle East and Africa: AI-Driven Battery Management Systems Market, by End User, 2023–2032 (USD Million)
Table 433. Saudi Arabia: AI-Driven Battery Management Systems Market, by Component, 2023–2032 (USD Million)
Table 434. Saudi Arabia: AI-Driven Battery Management Hardware Systems Market, by Type, 2023–2032 (USD Million)
Table 435. Saudi Arabia: Sensors and Monitoring Systems Market, by Type, 2023–2032 (USD Million)
Table 436. Saudi Arabia: Control Units and Processing Hardware Market, by Type, 2023–2032 (USD Million)
Table 437. Saudi Arabia: AI-Driven Battery Management Software and AI Solutions Market, by Type, 2023–2032 (USD Million)
Table 438. Saudi Arabia: BMS Core Software Market, by Type, 2023–2032 (USD Million)
Table 439. Saudi Arabia: AI/ML Components Market, by Type, 2023–2032 (USD Million)
Table 440. Saudi Arabia: AI-Driven Battery Management Services Market, by Type, 2023–2032 (USD Million)
Table 441. Saudi Arabia: AI-Driven Battery Management Systems Market, by Application, 2023–2032 (USD Million)
Table 442. Saudi Arabia: AI-Driven Battery Management Systems Market for Electric Vehicles, by Type, 2023–2032 (USD Million)
Table 443. Saudi Arabia: AI-Driven Battery Management Systems Market for Stationary Energy Storage, by Type, 2023–2032 (USD Million)
Table 444. Saudi Arabia: AI-Driven Battery Management Systems Market, by Distribution Channel, 2023–2032 (USD Million)
Table 445. Saudi Arabia: AI-Driven Battery Management Systems Market for Direct Channel, by Type, 2023–2032 (USD Million)
Table 446. Saudi Arabia: AI-Driven Battery Management Systems Market for Indirect Channel, by Type, 2023–2032 (USD Million)
Table 447. Saudi Arabia: AI-Driven Battery Management Systems Market, by End User, 2023–2032 (USD Million)
Table 448. South Africa: AI-Driven Battery Management Systems Market, by Component, 2023–2032 (USD Million)
Table 449. South Africa: AI-Driven Battery Management Hardware Systems Market, by Type, 2023–2032 (USD Million)
Table 450. South Africa: Sensors and Monitoring Systems Market, by Type, 2023–2032 (USD Million)
Table 451. South Africa: Control Units and Processing Hardware Market, by Type, 2023–2032 (USD Million)
Table 452. South Africa: AI-Driven Battery Management Software and AI Solutions Market, by Type, 2023–2032 (USD Million)
Table 453. South Africa: BMS Core Software Market, by Type, 2023–2032 (USD Million)
Table 454. South Africa: AI/ML Components Market, by Type, 2023–2032 (USD Million)
Table 455. South Africa: AI-Driven Battery Management Services Market, by Type, 2023–2032 (USD Million)
Table 456. South Africa: AI-Driven Battery Management Systems Market, by Application, 2023–2032 (USD Million)
Table 457. South Africa: AI-Driven Battery Management Systems Market for Electric Vehicles, by Type, 2023–2032 (USD Million)
Table 458. South Africa: AI-Driven Battery Management Systems Market for Stationary Energy Storage, by Type, 2023–2032 (USD Million)
Table 459. South Africa: AI-Driven Battery Management Systems Market, by Distribution Channel, 2023–2032 (USD Million)
Table 460. South Africa: AI-Driven Battery Management Systems Market for Direct Channel, by Type, 2023–2032 (USD Million)
Table 461. South Africa: AI-Driven Battery Management Systems Market for Indirect Channel, by Type, 2023–2032 (USD Million)
Table 462. South Africa: AI-Driven Battery Management Systems Market, by End User, 2023–2032 (USD Million)
Table 463. United Arab Emirates: AI-Driven Battery Management Systems Market, by Component, 2023–2032 (USD Million)
Table 464. United Arab Emirates: AI-Driven Battery Management Hardware Systems Market, by Type, 2023–2032 (USD Million)
Table 465. United Arab Emirates: Sensors and Monitoring Systems Market, by Type, 2023–2032 (USD Million)
Table 466. United Arab Emirates: Control Units and Processing Hardware Market, by Type, 2023–2032 (USD Million)
Table 467. United Arab Emirates: AI-Driven Battery Management Software and AI Solutions Market, by Type, 2023–2032 (USD Million)
Table 468. United Arab Emirates: BMS Core Software Market, by Type, 2023–2032 (USD Million)
Table 469. United Arab Emirates: AI/ML Components Market, by Type, 2023–2032 (USD Million)
Table 470. United Arab Emirates: AI-Driven Battery Management Services Market, by Type, 2023–2032 (USD Million)
Table 471. United Arab Emirates: AI-Driven Battery Management Systems Market, by Application, 2023–2032 (USD Million)
Table 472. United Arab Emirates: AI-Driven Battery Management Systems Market for Electric Vehicles, by Type, 2023–2032 (USD Million)
Table 473. United Arab Emirates: AI-Driven Battery Management Systems Market for Stationary Energy Storage, by Type, 2023–2032 (USD Million)
Table 474. United Arab Emirates: AI-Driven Battery Management Systems Market, by Distribution Channel, 2023–2032 (USD Million)
Table 475. United Arab Emirates: AI-Driven Battery Management Systems Market for Direct Channel, by Type, 2023–2032 (USD Million)
Table 476. United Arab Emirates: AI-Driven Battery Management Systems Market for Indirect Channel, by Type, 2023–2032 (USD Million)
Table 477. United Arab Emirates: AI-Driven Battery Management Systems Market, by End User, 2023–2032 (USD Million)
Table 478. Rest of Middle East and Africa: AI-Driven Battery Management Systems Market, by Component, 2023–2032 (USD Million)
Table 479. Rest of Middle East and Africa: AI-Driven Battery Management Hardware Systems Market, by Type, 2023–2032 (USD Million)
Table 480. Rest of Middle East and Africa: Sensors and Monitoring Systems Market, by Type, 2023–2032 (USD Million)
Table 481. Rest of Middle East and Africa: Control Units and Processing Hardware Market, by Type, 2023–2032 (USD Million)
Table 482. Rest of Middle East and Africa: AI-Driven Battery Management Software and AI Solutions Market, by Type, 2023–2032 (USD Million)
Table 483. Rest of Middle East and Africa: BMS Core Software Market, by Type, 2023–2032 (USD Million)
Table 484. Rest of Middle East and Africa: AI/ML Components Market, by Type, 2023–2032 (USD Million)
Table 485. Rest of Middle East and Africa: AI-Driven Battery Management Services Market, by Type, 2023–2032 (USD Million)
Table 486. Rest of Middle East and Africa: AI-Driven Battery Management Systems Market, by Application, 2023–2032 (USD Million)
Table 487. Rest of Middle East and Africa: AI-Driven Battery Management Systems Market for Electric Vehicles, by Type, 2023–2032 (USD Million)
Table 488. Rest of Middle East and Africa: AI-Driven Battery Management Systems Market for Stationary Energy Storage, by Type, 2023–2032 (USD Million)
Table 489. Rest of Middle East and Africa: AI-Driven Battery Management Systems Market, by Distribution Channel, 2023–2032 (USD Million)
Table 490. Rest of Middle East and Africa: AI-Driven Battery Management Systems Market for Direct Channel, by Type, 2023–2032 (USD Million)
Table 491. Rest of Middle East and Africa: AI-Driven Battery Management Systems Market for Indirect Channel, by Type, 2023–2032 (USD Million)
Table 492. Rest of Middle East and Africa: AI-Driven Battery Management Systems Market, by End User, 2023–2032 (USD Million)
Table 493. Recent Developments, by Company (2021–2025)
List of Figures
Figure 1. Research Process
Figure 2. Secondary Components Referenced for this Study
Figure 3. Primary Research Techniques
Figure 4. Key Executives Interviewed
Figure 5. Breakdown of Primary Interviews (Supply Side & Demand Side)
Figure 6. Market Sizing and Growth Forecast Approach
Figure 7. In 2025, the AI-Driven Battery Management Software and AI Solutions Segment to Account for the Largest Share
Figure 8. In 2025, the AI-Driven Battery Management System Market for Electric Vehicles to Account for the Largest Share
Figure 9. In 2025, the AI-Driven Battery Management System Market for Direct Channel to Account for the Largest Share
Figure 10. The data centers End User Segment to Register the Highest growth rate During 2025–2032
Figure 11. Asia-Pacific to be the Fastest-growing Regional Market
Figure 12. Impact Analysis of Market Dynamics
Figure 13. Global AI-Driven Battery Management System Market: Porter's Five Forces Analysis
Figure 14. Global AI-Driven Battery Management System Market, by Component, 2025 Vs. 2032 (USD Million)
Figure 15. Global AI-Driven Battery Management System Market, by Application, 2025 Vs. 2032 (USD Million)
Figure 16. Global AI-Driven Battery Management System Market, by Distribution Channel, 2025 Vs. 2032 (USD Million)
Figure 17. Global AI-Driven Battery Management System Market, by End User, 2025 Vs. 2032 (USD Million)
Figure 18. Global AI-Driven Battery Management System Market, by Region, 2025 Vs. 2032 (USD Million)
Figure 19. North America: AI-Driven Battery Management System Market Snapshot (2025)
Figure 20. Europe: AI-Driven Battery Management System Market Snapshot (2025)
Figure 21. Asia-Pacific: AI-Driven Battery Management System Market Snapshot (2025)
Figure 22. Latin America: AI-Driven Battery Management System Market Snapshot (2025)
Figure 23. Middle East and Africa: AI-Driven Battery Management System Market Snapshot (2025)
Figure 24. Key Growth Strategies Adopted by Leading Players (2022–2025)
Figure 25. Global AI-Driven Battery Management System Market: Competitive Benchmarking, by Component
Figure 26. Competitive Dashboard: Global AI-Driven Battery Management System Market
Figure 27. Global AI-Driven Battery Management System Market Share/Ranking, by Key Player, 2024 (%)
Figure 28. CATL (Contemporary Amperex Technology Co., Limited): Financial Overview (2024)
Figure 29. LG Energy Solution, Ltd.: Financial Overview (2024)
Figure 30. Panasonic Holdings Corporation: Financial Overview (2024)
Figure 31. Tesla, Inc.: Financial Overview (2024)
Figure 32. Samsung SDI Co., Ltd.: Financial Overview (2024)


Published Date: Jun-2023
Published Date: Oct-2025
Subscribe to get the latest industry updates