Resources
About Us
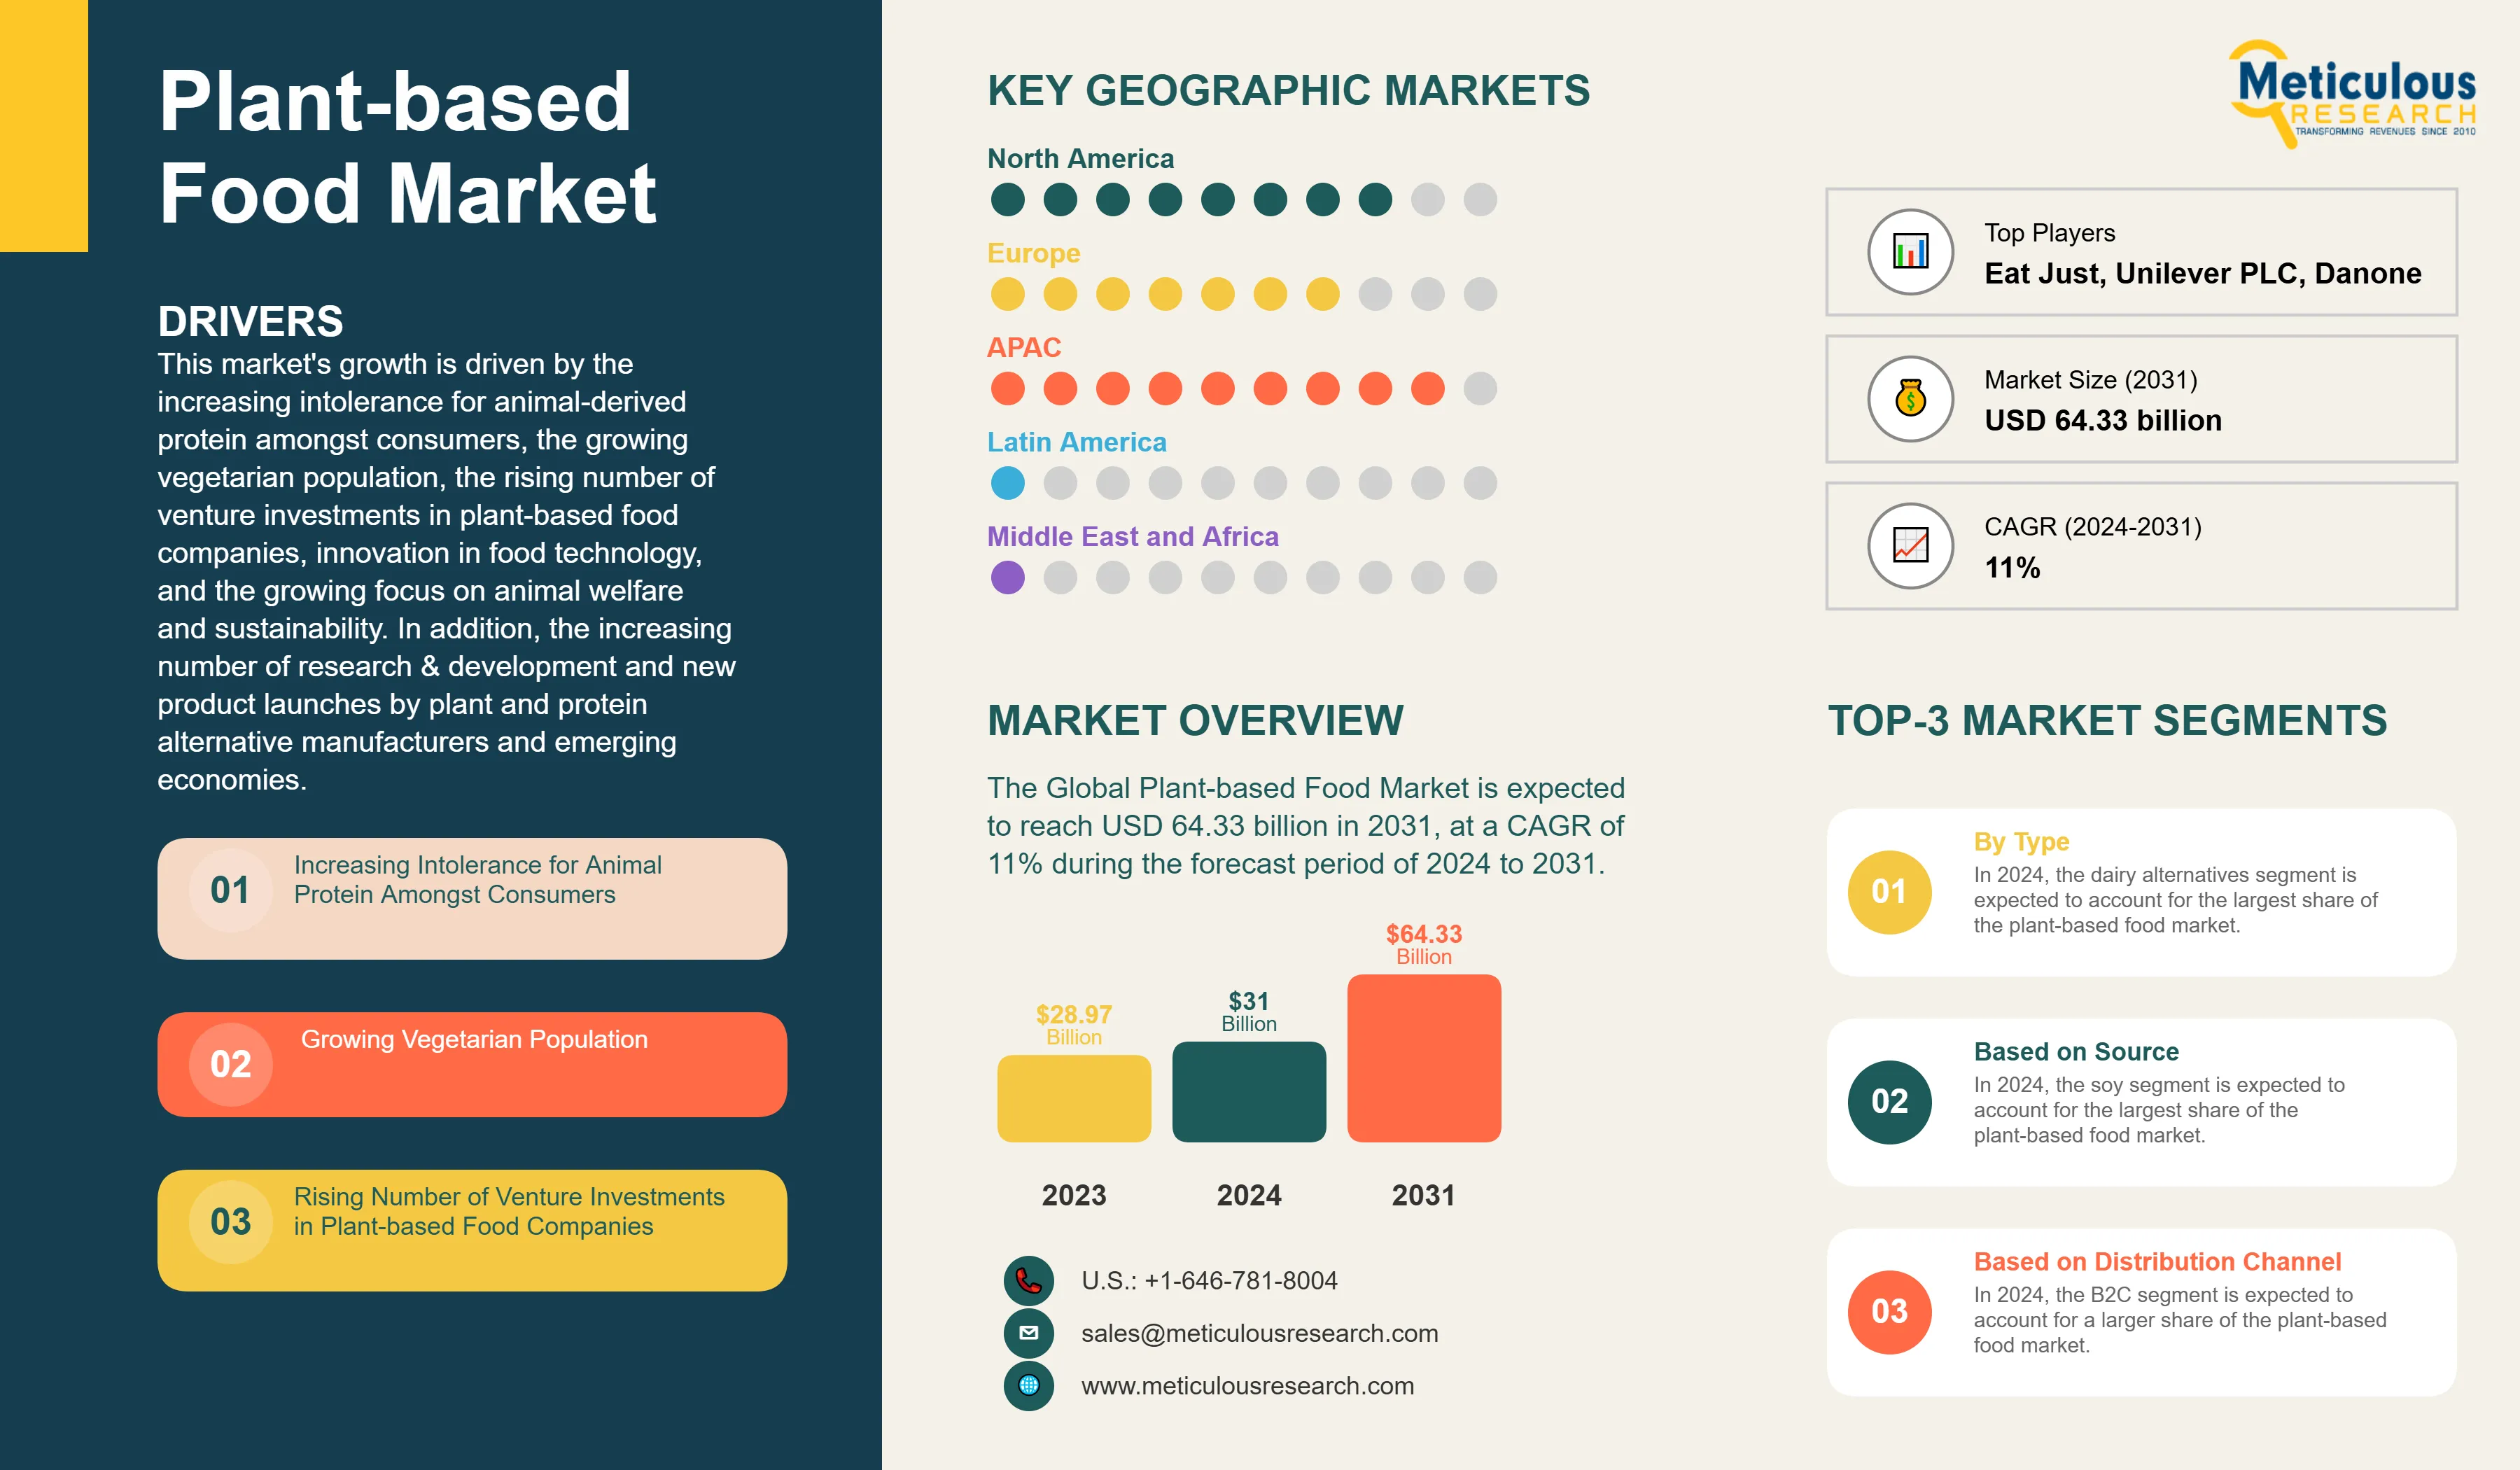
The global plant-based food market was valued at USD 31 billion in 2025. This market is expected to reach USD 93.95 billion by 2036 from USD 34.29 billion in 2026, at a CAGR of 10.6% from 2026 to 2036.
This growth of the overall plant-based food market is driven by the increasing intolerance for animal-derived protein among consumers, the growing vegetarian and flexitarian population, the rising number of venture investments in plant-based food companies, innovation in food technology, and the growing focus on animal welfare and sustainability. In addition, the increasing number of research and development activities and new product launches by plant and protein alternative manufacturers, combined with the expanding opportunities in emerging economies such as Asia-Pacific, Latin America, and the Middle East & Africa, are expected to create lucrative growth avenues for market players. However, factors such as the comparatively higher price range of plant-based meat substitutes, significant consumer preference for animal-based products, and evolving consumer preferences around soy and gluten content are expected to restrain market growth to a notable extent.
Click here to: Get Free Sample Pages of this Report
Plant-based foods encompass a wide spectrum of products designed to replicate or supplement the taste, texture, and nutritional profile of conventional animal-based foods, including dairy alternatives such as plant-based milks, cheeses, yogurts, butters, and ice creams; meat substitutes including tofu, textured vegetable protein, tempeh, burger patties, sausages, meatballs, and seitan; egg substitutes; plant-based seafood alternatives; plant-based meals, baked goods, confectionery, and beverages. The market is characterized by the presence of a growing number of purpose-built plant-based food companies as well as major multinational food corporations that have established dedicated plant-based divisions or acquired plant-based brands.
The key drivers of long-term growth of this market are well-established and mutually reinforcing. The global prevalence of lactose intolerance, affecting an estimated 68% of the world's population, creates a large addressable market for dairy alternatives. The growing vegetarian and vegan population, particularly in Western Europe, North America, and urban Asia-Pacific markets, drives demand across all plant-based food categories. The expanding flexitarian movement, defined by a predominantly plant-based diet with occasional consumption of animal products, represents perhaps the most commercially significant consumer shift, as it expands the addressable market beyond committed vegans and vegetarians to encompass health-conscious mainstream consumers seeking to reduce their animal protein intake without fully eliminating it.
The key players profiled in the plant-based food market include Beyond Meat, Inc. (U.S.), Impossible Foods Inc. (U.S.), Danone S.A. (France), Nestlé S.A. (Switzerland), Unilever PLC (U.K.), Oatly Group AB (Sweden), Amy’s Kitchen Inc. (U.S.), Daiya Foods Inc. (Canada), Earth’s Own Food Company Inc. (Canada), Lightlife Foods, Inc. (U.S.), Atlantic Natural Foods LLC (U.S.), Eat Just, Inc. (U.S.), Miyoko’s Creamery (U.S.), Tofurky (U.S.), Field Roast (U.S.), Good Catch Foods (U.S.), Sahmyook Foods (South Korea), and Plamil Foods Ltd. (U.K.), among others. These companies compete across multiple product categories, including plant-based meat, dairy alternatives, egg substitutes, seafood alternatives, and ready-to-eat plant-based meals, leveraging product innovation, brand positioning, distribution expansion, and strategic partnerships to strengthen their market presence.
Focus on New Product Launches by Plant-based Food Manufacturers
Plant-based products are trending strongly and have marked serious growth in vegan product development across multiple food categories. Companies throughout the food value chain are looking to generate growth through innovation and product development in plant-based offerings, both within their legacy brands and through new product lines. The breadth of recent launches shows the continued maturation and diversification of the plant-based food category. In January 2026, Califia Farms, LLC (U.S.) expanded its portfolio with the launch of Simple & Organic Soymilk, its first soymilk offering, alongside new Simple & Organic creamer variants, signaling ongoing innovation within dairy alternatives. In the same month, Eat Just, Inc. (U.S.) launched JUST Egg in Germany, marking its entry into the European retail market and reflecting the geographic expansion of plant-based egg substitutes. Throughout 2025, Oatly Group AB (Sweden) introduced new oat-based beverage variants, including a matcha latte format and a protein-enhanced oat drink positioned for functional and sports-nutrition consumers. Similarly, in September 2025, Impossible Foods Inc. (U.S.) launched a Hispanic-style plant-based ground meat product tailored for culturally specific culinary applications, demonstrating increasing localization of plant-based innovation. Additionally, in August 2025, Nestlé S.A. (Switzerland) expanded its plant-based ready-meal offerings under its Sweet Earth and Garden Gourmet brands across major retail channels, reinforcing the movement of this category into convenient frozen and prepared formats.
Collectively, these launches reflect a strategic shift toward product diversification beyond traditional burger and sausage analogs, with manufacturers targeting beverages, ready meals, regional cuisine formats, and functional nutrition applications. The focus on geographic expansion, culinary versatility, and improved functional performance shows the transition of the plant-based food market from early-stage novelty to mainstream category integration.
Surge in Venture Investments in Plant-based Food Companies
In recent years, the plant-based foods industry has continued to attract strategic and venture investment, although capital deployment patterns have evolved toward more disciplined and performance-driven funding. While the broader alternative protein sector experienced record inflows earlier in the decade, recent funding activity has shifted toward companies demonstrating scalable manufacturing models, differentiated technology platforms, and clearer pathways to profitability.
|
Report Coverage |
Details |
|
Market Size by 2036 |
USD 93.95 Billion |
|
Market Size in 2025 |
USD 31 Billion |
|
Market Size in 2026 |
USD 34.29 Billion |
|
Revenue CAGR (2026–2036) |
10.6% |
|
Largest Type Segment (2025) |
Dairy Alternatives |
|
Fastest Growing Type Segment |
Egg Substitutes |
|
Largest Source Segment (2025) |
Soy |
|
Fastest Growing Source Segment |
Pea |
|
Largest Distribution Channel (2025) |
Business-to-Consumer (B2C) |
|
Largest Geography (2025) |
Asia-Pacific |
|
Fastest Growing Geography |
Asia-Pacific |
|
Base Year |
2025 |
|
Forecast Period |
2026–2036 |
|
Segments Covered |
By Type, Source, Distribution Channel, and Geography |
|
Geographies Covered |
North America, Europe, Asia-Pacific, Latin America, and Middle East & Africa |
Dairy Alternatives Segment to Dominate the Plant-based Food Market in 2026
Based on type, the plant-based food market is segmented into dairy alternatives, meat substitutes, plant-based meals, plant-based baked goods, plant-based confectionery, plant-based beverages, egg substitutes, fish and seafood alternatives, and other plant-based foods. In 2026, the dairy alternatives segment is expected to account for the largest share of the global plant-based food market. The large market share of this segment is attributed to the increasing number of lactose-intolerant consumers globally, growing ethical concerns about animal welfare in modern dairy farming practices, and the extensive nutritional benefits offered by plant-based dairy products. Plant-based milks, including almond, oat, soy, pea, coconut, and rice milk, have achieved significant penetration in key markets such as the U.S., U.K., Germany, the Netherlands, and Australia, where they are now mainstream retail offerings across all major grocery chains. Plant-based cheese, yogurt, butter, ice cream, and creamer categories are growing rapidly from smaller bases as formulation technology improves taste and texture parity with conventional dairy.
However, the egg substitutes segment is expected to grow at the fastest CAGR during the forecast period. The rapid growth of this segment is attributed to increasing consumer demand for egg alternatives driven by concerns about cholesterol, avian influenza-related supply disruptions, and animal welfare, combined with rising investments and food innovations in liquid and powder egg substitute products, and the introduction of products such as Nestle's Garden Gourmet vEGGie and Eat Just's JUST Egg.
Soy Segment to Dominate in 2026; Pea Segment to Register Highest CAGR
Based on source, the plant-based food market is segmented into soy, almond, wheat, pea, rice, oat, and other sources. In 2026, the soy segment is expected to account for the largest share of the global plant-based food market. The largest share of this segment is attributed to the easy and wide availability of soy as a raw material, its lower cost relative to most other plant protein sources, significant demand from meat alternatives manufacturers, higher consumer acceptance levels built over decades of use in tofu and soy milk, and its wide range of applications across numerous food and beverage sectors including meat alternatives, dairy alternatives, and bakery applications. Soy protein provides a complete amino acid profile comparable to animal proteins, making it a nutritionally superior plant protein source for formulating high-protein plant-based products.
However, the pea segment is expected to grow at the fastest CAGR during the forecast period. The rapid growth of pea protein market is attributed to increasing consumer desire for sustainable, allergen-free, and good-tasting alternatives to animal-based proteins, rising investments from leading manufacturers to increase pea protein production and processing capacity, and the growing adoption of pea protein in premium plant-based meat and dairy alternative products.
B2C Segment to Account for the Largest Share and Highest CAGR During the Forecast Period
Based on distribution channel, the plant-based food market is segmented into business-to-business (B2B) and business-to-consumer (B2C). In 2025, the B2C segment is expected to account for the largest share of the global plant-based food market. The large share of this segment is attributed to the increased sales of plant-based food in well-established supermarkets and hypermarket chains, consumer preference for shopping from brick-and-mortar grocery retailers due to easy access and wide product availability, and increasing consumer spending on vegan and plant-based food products across income groups. The placement of plant-based products within mainstream grocery retail, rather than in specialty health food sections, has been a key driver of the growth of this market, enabling plant-based foods to reach flexitarian and mainstream consumers.
Additionally, the B2C segment is expected to grow at the fastest CAGR during the forecast period, driven primarily by the rapidly growing online retail sector. Online retail offers plant-based food brands the ability to reach consumers directly with a wider product assortment than is typically stocked in physical retail, to build direct relationships with health-conscious consumers through subscription and loyalty models, and to access geographies where physical retail distribution of plant-based products remains limited. The B2B segment, encompassing food service operators, institutional caterers, food manufacturers using plant-based ingredients, and specialty wholesale channels, also represents an important and growing distribution channel as food service chains, restaurant operators, and catering companies increasingly incorporate plant-based menu options.
Asia-Pacific to Dominate and Register the Highest CAGR During the Forecast Period
Based on geography, in 2026, the Asia-Pacific is expected to account for the largest share of the global plant-based food market and is also expected to grow at the highest CAGR during the forecast period. This is primarily attributed to factors such as collaborations between international and domestic food companies, increasing protein-rich diet awareness among urban consumer segments, the booming food and beverage industry driven by economic development and rising disposable incomes, rapid urbanization, and the existence of a large traditional base of vegetarian and plant-forward consumers, mainly in India, Southeast Asia, and China.
North America is the second-largest regional market, driven by the U.S. and Canada, where plant-based food products have achieved significant mainstream penetration across retail and food service channels, and where some of the world's leading plant-based food companies are headquartered.
Europe is another major and growing market, with particularly strong adoption in Germany, the U.K., the Netherlands, France, and Scandinavia, driven by favorable regulatory frameworks, strong environmental consciousness among consumers, and cultural openness to diverse plant-based food formats.
Latin America and the Middle East & Africa are earlier-stage but high-growth markets, with significant expansion opportunities with the rising middle-class incomes, urbanization, and the expansion of modern retail formats.
The global plant-based food market is highly competitive and increasingly consolidated at the top tier, characterized by the presence of dedicated plant-based innovators alongside diversified multinational food corporations with established alternative protein portfolios. Competitive intensity is driven by continuous product innovation, formulation improvements to enhance taste and texture, pricing strategies aimed at narrowing the cost gap with animal-based products, expansion across retail and foodservice channels, and investment in brand building and supply chain optimization.
The competitive landscape includes pure-play plant-based leaders such as Beyond Meat, Inc. (U.S.), Impossible Foods Inc. (U.S.), Eat Just, Inc. (U.S.), and Oatly Group AB (Sweden). These companies compete primarily through proprietary ingredient technologies, strong brand positioning in meat and dairy alternatives, and aggressive category expansion across global markets. Emerging European innovators such as Planted Foods AG (Switzerland) are strengthening competition in the whole-cut plant protein segment, particularly within foodservice and premium retail channels.
Diversified multinational food corporations such as Nestlé S.A. (Switzerland), Unilever PLC (U.K.), and Danone S.A. (France) maintain substantial plant-based portfolios alongside conventional product lines. Their competitive advantages stem from global manufacturing infrastructure, distribution scale, cross-category brand leverage, and significant R&D capabilities. Additional major food companies with meaningful plant-based operations include Conagra Brands, Inc. (U.S.) (owner of Gardein), Kraft Heinz Company (U.S.) (BOCA and related offerings), and Tyson Foods, Inc. (U.S.).
The category-specific players include Miyoko’s Creamery (U.S.) in premium plant-based dairy alternatives, Good Catch Foods (U.S.) in plant-based seafood, and Daiya Foods Inc. (Canada) and Lightlife Foods, Inc. (U.S.) in cheese and meat analogues. Other regional players such as Amy’s Kitchen Inc. (U.S.), The Hain Celestial Group, Inc. (U.S.), Earth’s Own Food Company Inc. (Canada), Taifun-Tofu GmbH (Germany), Sanitarium Health and Wellbeing Company (Australia), and Sahmyook Foods (South Korea) compete through strong regional brand recognition and specialization in soy-based, ready-to-eat, or dairy-alternative categories.
Plant-based Food Market Assessment, by Type
Plant-based Food Market Assessment, by Source
Plant-based Food Market Assessment, by Distribution Channel
Plant-based Food Market Assessment, by Geography
The report provides a comprehensive assessment of the global plant-based food market based on type, source, distribution channel, and geography. It includes market size estimates and forecasts, segment-level value analysis, competitive landscape evaluation, and detailed assessment of key growth drivers, restraints, opportunities, and emerging trends across major regions.
The global plant-based food market is estimated to reach USD 34.29 billion in 2026. The market is projected to reach USD 93.95 billion by 2036, growing at a CAGR of 10.6% from 2026 to 2036.
Based on type, the dairy alternatives segment is expected to account for the largest share of the global plant-based food market in 2026, driven by strong consumer adoption of plant-based milk, yogurt, cheese, and creamers across retail and foodservice channels.
The egg substitutes segment is projected to register the highest CAGR during the forecast period (2026–2036), driven by rising demand for allergen-free, cholesterol-free alternatives and expanding applications in bakery, foodservice, and ready-to-eat products.
Based on source, the soy segment is expected to account for the largest share of the market in 2026, owing to its established supply chain, cost efficiency, and widespread use in dairy alternatives and meat analogues.
The business-to-consumer (B2C) segment is projected to register the highest CAGR during 2026–2036, driven by the rapid expansion of modern retail formats, private-label penetration, and the sustained growth of online grocery platforms.
Market growth is driven by increasing consumer preference for plant-based diets, growing health awareness, rising environmental and sustainability concerns, innovation in food technology (including improved taste and texture), and continued strategic investment in product development and manufacturing efficiency. Expanding middle-class populations and urbanization in emerging markets further create long-term growth opportunities.
Asia-Pacific is projected to register the highest CAGR during the forecast period, driven by rapid urbanization, increasing disposable incomes, strong soy-based food traditions, rising investment in alternative protein manufacturing, and growing adoption of modern retail channels.
Key companies profiled in the plant-based food market include Beyond Meat, Inc. (U.S.); Impossible Foods Inc. (U.S.); Eat Just, Inc. (U.S.); Oatly Group AB (Sweden); Nestlé S.A. (Switzerland); Unilever PLC (U.K.); Danone S.A. (France); Conagra Brands, Inc. (U.S.); Kraft Heinz Company (U.S.); Planted Foods AG (Switzerland); Miyoko’s Creamery (U.S.); Good Catch Foods (U.S.); Amy’s Kitchen Inc. (U.S.); The Hain Celestial Group, Inc. (U.S.); Daiya Foods Inc. (Canada); Lightlife Foods, Inc. (U.S.); Earth’s Own Food Company Inc. (Canada); Taifun-Tofu GmbH (Germany); Sanitarium Health and Wellbeing Company (Australia); and Sahmyook Foods (South Korea), among others.
1. Introduction
1.1. Market Definition
1.2. Market Scope
1.3. Market Ecosystem Analysis
1.4. Currency Considered
1.5. Limitations of the Study
1.6. Key Stakeholders
2. Research Methodology
2.1. Research Approach
2.2. Data Collection and Validation
2.2.1. Secondary Research
2.2.2. Primary Research and Expert Interviews
2.3. Market Assessment Framework
2.3.1. Market Size Estimation
2.3.2. Bottom-Up Approach
2.3.3. Top-Down Approach
2.3.4. Growth Forecast Modeling
2.4. Assumptions for the Study
3. Executive Summary
3.1. Market Overview
3.2. Market Analysis, by Type
3.3. Market Analysis, by Source
3.4. Market Analysis, by Distribution Channel
3.5. Market Analysis, by Geography
3.6. Competitive Landscape Snapshot
4. Market Insights
4.1. Overview
4.2. Impact Analysis of Market Drivers (2026–2036)
4.2.1. Increasing Adoption of Plant-based Diets and Rising Flexitarian Population
4.2.2. Growing Environmental Sustainability and Animal Welfare Concerns
4.2.3. Rising Investments and Innovation Across the Alternative Protein Value Chain
4.2.4. Expanding Retail and Foodservice Distribution Networks
4.3. Impact Analysis of Market Restraints (2026–2036)
4.3.1. Price Premium Over Conventional Animal-based Products
4.3.2. Taste, Texture, and Consumer Perception Challenges
4.3.3. Supply Chain Volatility and Raw Material Constraints
4.4. Impact Analysis of Market Opportunities (2026–2036)
4.4.1. Expansion in Emerging Economies
4.4.2. Product Innovation in Egg and Seafood Alternatives
4.4.3. Advancements in Food Processing and Ingredient Technologies
4.4.4. Growth of Private-label and Institutional Procurement
4.5. Impact Analysis of Key Market Trends (2026–2036)
4.5.1. Clean Label and Minimal Ingredient Formulations
4.5.2. Whole-cut and Premium Meat Alternatives
4.5.3. Integration of Precision Fermentation and Novel Protein Technologies
4.5.4. Price Parity and Cost Optimization Strategies
4.6. Value Chain Analysis
4.6.1. Raw Material Suppliers (Soy, Pea, Oat, Almond, etc.)
4.6.2. Ingredient Processors
4.6.3. Manufacturers
4.6.4. Distributors and Retailers
4.6.5. Foodservice Operators
4.6.6. End Consumers
4.7. Porter’s Five Forces Analysis
4.7.1. Threat of New Entrants
4.7.2. Bargaining Power of Suppliers
4.7.3. Bargaining Power of Buyers
4.7.4. Threat of Substitutes
4.7.5. Competitive Rivalry
5. Plant-based Food Market Assessment, by Type
5.1. Overview
5.2. Dairy Alternatives
5.2.1. Milk
5.2.2. Cheese
5.2.3. Yogurt
5.2.4. Butter
5.2.5. Ice Cream
5.2.6. Creamer
5.2.7. Other Dairy Alternatives
5.3. Meat Substitutes
5.3.1. Tofu
5.3.2. Textured Vegetable Protein (TVP)
5.3.3. Burger Patties
5.3.4. Hot Dogs & Sausages
5.3.5. Ground Meat
5.3.6. Nuggets
5.3.7. Crumbles
5.3.8. Tempeh
5.3.9. Seitan
5.3.10. Meatballs
5.3.11. Shreds
5.3.12. Other Meat Substitutes
5.4. Egg Substitutes
5.5. Fish and Seafood Alternatives
5.6. Plant-based Meals
5.7. Plant-based Beverages
5.8. Plant-based Baked Goods
5.9. Plant-based Confectionery
5.10. Other Plant-based Foods
6. Plant-based Food Market Assessment, by Source
6.1. Overview
6.2. Soy
6.3. Pea
6.4. Almond
6.5. Oat
6.6. Wheat
6.7. Rice
6.8. Other Sources
7. Plant-based Food Market Assessment, by Distribution Channel
7.1. Overview
7.2. Business-to-Business (B2B)
7.2.1. Foodservice
7.2.2. Institutional Buyers
7.2.3. Private-label Manufacturing
7.3. Business-to-Consumer (B2C)
7.3.1. Supermarkets & Hypermarkets
7.3.2. Convenience Stores
7.3.3. Specialty Stores
7.3.4. Online Retail
7.3.5. Other Retail Formats
8. Plant-based Food Market Assessment, by Geography
8.1. Overview
8.2. North America
8.2.1. U.S.
8.2.2. Canada
8.3. Europe
8.3.1. Germany
8.3.2. U.K.
8.3.3. France
8.3.4. Italy
8.3.5. Spain
8.3.6. Netherlands
8.3.7. Belgium
8.3.8. Austria
8.3.9. Poland
8.3.10. Portugal
8.3.11. Rest of Europe
8.4. Asia-Pacific
8.4.1. China
8.4.2. India
8.4.3. Japan
8.4.4. Australia
8.4.5. Thailand
8.4.6. South Korea
8.4.7. Rest of Asia-Pacific
8.5. Latin America
8.5.1. Brazil
8.5.2. Mexico
8.5.3. Argentina
8.5.4. Rest of Latin America
8.6. Middle East & Africa
9. Competitive Landscape
9.1. Overview
9.2. Key Growth Strategies Adopted by Leading Players (2023–2026)
9.3. Competitive Benchmarking, by Type
9.4. Competitive Positioning Matrix
9.5. Market Share Analysis (2025)
9.6. Recent Strategic Developments
10. Company Profiles
(Business Overview, Financial Overview, Product Portfolio, Strategic Developments, SWOT Analysis)
10.1. Beyond Meat, Inc. (U.S.)
10.2. Impossible Foods Inc. (U.S.)
10.3. Oatly Group AB (Sweden)
10.4. Danone S.A. (France)
10.5. Nestlé S.A. (Switzerland)
10.6. Unilever PLC (U.K.)
10.7. Conagra Brands, Inc. (U.S.)
10.8. Kraft Heinz Company (U.S.)
10.9. Eat Just, Inc. (U.S.)
10.10. Planted Foods AG (Switzerland)
10.11. Miyoko’s Creamery (U.S.)
10.12. Good Catch Foods (U.S.)
10.13. The Hain Celestial Group, Inc. (U.S.)
10.14. Amy’s Kitchen Inc. (U.S.)
10.15. Daiya Foods Inc. (Canada)
10.16. Lightlife Foods, Inc. (U.S.)
10.17. Earth’s Own Food Company Inc. (Canada)
10.18. Taifun-Tofu GmbH (Germany)
10.19. Sanitarium Health and Wellbeing Company (Australia)
10.20. Sahmyook Foods (South Korea)
10.21. Other Key Players
11. Appendix
11.1. Available Customization
11.2. Related Reports


Published Date: Mar-2026
Published Date: Jan-2025
Published Date: Jan-2025
Published Date: Jan-2025
Published Date: Jan-2025
Subscribe to get the latest industry updates