Resources
About Us
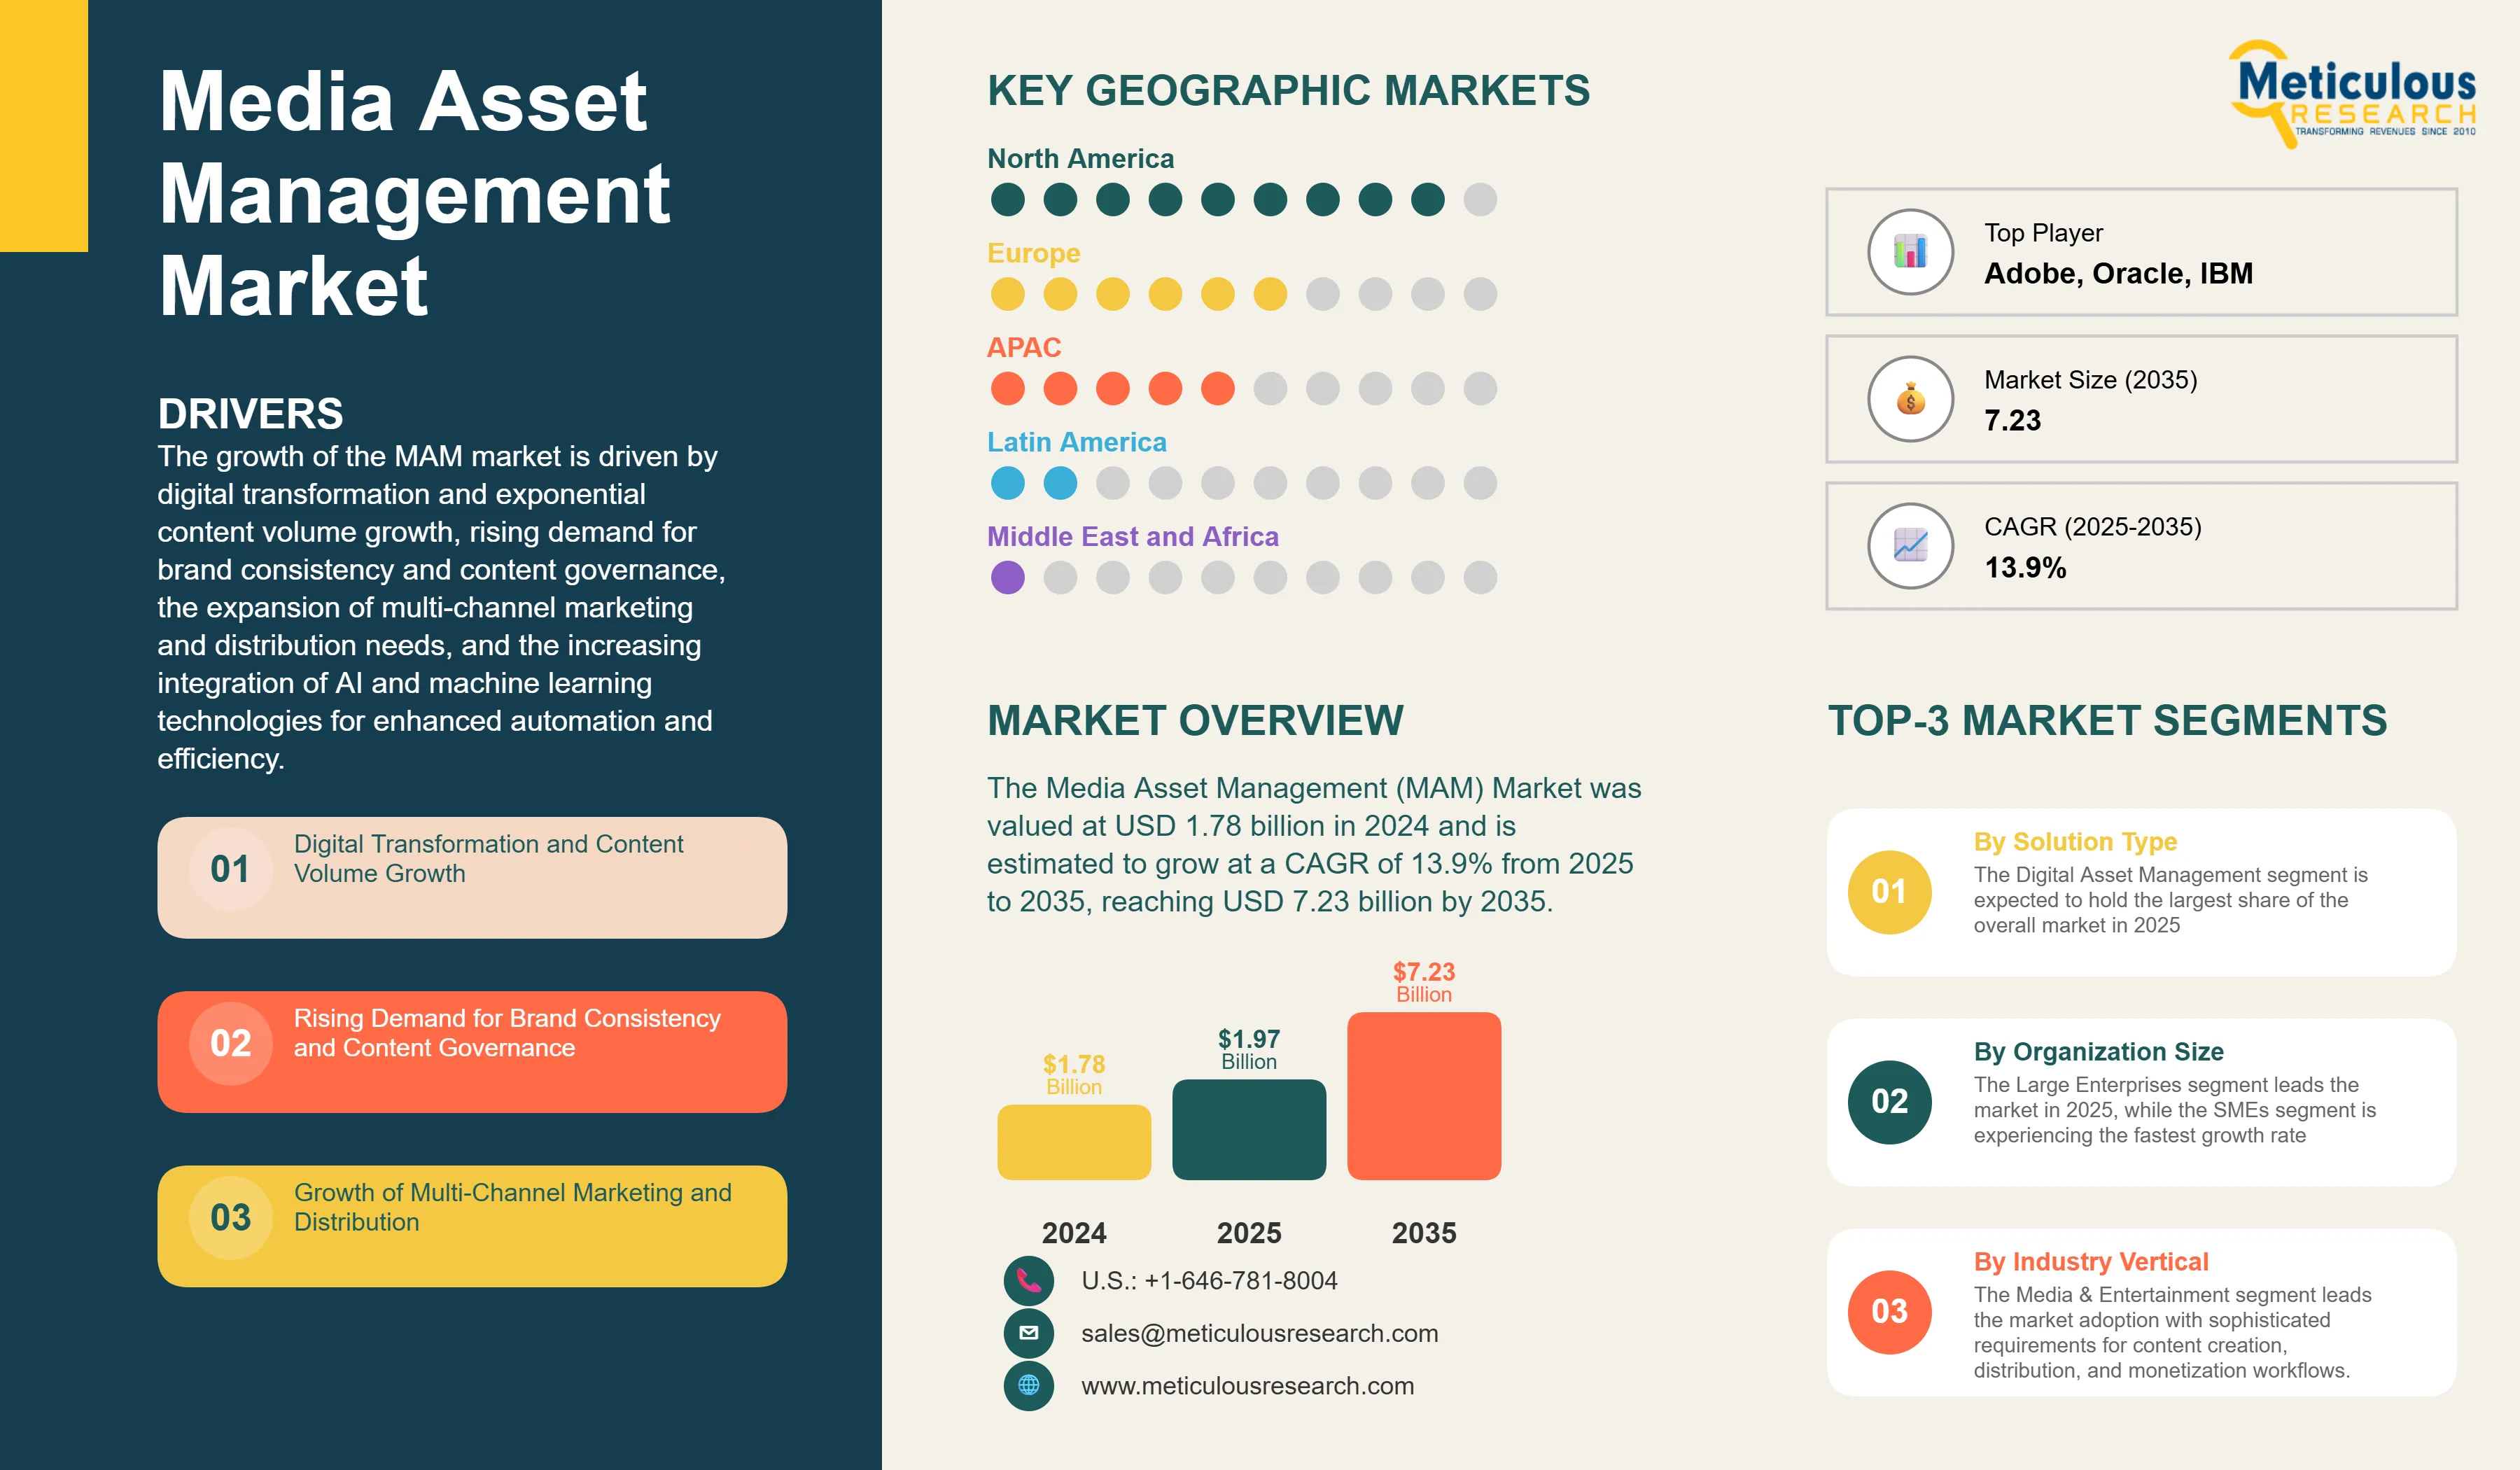
The Media Asset Management industry continues to expand rapidly as organizations across diverse sectors increasingly recognize the critical importance of efficient digital content management throughout their operational workflows. As global digital content creation continues to expand significantly, the demand for advanced Media Asset Management (MAM) solutions—spanning digital asset management, workflow automation, AI-powered metadata tagging, and brand governance—is driving notable momentum in the market.
For instance, the stringent compliance requirements in healthcare and financial services industries, combined with expanding remote work environments, are fueling adoption of cloud-based MAM platforms with advanced security and collaboration capabilities. Recent regulatory guidelines requiring enhanced content governance for pharmaceutical marketing materials and financial communications have created new compliance-driven demand for Brand Management & Compliance solutions and automated workflow systems.
The industry is experiencing significant technological transformation through AI integration, cloud-native architectures, and multi-channel distribution capabilities. Leading MAM providers are investing heavily in machine learning-powered content intelligence, automated metadata generation, and seamless integration with marketing technology stacks to improve content ROI, reduce time-to-market, and enhance brand consistency. These technological advances are enabling organizations to manage increasingly complex digital asset libraries while maintaining cost-effectiveness and achieving better operational efficiency.
 Media Asset Management Market Trends
Digital Asset Management (DAM) Solution Type Projected to Showcase the Fastest Growth During the Forecast Period
Digital Asset Management technology is projected to show significant growth during the forecast period, holding the large share of the total Media Asset Management market. These solutions include comprehensive asset storage, advanced search capabilities, version control systems, and rights management platforms that provide centralized content governance for marketing campaigns, brand management, and multi-channel distribution applications.
The growth in Digital Asset Management solutions is driven by the increasing demand for centralized content repositories, as a significant number of enterprise organizations seek advanced capabilities for organizing and retrieving digital assets. This segment requires robust, scalable platforms that can effectively manage diverse media types including images, videos, documents, and 3D assets without compromising performance or security. Industry data shows that comprehensive DAM implementations reduce content creation costs through improved asset reuse and streamlined approval workflows.
Leading Media Asset Management providers have notably enhanced their Digital Asset Management capabilities in recent years. Moreover, many expanded their cloud infrastructure to address rising demand from the media & entertainment and marketing sectors. The integration of AI-powered search technologies and automated content classification is enabling DAM solutions to provide more intelligent asset discovery while maintaining enterprise-grade security and compliance standards.
Asia-Pacific Region to Exhibit the Highest Growth During the Forecast Period
The Asia-Pacific region is estimated to show remarkable growth during the forecast period, driven by rapid digital transformation, expanding e-commerce infrastructure, and growing investment in content marketing strategies. Countries like China, India, and Japan are experiencing unprecedented demand for MAM solutions as digital advertising spend and video content production continue to expand across temperature-sensitive marketing campaigns.
China leads the region with the largest market share in digital marketing technology adoption, representing the highest share of global content creation investment. The country's MAM market is projected to grow at the highest CAGR through 2035, driven by government initiatives supporting digital economy development and expanding entertainment industry exports. India follows closely with significant investments in digital infrastructure and growing startup ecosystem requiring sophisticated content management capabilities.
Rapid digital transformation and the growth of e-commerce are driving the need for large investments in technology infrastructure to handle more data, storage, and content delivery. At the same time, competition in emerging markets is pushing companies to form strategic partnerships to share costs, combine strengths, and expand more quickly. As a result, both infrastructure investment and building partnership networks have become necessary responses to these market trends.
Media Asset Management Market Analysis
The Media Asset Management industry faces challenges from integration complexity with existing marketing technology stacks, data governance requirements across different regulatory environments, and scalability concerns related to growing content volumes. High implementation costs of enterprise-grade MAM platforms and limited technical expertise in emerging markets create adoption barriers, requiring vendors to balance advanced functionality with user-friendly interfaces and cost-effective deployment options.
Despite these constraints, the market offers substantial growth opportunities through AI and machine learning integration, expansion in small and medium enterprises, and development of industry-specific MAM solutions. The adoption of cloud-native architectures and API-first platforms is helping organizations achieve better content workflow automation while improving collaboration and reducing operational overhead. Regulatory requirements supporting data privacy and content governance provide stable demand drivers for comprehensive MAM technologies.
Based on solution type, the Media Asset Management market is segmented into Digital Asset Management (images, video, audio, 3D, documents), Workflow & Collaboration Tools, Metadata & AI/ML Tagging & Analytics, Brand Management & Compliance, and Others. The Digital Asset Management segment is expected to hold the largest share of the overall market in 2025 and is expected to grow at a robust CAGR through 2035. This segment represents the core foundation of MAM solutions, experiencing strong growth driven by exploding content volumes and need for centralized governance. In addition, this segment benefits from AI-powered auto-tagging, advanced search functionality, and seamless integration with creative workflows. The growing dominance of video content across the internet is a key factor driving increased demand for advanced video asset management capabilities.
Based on deployment model, the market is segmented into Cloud-based Solutions (Public Cloud, Private Cloud, Hybrid Cloud), On-premises Solutions, and Software-as-a-Service (SaaS). The Cloud-based segment is expected to grow at the highest CAGR through 2035, driven by scalability advantages and reduced infrastructure costs. Public cloud deployments lead adoption among SMEs seeking cost-effective solutions, while private cloud serves enterprises with strict security requirements. Hybrid cloud models provide optimal balance of security and flexibility, supporting organizations with complex compliance needs. Cloud solutions offer automatic updates, global accessibility, and seamless scalability that traditional on-premises systems cannot match.
Based on organization size, the market serves Large Enterprises and Small and Medium Enterprises (SMEs). The Large Enterprises segment leads the market in 2025, while the SMEs segment is experiencing the fastest growth rate, reflecting the democratization of advanced content management capabilities. This segment continues to represent most of the market revenue due to complex asset management requirements and substantial content volumes. Large enterprises typically manage millions of digital assets across multiple departments, brands, and geographic regions. Growth in this segment is mainly driven by digital transformation initiatives and increasing content marketing investments.
Based on industry vertical, the market covers Media & Entertainment, Marketing & Advertising, Enterprise sectors (Healthcare, BFSI, Manufacturing, Retail, Government), and Others. The Media & Entertainment segment leads the market adoption with sophisticated requirements for content creation, distribution, and monetization workflows. Streaming platforms, production companies, and digital agencies require advanced video asset management, rights tracking, and multi-format distribution capabilities. Growth of this segment is primarily driven by content consumption trends, original programming investments, and need for efficient content supply chains.
Regional Market Analysis
North America leads the Media Asset Management market with mature digital infrastructure and high technology adoption rates. The region's concentration of media companies, advertising agencies, and technology firms drives substantial demand for advanced MAM solutions. Regulatory requirements around data privacy and accessibility compliance support market growth, while established procurement processes facilitate enterprise software adoption.
Europe continues expanding MAM adoption across diverse industries with emphasis on data sovereignty and privacy compliance. GDPR requirements drive demand for solutions with robust data governance capabilities. The region's strong manufacturing and financial services sectors create opportunities for enterprise content management, while creative industries in markets like UK, Germany, and France drive sophisticated media asset requirements.
Asia-Pacific demonstrates the strongest growth potential driven by rapid digitalization and expanding technology infrastructure. China's massive e-commerce ecosystem and content creation industry drive demand for scalable MAM solutions. India's growing IT services sector and digital transformation initiatives create opportunities for both local and international providers. Japan's advanced technology adoption and content creation capabilities support premium MAM solution demand.
Latin America focuses on cost-effective MAM solutions supporting expanding digital marketing and e-commerce sectors. Brazil and Mexico lead regional adoption with growing advertising markets and increasing content marketing investments. Economic development and improving internet infrastructure create opportunities for cloud-based MAM solutions serving price-sensitive markets.
Media Asset Management Market Share
Major players like Adobe Inc., Oracle Corporation, IBM Corporation, and Amazon Web Services compete strongly in the Media Asset Management industry. These companies focus on strategic acquisitions, AI technology integration, and cloud platform expansion to strengthen their market positions and develop next-generation MAM solutions. As demand grows for comprehensive content management across media, marketing, and enterprise sectors, companies invest heavily in R&D programs, partner ecosystem development, and vertical-specific solution offerings.
Leading providers are forming strategic partnerships with marketing technology vendors, creative software companies, and system integrators to create comprehensive content management ecosystems. These collaborations enable better workflow integration, improved user experiences, and seamless connectivity with existing marketing and creative technology stacks. The market is also witnessing increased venture capital investment in specialized MAM startups focused on AI-powered content intelligence and industry-specific solutions.
Media Asset Management Market Companies
Major players operating in the Media Asset Management industry include:
|
Particulars |
Details |
|
Number of Pages |
235 |
|
Format |
PDF & Excel |
|
Forecast Period |
2025–2035 |
|
Base Year |
2024 |
|
CAGR (Value) |
13.9% |
|
Market Size (Value)in 2025 |
USD 1.97 Billion |
|
Market Size (Value) in 2035 |
USD 7.23 Billion |
|
Segments Covered |
By Solution Type/Offering Module
By Deployment Model
By Organization Size
By Industry Vertical
|
|
Countries Covered |
North America (U.S., Canada) |
|
Key Companies |
Adobe Inc. (Adobe Experience Manager Assets), Amazon, Oracle Corporation (Oracle Content Management), EditShare, IBM Corporation (IBM Content Manager), Dalet, Evolphin Software, Inc., Quantum Corporation, Imagen, CELUM GmbH, Aprimo, Inc., Avid Technology, Inc., NEP Group, Salsify Inc., MediaBeacon Inc., Tedial Media, S.L., VSN Video Stream Networks SL, Vizrt, Third Light Ltd., Picturepark AG, IntelligenceBank Pty. Ltd., and Dell Technologies Inc. |
The Media Asset Management Market size is expected to reach USD 1.97 billion in 2025 and grow at a CAGR of 13.9% to reach USD 11.5 billion by 2035.
In 2025, the Media Asset Management Market size is expected to reach USD 1.97 billion.
Adobe Inc., Oracle Corporation, IBM Corporation, Amazon Web Services, and Microsoft Corporation are the major companies operating in the Media Asset Management Market.
The Asia-Pacific region is estimated to grow at the highest CAGR over the forecast period (2025-2035).
In 2025, Digital Asset Management solutions account for the largest market share in the Media Asset Management Market.
In 2024, the Media Asset Management Market size was estimated at USD 1.78 billion. The report covers historical market size data and forecasts through 2035.
1. Market Definition & Scope
1.1. Market Definition
1.2. Market Ecosystem
1.3. Currency
1.4. Key Stakeholders
2. Research Methodology
2.1. Research Approach
2.2. Process of Data Collection and Validation
2.2.1. Secondary Research
2.2.2. Primary Research/Interviews with Key Opinion Leaders from the Industry
2.3. Market Sizing and Forecast
2.3.1. Market Size Estimation Approach
2.3.1.1. Bottom-up Approach
2.3.1.2. Top-down Approach
2.3.2. Growth Forecast Approach
2.3.3. Assumptions for the Study
3. Executive Summary
3.1. Overview
3.2. Segmental Analysis
3.2.1. Media Asset Management Market, by Solution Type/Offering Module
3.2.2. Media Asset Management Market, by Deployment Model
3.2.3. Media Asset Management Market, by Organization Size
3.2.4. Media Asset Management Market, by Industry Vertical
3.2.5. Media Asset Management Market, by Geography
3.3. Competitive Landscape
4. Market Insights
4.1. Overview
4.2. Factors Affecting Market Growth
4.2.1. Drivers
4.2.1.1. Digital Transformation and Content Volume Growth
4.2.1.2. Rising Demand for Brand Consistency and Content Governance
4.2.1.3. Growth of Multi-Channel Marketing and Distribution
4.2.1.4. Integration with AI and Machine Learning Technologies
4.2.2. Restraints
4.2.2.1. High Implementation and Integration Costs
4.2.2.2. Data Security and Privacy Concerns
4.2.2.3. Complexity in Legacy System Integration
4.2.3. Opportunities
4.2.3.1. Expansion in Small and Medium Enterprises (SMEs)
4.2.3.2. Integration with Emerging Technologies (AR/VR, IoT)
4.2.3.3. Growing Demand in Emerging Markets
4.2.4. Trends
4.2.4.1. Cloud-First and Hybrid Deployment Models
4.2.4.2. AI-Powered Content Intelligence and Automation
4.2.4.3. Video Asset Management and Rich Media Support
4.2.5. Challenges
4.2.5.1. Ensuring Cross-Platform Compatibility
4.2.5.2. Managing Large-Scale Digital Asset Libraries
4.2.5.3. User Adoption and Change Management
4.3. Porter’s Five Forces Analysis
4.3.1. Bargaining Power of Suppliers
4.3.2. Bargaining Power of Buyers
4.3.3. Threat of Substitutes
4.3.4. Threat of New Entrants
4.3.5. Degree of Competition
4.4. Sustainability Impact on the Media Asset Management Market
4.4.1. Environmental Sustainability Factors
4.4.1.1. Environmental Sustainability Factors
4.4.1.2. Energy-Efficient Cloud Infrastructure
4.4.1.3. Reduced Physical Storage Requirements
4.4.2. Market Response to Sustainability Demands
4.4.2.1. Green Cloud Computing Initiatives
4.4.2.2. Sustainable Business Practices
4.4.3. Opportunities from Sustainability Focus
4.4.3.1. Carbon-Neutral MAM Solutions
4.4.3.2. Challenges in Sustainable Technology Development
5. Media Asset Management Market Assessment—By Solution Type/Offering Module
5.1. Overview
5.2. Digital Asset Management (images, video, audio, 3D, documents)
5.3. Workflow & Collaboration Tools
5.4. Metadata, AI/ML Tagging & Analytics
5.5. Brand Management & Compliance
5.6. Others
6. Media Asset Management Market Assessment—By Deployment Model
6.1. Overview
6.2. Cloud-based Solutions
6.2.1. Public Cloud
6.2.2. Private Cloud
6.2.3. Hybrid Cloud
6.3. On-premises Solutions
6.4. Software-as-a-Service (SaaS)
7. Media Asset Management Market Assessment—By Organization Size
7.1. Overview
7.2. Large Enterprises
7.3. Small and Medium Enterprises (SMEs)
8. Media Asset Management Market Assessment—By Industry Vertical
8.1. Overview
8.2. Media & Entertainment
8.3. Marketing & Advertising
8.4. Enterprise (Healthcare, BFSI, Manufacturing, Retail, Government)
8.5. Others
9. Media Asset Management Market Assessment—By Geography
9.1. Overview
9.2. North America
9.2.1. U.S.
9.2.2. Canada
9.3. Europe
9.3.1. Germany
9.3.2. U.K.
9.3.3. France
9.3.4. Italy
9.3.5. Spain
9.3.6. Netherlands
9.3.7. Rest of Europe
9.4. Asia-Pacific
9.4.1. China
9.4.2. Japan
9.4.3. South Korea
9.4.4. India
9.4.5. Australia
9.4.6. Rest of Asia-Pacific
9.5. Latin America
9.5.1. Brazil
9.5.2. Mexico
9.5.3. Rest of Latin America
9.6. Middle East & Africa
9.6.1. United Arab Emirates
9.6.2. South Africa
9.6.3. Rest of Middle East and Africa
10. Competition Analysis
10.1. Overview
10.2. Key Growth Strategies
10.2.1. Market Differentiators
10.2.2. Synergy Analysis: Major Deals & Strategic Alliances
10.3. Competitive Benchmarking
10.4. Competitive Dashboard
10.4.1. Industry Leaders
10.4.2. Market Differentiators
10.4.3. Vanguards
10.4.4. Emerging Companies
10.5. Market Share Analysis/Market Ranking by the Key Players
11. Company Profiles (Company Overview, Financial Overview, Product Portfolio, and Strategic Developments)
11.1. Adobe Inc. (Adobe Experience Manager Assets)
11.2. Amazon
11.3. Oracle Corporation (Oracle Content Management)
11.4. EditShare
11.5. IBM Corporation (IBM Content Manager)
11.6. Dalet
11.7. Evolphin Software, Inc.
11.8. Quantum Corporation
11.9. Imagen
11.10. CELUM GmbH
11.11. Aprimo, Inc.
11.12. Avid Technology, Inc.
11.13. NEP Group
11.14. Salsify Inc.
11.15. MediaBeacon Inc.
11.16. Tedial Media, S.L.
11.17. VSN Video Stream Networks SL
11.18. Vizrt
11.19. Third Light Ltd.
11.20. Picturepark AG
11.21. IntelligenceBank Pty. Ltd.
11.22. Dell Technologies Inc.
12. Appendix
12.1. Available Customization
12.2. Related Reports
List of Tables
Table 1. Global Media Asset Management Market, by Solution Type/Offering Module, 2023–2035 (USD Million)
Table 2. Global Digital Asset Management (images, video, audio, 3D, documents) Market, by Country/Region, 2023–2035 (USD Million)
Table 3. Global Workflow & Collaboration Tools Market, by Country/Region, 2023–2035 (USD Million)
Table 4. Global Metadata, AI/ML Tagging & Analytics Market, by Country/Region, 2023–2035 (USD Million)
Table 5. Global Brand Management & Compliance Market, by Country/Region, 2023–2035 (USD Million)
Table 6. Global Other Solution Types Market, by Country/Region, 2023–2035 (USD Million)
Table 7. Global Media Asset Management Market, by Deployment Model, 2023–2035 (USD Million)
Table 8. Global Cloud-based Solutions Market, by Country/Region, 2023–2035 (USD Million)
Table 9. Global Cloud-based Solutions Market, by Type, 2023–2035 (USD Million)
Table 10. Global Public Cloud Solution Market, by Country/Region, 2023–2035 (USD Million)
Table 11. Global Private Cloud Solution Market, by Country/Region, 2023–2035 (USD Million)
Table 12. Global Hybrid Cloud Solution Market, by Country/Region, 2023–2035 (USD Million)
Table 13. Global On-premises Solutions Market, by Country/Region, 2023–2035 (USD Million)
Table 14. Global Software-as-a-Service (SaaS) Market, by Country/Region, 2023–2035 (USD Million)
Table 15. Global Media Asset Management Market, by Organization Size, 2023–2035 (USD Million)
Table 16. Global Media Asset Management by Large Enterprises, by Country/Region, 2023–2035 (USD Million)
Table 17. Global Media Asset Management by Small and Medium Enterprises (SMEs), by Country/Region, 2023–2035 (USD Million)
Table 18. Global Media Asset Management Market, by Industry Vertical, 2023–2035 (USD Million)
Table 19. Global Media Asset Management for Media & Entertainment Industry, by Country/Region, 2023–2035 (USD Million)
Table 20. Global Media Asset Management for Marketing & Advertising Industry, by Country/Region, 2023–2035 (USD Million)
Table 21. Global Media Asset Management for Enterprise (Healthcare, BFSI, Manufacturing, Retail, Government) Industry, by Country/Region, 2023–2035 (USD Million)
Table 22. Global Media Asset Management for Other Industries, by Country/Region, 2023–2035 (USD Million)
Table 23. North America: Media Asset Management Market, by Solution Type/Offering Module 2023–2035 (USD Million)
Table 24. North America: Media Asset Management Market, by Deployment Model, 2023–2035 (USD Million)
Table 25. North America: Cloud-based Solutions Market, by Type, 2023–2035 (USD Million)
Table 26. North America: Media Asset Management Market, by Organization Size, 2023–2035 (USD Million)
Table 27. North America: Media Asset Management Market, by Industry Vertical, 2023–2035 (USD Million)
Table 28. U.S.: Media Asset Management Market, by Solution Type/Offering Module 2023–2035 (USD Million)
Table 29. U.S.: Media Asset Management Market, by Deployment Model, 2023–2035 (USD Million)
Table 30. U.S.: Cloud-based Solutions Market, by Type, 2023–2035 (USD Million)
Table 31. U.S.: Media Asset Management Market, by Organization Size, 2023–2035 (USD Million)
Table 32. U.S.: Media Asset Management Market, by Industry Vertical, 2023–2035 (USD Million)
Table 33. Canada: Media Asset Management Market, by Solution Type/Offering Module 2023–2035 (USD Million)
Table 34. Canada: Media Asset Management Market, by Deployment Model, 2023–2035 (USD Million)
Table 35. Canada: Cloud-based Solutions Market, by Type, 2023–2035 (USD Million)
Table 36. Canada: Media Asset Management Market, by Organization Size, 2023–2035 (USD Million)
Table 37. Canada: Media Asset Management Market, by Industry Vertical, 2023–2035 (USD Million)
Table 38. Europe: Media Asset Management Market, by Solution Type/Offering Module 2023–2035 (USD Million)
Table 39. Europe: Media Asset Management Market, by Deployment Model, 2023–2035 (USD Million)
Table 40. Europe: Cloud-based Solutions Market, by Type, 2023–2035 (USD Million)
Table 41. Europe: Media Asset Management Market, by Organization Size, 2023–2035 (USD Million)
Table 42. Europe: Media Asset Management Market, by Industry Vertical, 2023–2035 (USD Million)
Table 43. Germany: Media Asset Management Market, by Solution Type/Offering Module 2023–2035 (USD Million)
Table 44. Germany: Media Asset Management Market, by Deployment Model, 2023–2035 (USD Million)
Table 45. Germany: Cloud-based Solutions Market, by Type, 2023–2035 (USD Million)
Table 46. Germany: Media Asset Management Market, by Organization Size, 2023–2035 (USD Million)
Table 47. Germany: Media Asset Management Market, by Industry Vertical, 2023–2035 (USD Million)
Table 48. France: Media Asset Management Market, by Solution Type/Offering Module 2023–2035 (USD Million)
Table 49. France: Media Asset Management Market, by Deployment Model, 2023–2035 (USD Million)
Table 50. France: Cloud-based Solutions Market, by Type, 2023–2035 (USD Million)
Table 51. France: Media Asset Management Market, by Organization Size, 2023–2035 (USD Million)
Table 52. France: Media Asset Management Market, by Industry Vertical, 2023–2035 (USD Million)
Table 53. U.K.: Media Asset Management Market, by Solution Type/Offering Module 2023–2035 (USD Million)
Table 54. U.K.: Media Asset Management Market, by Deployment Model, 2023–2035 (USD Million)
Table 55. U.K.: Cloud-based Solutions Market, by Type, 2023–2035 (USD Million)
Table 56. U.K.: Media Asset Management Market, by Organization Size, 2023–2035 (USD Million)
Table 57. U.K.: Media Asset Management Market, by Industry Vertical, 2023–2035 (USD Million)
Table 58. Italy: Media Asset Management Market, by Solution Type/Offering Module 2023–2035 (USD Million)
Table 59. Italy: Media Asset Management Market, by Deployment Model, 2023–2035 (USD Million)
Table 60. Italy: Cloud-based Solutions Market, by Type, 2023–2035 (USD Million)
Table 61. Italy: Media Asset Management Market, by Organization Size, 2023–2035 (USD Million)
Table 62. Italy: Media Asset Management Market, by Industry Vertical, 2023–2035 (USD Million)
Table 63. Spain: Media Asset Management Market, by Solution Type/Offering Module 2023–2035 (USD Million)
Table 64. Spain: Media Asset Management Market, by Deployment Model, 2023–2035 (USD Million)
Table 65. Spain: Cloud-based Solutions Market, by Type, 2023–2035 (USD Million)
Table 66. Spain: Media Asset Management Market, by Organization Size, 2023–2035 (USD Million)
Table 67. Spain: Media Asset Management Market, by Industry Vertical, 2023–2035 (USD Million)
Table 68. Netherlands: Media Asset Management Market, by Solution Type/Offering Module 2023–2035 (USD Million)
Table 69. Netherlands: Media Asset Management Market, by Deployment Model, 2023–2035 (USD Million)
Table 70. Netherlands: Cloud-based Solutions Market, by Type, 2023–2035 (USD Million)
Table 71. Netherlands: Media Asset Management Market, by Organization Size, 2023–2035 (USD Million)
Table 72. Netherlands: Media Asset Management Market, by Industry Vertical, 2023–2035 (USD Million)
Table 73. Rest of Europe: Media Asset Management Market, by Solution Type/Offering Module 2023–2035 (USD Million)
Table 74. Rest of Europe: Media Asset Management Market, by Deployment Model, 2023–2035 (USD Million)
Table 75. Rest of Europe: Cloud-based Solutions Market, by Type, 2023–2035 (USD Million)
Table 76. Rest of Europe: Media Asset Management Market, by Organization Size, 2023–2035 (USD Million)
Table 77. Rest of Europe: Media Asset Management Market, by Industry Vertical, 2023–2035 (USD Million)
Table 78. Asia-Pacific: Media Asset Management Market, by Solution Type/Offering Module 2023–2035 (USD Million)
Table 79. Asia-Pacific: Media Asset Management Market, by Deployment Model, 2023–2035 (USD Million)
Table 80. Asia-Pacific: Cloud-based Solutions Market, by Type, 2023–2035 (USD Million)
Table 81. Asia-Pacific: Media Asset Management Market, by Organization Size, 2023–2035 (USD Million)
Table 82. Asia-Pacific: Media Asset Management Market, by Industry Vertical, 2023–2035 (USD Million)
Table 83. Japan: Media Asset Management Market, by Solution Type/Offering Module 2023–2035 (USD Million)
Table 84. Japan: Media Asset Management Market, by Deployment Model, 2023–2035 (USD Million)
Table 85. Japan: Cloud-based Solutions Market, by Type, 2023–2035 (USD Million)
Table 86. Japan: Media Asset Management Market, by Organization Size, 2023–2035 (USD Million)
Table 87. Japan: Media Asset Management Market, by Industry Vertical, 2023–2035 (USD Million)
Table 88. South Korea: Media Asset Management Market, by Solution Type/Offering Module 2023–2035 (USD Million)
Table 89. South Korea: Media Asset Management Market, by Deployment Model, 2023–2035 (USD Million)
Table 90. South Korea: Cloud-based Solutions Market, by Type, 2023–2035 (USD Million)
Table 91. South Korea: Media Asset Management Market, by Organization Size, 2023–2035 (USD Million)
Table 92. South Korea: Media Asset Management Market, by Industry Vertical, 2023–2035 (USD Million)
Table 93. China: Media Asset Management Market, by Solution Type/Offering Module 2023–2035 (USD Million)
Table 94. China: Media Asset Management Market, by Deployment Model, 2023–2035 (USD Million)
Table 95. China: Cloud-based Solutions Market, by Type, 2023–2035 (USD Million)
Table 96. China: Media Asset Management Market, by Organization Size, 2023–2035 (USD Million)
Table 97. China: Media Asset Management Market, by Industry Vertical, 2023–2035 (USD Million)
Table 98. India: Media Asset Management Market, by Solution Type/Offering Module 2023–2035 (USD Million)
Table 99. India: Media Asset Management Market, by Deployment Model, 2023–2035 (USD Million)
Table 100. India: Cloud-based Solutions Market, by Type, 2023–2035 (USD Million)
Table 101. India: Media Asset Management Market, by Organization Size, 2023–2035 (USD Million)
Table 102. India: Media Asset Management Market, by Industry Vertical, 2023–2035 (USD Million)
Table 103. Australia: Media Asset Management Market, by Solution Type/Offering Module 2023–2035 (USD Million)
Table 104. Australia: Media Asset Management Market, by Deployment Model, 2023–2035 (USD Million)
Table 105. Australia: Cloud-based Solutions Market, by Type, 2023–2035 (USD Million)
Table 106. Australia: Media Asset Management Market, by Organization Size, 2023–2035 (USD Million)
Table 107. Australia: Media Asset Management Market, by Industry Vertical, 2023–2035 (USD Million)
Table 108. Rest of Asia-Pacific: Media Asset Management Market, by Solution Type/Offering Module 2023–2035 (USD Million)
Table 109. Rest of Asia-Pacific: Media Asset Management Market, by Deployment Model, 2023–2035 (USD Million)
Table 110. Rest of Asia-Pacific: Cloud-based Solutions Market, by Type, 2023–2035 (USD Million)
Table 111. Rest of Asia-Pacific: Media Asset Management Market, by Organization Size, 2023–2035 (USD Million)
Table 112. Rest of Asia-Pacific: Media Asset Management Market, by Industry Vertical, 2023–2035 (USD Million)
Table 113. Latin America: Media Asset Management Market, by Solution Type/Offering Module 2023–2035 (USD Million)
Table 114. Latin America: Media Asset Management Market, by Deployment Model, 2023–2035 (USD Million)
Table 115. Latin America: Cloud-based Solutions Market, by Type, 2023–2035 (USD Million)
Table 116. Latin America: Media Asset Management Market, by Organization Size, 2023–2035 (USD Million)
Table 117. Latin America: Media Asset Management Market, by Industry Vertical, 2023–2035 (USD Million)
Table 118. Brazil: Media Asset Management Market, by Solution Type/Offering Module 2023–2035 (USD Million)
Table 119. Brazil: Media Asset Management Market, by Deployment Model, 2023–2035 (USD Million)
Table 120. Brazil: Cloud-based Solutions Market, by Type, 2023–2035 (USD Million)
Table 121. Brazil: Media Asset Management Market, by Organization Size, 2023–2035 (USD Million)
Table 122. Brazil: Media Asset Management Market, by Industry Vertical, 2023–2035 (USD Million)
Table 123. Mexico: Media Asset Management Market, by Solution Type/Offering Module 2023–2035 (USD Million)
Table 124. Mexico: Media Asset Management Market, by Deployment Model, 2023–2035 (USD Million)
Table 125. Mexico: Cloud-based Solutions Market, by Type, 2023–2035 (USD Million)
Table 126. Mexico: Media Asset Management Market, by Organization Size, 2023–2035 (USD Million)
Table 127. Mexico: Media Asset Management Market, by Industry Vertical, 2023–2035 (USD Million)
Table 128. Rest of Latin America: Media Asset Management Market, by Solution Type/Offering Module 2023–2035 (USD Million)
Table 129. Rest of Latin America: Media Asset Management Market, by Deployment Model, 2023–2035 (USD Million)
Table 130. Rest of Latin America: Cloud-based Solutions Market, by Type, 2023–2035 (USD Million)
Table 131. Rest of Latin America: Media Asset Management Market, by Organization Size, 2023–2035 (USD Million)
Table 132. Rest of Latin America: Media Asset Management Market, by Industry Vertical, 2023–2035 (USD Million)
Table 133. Middle East and Africa: Media Asset Management Market, by Solution Type/Offering Module 2023–2035 (USD Million)
Table 134. Middle East and Africa: Media Asset Management Market, by Deployment Model, 2023–2035 (USD Million)
Table 135. Middle East and Africa: Cloud-based Solutions Market, by Type, 2023–2035 (USD Million)
Table 136. Middle East and Africa: Media Asset Management Market, by Organization Size, 2023–2035 (USD Million)
Table 137. Middle East and Africa: Media Asset Management Market, by Industry Vertical, 2023–2035 (USD Million)
Table 138. United Arab Emirates: Media Asset Management Market, by Solution Type/Offering Module 2023–2035 (USD Million)
Table 139. United Arab Emirates: Media Asset Management Market, by Deployment Model, 2023–2035 (USD Million)
Table 140. United Arab Emirates: Cloud-based Solutions Market, by Type, 2023–2035 (USD Million)
Table 141. United Arab Emirates: Media Asset Management Market, by Organization Size, 2023–2035 (USD Million)
Table 142. United Arab Emirates: Media Asset Management Market, by Industry Vertical, 2023–2035 (USD Million)
Table 143. South Africa: Media Asset Management Market, by Solution Type/Offering Module 2023–2035 (USD Million)
Table 144. South Africa: Media Asset Management Market, by Deployment Model, 2023–2035 (USD Million)
Table 145. South Africa: Cloud-based Solutions Market, by Type, 2023–2035 (USD Million)
Table 146. South Africa: Media Asset Management Market, by Organization Size, 2023–2035 (USD Million)
Table 147. South Africa: Media Asset Management Market, by Industry Vertical, 2023–2035 (USD Million)
Table 148. Rest of Middle East and Africa: Media Asset Management Market, by Solution Type/Offering Module 2023–2035 (USD Million)
Table 149. Rest of Middle East and Africa: Media Asset Management Market, by Deployment Model, 2023–2035 (USD Million)
Table 150. Rest of Middle East and Africa: Cloud-based Solutions Market, by Type, 2023–2035 (USD Million)
Table 151. Rest of Middle East and Africa: Media Asset Management Market, by Organization Size, 2023–2035 (USD Million)
Table 152. Rest of Middle East and Africa: Media Asset Management Market, by Industry Vertical, 2023–2035 (USD Million)
List of Figures
Figure 1. Research Process
Figure 2. Secondary Components Referenced for This Study
Figure 3. Primary Research Techniques
Figure 4. Key Executives Interviewed
Figure 5. Breakdown of Primary Interviews (Supply Side & Demand Side)
Figure 6. Market Sizing and Growth Forecast Approach
Figure 7. In 2025, the Digital Asset Management (images, video, audio, 3D, documents) to Account for the Largest Share
Figure 8. In 2025, the Cloud-based Solutions to Account for the Largest Share
Figure 9. In 2025, Media Asset Management Market by Large Enterprises to Account for the Largest Share
Figure 10. North America to be the Largest Regional Market
Figure 11. Impact Analysis of Market Dynamics
Figure 12. Global Media Asset Management Market: Porter's Five Forces Analysis
Figure 13. Global Media Asset Management Market, by Solution Type/Offering Module, 2025 Vs. 2035 (USD Million)
Figure 14. Global Media Asset Management Market, by Deployment Model, 2025 Vs. 2035 (USD Million)
Figure 15. Global Media Asset Management Market, by Organization Size, 2025 Vs. 2035 (USD Million)
Figure 16. Global Media Asset Management Market, by Industry Vertical, 2025 Vs. 2035 (USD Million)
Figure 16. Global Media Asset Management Market, by Region, 2025 Vs. 2035 (USD Million)
Figure 17. North America: Media Asset Management Snapshot (2025)
Figure 18. Europe: Media Asset Management Market Snapshot (2025)
Figure 19. Asia-Pacific: Media Asset Management Market Snapshot (2025)
Figure 20. Latin America: Media Asset Management Market Snapshot (2025)
Figure 21. Middle East & Africa: Media Asset Management Market Snapshot (2025)
Figure 22. Key Growth Strategies Adopted by Leading Players (2022–2025)
Figure 23. Global Media Asset Management Market Competitive Benchmarking, by Solution Type/Offering Module
Figure 24. Competitive Dashboard: Global Media Asset Management Market
Figure 25. Global Media Asset Management Market Share/Ranking, by Key Player, 2024 (%)


Published Date: Jun-2026
Published Date: Feb-2026
Published Date: Aug-2025
Published Date: Jan-2025
Published Date: Sep-2024
Subscribe to get the latest industry updates