Resources
About Us
This comprehensive market research report analyzes the global construction aggregates market, evaluating how solution providers are addressing the increasing infrastructure development projects globally, growing urbanization and housing construction activities, and evolving sustainability requirements across various regions. The report provides a strategic analysis of market dynamics, growth projections till 2035, and competitive positioning across global and regional/country-level markets.
Key Market Drivers & Trends and Insights
Click here to: Get Free Sample Pages of this Report
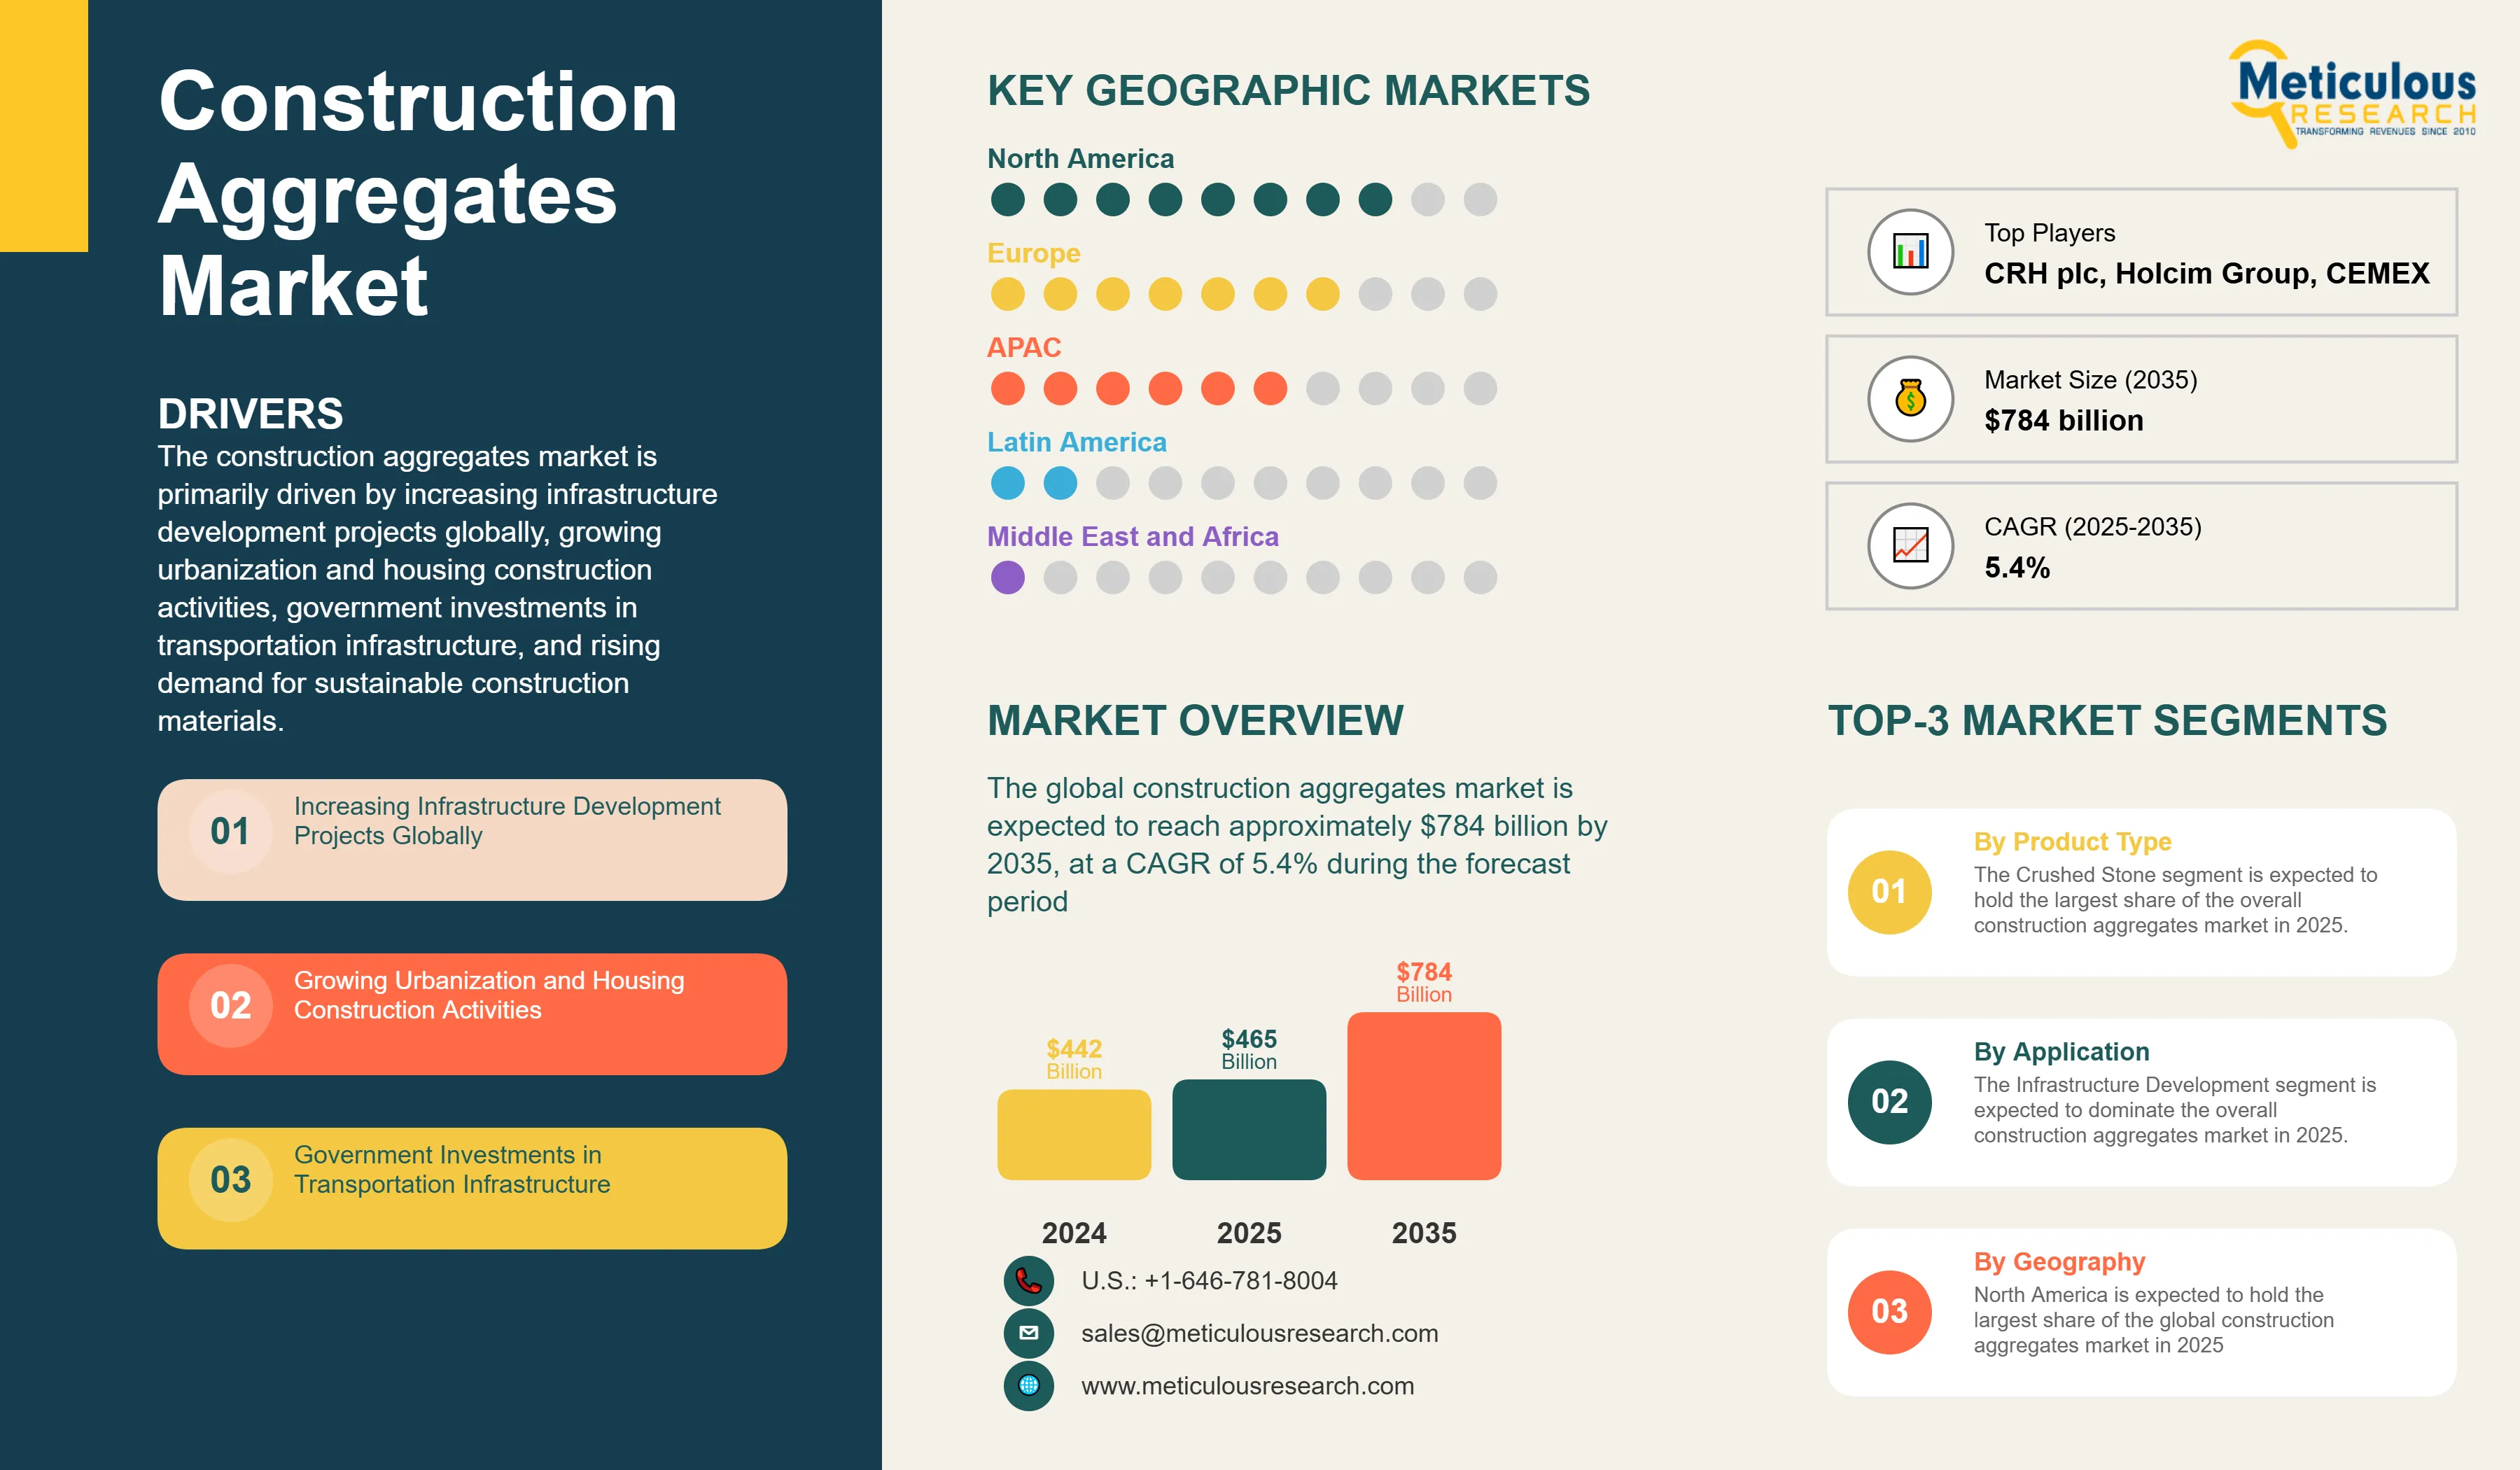
The construction aggregates market is primarily driven by increasing infrastructure development projects globally, growing urbanization and housing construction activities, government investments in transportation infrastructure, and rising demand for sustainable construction materials. The adoption of digital technologies in aggregate production and increasing use of lightweight aggregates are reshaping the industry, while vertical integration by key players and focus on regional production to minimize transportation costs are gaining significant traction. Additionally, development of recycled and manufactured aggregates and integration with smart infrastructure projects are further driving market growth, especially in developed markets with advanced construction infrastructure.
Key Challenges
Despite significant growth potential, the overall construction aggregates market faces challenges including environmental concerns related to quarrying activities, stringent regulatory policies on extraction, depletion of natural resources, and high transportation costs. Additionally, quality control and standardization, land use and permitting issues, competition from alternative materials, and supply chain disruptions present significant obstacles, potentially slowing down market adoption in different regions across the globe.
Growth Opportunities
The construction aggregates market offers several high-growth opportunities. Development of recycled and manufactured aggregates is driving innovation across multiple segments. Another major opportunity lies in expanding construction infrastructure in emerging markets. Additionally, technological advancements in production processes and integration with smart infrastructure projects are creating new revenue streams for solution providers, as organizations increasingly seek sustainable alternatives to traditional construction materials.
Market Segmentation Highlights
By Product Type
The Crushed Stone segment is expected to hold the largest share of the overall construction aggregates market in 2025, due to its versatility and growing adoption in construction projects across the globe. The adoption of Sand & Gravel is increased particularly in regions with robust residential construction. However, the Recycled Aggregates segment is expected to grow at the fastest CAGR during the forecast period, driven by increasing sustainability concerns, regulatory pressure to reduce quarrying, and the push for circular economy principles in construction practices.
By Application
The Infrastructure Development segment is expected to dominate the overall construction aggregates market in 2025, primarily due to significant government investments in transportation infrastructure across the globe. Residential Construction follows closely, leveraging from growing urbanization and housing demands. However, the Non-Residential Construction segment is expected to grow at a significant CAGR through the forecast period, driven by increasing commercial and industrial development projects, focus on sustainable building practices, and the need for specialized aggregates in advanced construction techniques.
By Geography
North America is expected to hold the largest share of the global construction aggregates market in 2025, driven by mature infrastructure, robust construction industry, advanced technology adoption, and significant investments in infrastructure renewal and residential construction projects. The region's well-established construction aggregates industry, stringent quality standards, and ongoing infrastructure maintenance contribute to its market dominance.
While North America leads in market share, Asia-Pacific is projected to witness the fastest growth rate during the forecast period. This rapid growth is primarily driven by rapid urbanization, massive infrastructure development projects, expanding population, and significant government investments in transportation and construction networks. Emerging markets in Asia-Pacific are experiencing transformative infrastructure development, creating substantial opportunities for construction aggregates.
Additionally, emerging markets in Latin America and Middle East & Africa are showing promising growth potential, driven by expanding construction activities, increasing government investments in infrastructure, growing awareness about sustainable construction materials, and the diverse applications of construction aggregates. However, these regions remain smaller compared to the mature North American market and the rapidly growing Asia-Pacific market.
Competitive Landscape
The global construction aggregates market features a diverse competitive landscape with established building materials manufacturers, mining and quarrying specialists, construction solution providers, and innovative sustainability-focused startups pursuing varied approaches to construction aggregates production and distribution.
The broader solution provider landscape is categorized into industry leaders, market differentiators, vanguards, and contemporary stalwarts, with each group employing distinctive strategies to maintain competitive advantage. Leading providers are focusing on integrated solutions that combine advanced production technology with broader construction material services while addressing region-specific sustainability challenges.
The key players operating in the global construction aggregates market are CRH plc, Holcim Group, Heidelberg Materials (HeidelbergCement AG), Vulcan Materials Company, Martin Marietta Materials, Inc., CEMEX S.A.B. de C.V., Breedon Group plc, Adbri Limited, Knife River Corporation, Summit Materials, Inc., Rogers Group Inc., Luck Companies (Luck Stone), Granite Construction Incorporated, VINCI Construction, Vicat Group, Colas Group (Bouygues Group), GCC, UltraTech Cement Limited, Aggregate Industries (Holcim Group), and LSR Group among others.
|
Particulars |
Details |
|
Number of Pages |
272 |
|
Format |
PDF & Excel |
|
Forecast Period |
2025–2035 |
|
Base Year |
2024 |
|
CAGR (Value) |
5.4% |
|
Market Size (Value) in 2025 |
USD 465 Billion |
|
Market Size (Value) in 2035 |
USD 784 Billion |
|
Segments Covered |
Market Assessment, by Type
Market Assessment, by Application
|
|
Countries Covered |
North America (U.S., Canada), Europe (Germany, France, U.K., Italy, Spain, Russia, Rest of Europe), Asia-Pacific (China, Japan, India, South Korea, Australia, Rest of Asia-Pacific), Latin America (Brazil, Mexico, Rest of Latin America), Middle East & Africa (Saudi Arabia, UAE, Rest of Middle East & Africa) |
|
Key Companies |
CRH plc, Holcim Group, Heidelberg Materials (HeidelbergCement AG), Vulcan Materials Company, Martin Marietta Materials, Inc., CEMEX S.A.B. de C.V., Breedon Group plc, Adbri Limited, Knife River Corporation, Summit Materials, Inc., Rogers Group Inc., Luck Companies (Luck Stone), Granite Construction Incorporated, VINCI Construction, Vicat Group, Colas Group (Bouygues Group), GCC, UltraTech Cement Limited, Aggregate Industries (Holcim Group), LSR Group |
The global construction aggregates market was valued at $442 billion in 2024. This market is expected to reach approximately $784 billion by 2035, growing from an estimated $465 billion in 2025, at a CAGR of 5.4% during the forecast period of 2025–2035.
The global construction aggregates market is expected to grow at a CAGR of 5.4% during the forecast period of 2025–2035.
The global construction aggregates market is expected to reach approximately $784 billion by 2035, growing from an estimated $465 billion in 2025, at a CAGR of 5.4% during the forecast period of 2025–2035.
The key companies operating in this market include CRH plc, Holcim Group, Heidelberg Materials (HeidelbergCement AG), Vulcan Materials Company, Martin Marietta Materials, Inc., CEMEX S.A.B. de C.V., Breedon Group plc, Adbri Limited, and others.
Major trends shaping the market include adoption of digital technologies in aggregate production, increasing use of lightweight aggregates, vertical integration by key players, and focus on regional production to minimize transportation costs.
Which Segments Will Hold Large Market Shares in the Construction Aggregates Market during 2025-2035?
• In 2025, the Crushed Stone segment is expected to dominate the overall construction aggregates market by product type
• Based on application, the Infrastructure Development segment is expected to hold the largest share of the overall construction aggregates market in 2025
• Based on geography, North America is expected to hold the largest market share, while Asia-Pacific is projected to be the fastest-growing region in the global construction aggregates market in 2025
North America is expected to hold the largest share of the global construction aggregates market in 2025, characterized by a mature and well-established construction industry. Simultaneously, Asia-Pacific is projected to be the fastest-growing region, driven by rapid urbanization, massive infrastructure development projects, and significant investments in transportation networks.
The growth of this market is driven by increasing infrastructure development projects globally, growing urbanization and housing construction activities, government investments in transportation infrastructure, and rising demand for sustainable construction materials.
1. Market Definition & Scope
1.1. Market Definition
1.2. Market Ecosystem
1.3. Currency
1.4. Key Stakeholders
2. Research Methodology
2.1. Research Approach
2.2. Process of Data Collection and Validation
2.2.1. Secondary Research
2.2.2. Primary Research/Interviews with Key Opinion Leaders from the Industry
2.3. Market Sizing and Forecast
2.3.1. Market Size Estimation Approach
2.3.1.1. Bottom-up Approach
2.3.1.2. Top-down Approach
2.3.2. Growth Forecast Approach
2.3.3. Assumptions for the Study
3. Executive Summary
3.1. Overview
3.2. Segmental Analysis
3.2.1. Construction Aggregates Market, by Product Type
3.2.2. Construction Aggregates Market Market, by Application
3.2.3. Construction Aggregates Market, by Geography
3.3. Competitive Landscape
4. Market Insights
4.1. Overview
4.2. Factors Affecting Market Growth
4.2.1. Drivers
4.2.1.1. Increasing Infrastructure Development Projects Globally
4.2.1.2. Growing Urbanization and Housing Construction Activities
4.2.1.3. Government Investments in Transportation Infrastructure
4.2.1.4. Rising Demand for Sustainable Construction Materials
4.2.2. Restraints
4.2.2.1. Environmental Concerns Related to Quarrying Activities
4.2.2.2. Stringent Regulatory Policies on Extraction
4.2.2.3. Depletion of Natural Resources
4.2.2.4. High Transportation Costs
4.2.3. Opportunities
4.2.3.1. Development of Recycled and Manufactured Aggregates
4.2.3.2. Technological Advancements in Production Processes
4.2.3.3. Growing Demand in Emerging Markets
4.2.3.4. Integration with Smart Infrastructure Projects
4.2.4. Trends
4.2.4.1. Adoption of Digital Technologies in Aggregate Production
4.2.4.2. Increasing Use of Lightweight Aggregates
4.2.4.3. Vertical Integration by Key Players
4.2.4.4. Focus on Regional Production to Minimize Transportation Costs
4.2.5. Challenges
4.2.5.1. Quality Control and Standardization
4.2.5.2. Land Use and Permitting Issues
4.2.5.3. Competition from Alternative Materials
4.2.5.4. Supply Chain Disruptions
4.3. Porter’s Five Forces Analysis
4.3.1. Bargaining Power of Suppliers
4.3.2. Bargaining Power of Buyers
4.3.3. Threat of Substitutes
4.3.4. Threat of New Entrants
4.3.5. Degree of Competition
4.4. Sustainability Impact on Construction Aggregates Market
4.4.1. Environmental Sustainability Factors
4.4.1.1. Resource Conservation and Management
4.4.1.2. Carbon Footprint Reduction Initiatives
4.4.2. Market Response to Sustainability Demands
4.4.2.1. Regulatory Compliance Drivers
4.4.2.2. Industry Initiatives
4.4.3. Market Opportunities Created by Sustainability Focus
4.4.3.1. Challenges to Sustainable Implementation
4.4.3.2. Future Sustainability Trends
5. CONSTRUCTION AGGREGATES MARKET ASSESSMENT—BY TYPE
5.1. Overview
5.2. Crushed Stone
5.3. Sand & Gravel
5.4. Recycled Aggregates
5.5. Manufactured Aggregates
5.6. Specialty Aggregates
6. CONSTRUCTION AGGREGATES MARKET ASSESSMENT—BY APPLICATION
6.1. Overview
6.2. Residential Construction
6.3. Non-Residential Construction
6.4. Infrastructure Development
6.4.1. Roads & Highways
6.4.2. Bridges & Dams
6.4.3. Airports & Railways
6.4.4. Others
7. CONSTRUCTION AGGREGATES MARKET ASSESSMENT—BY GEOGRAPHY
7.1. Overview
7.2. North America
7.2.1. U.S.
7.2.2. Canada
7.3. Europe
7.3.1. Germany
7.3.2. France
7.3.3. U.K.
7.3.4. Italy
7.3.5. Spain
7.3.6. Russia
7.3.7. Rest of Europe (RoE)
7.4. Asia-Pacific
7.4.1. China
7.4.2. Japan
7.4.3. India
7.4.4. South Korea
7.4.5. Australia
7.4.6. Rest of Asia-Pacific (RoAPAC)
7.5. Latin America
7.5.1. Brazil
7.5.2. Mexico
7.5.3. Rest of Latin America (RoLATAM)
7.6. Middle East & Africa
7.6.1. Saudi Arabia
7.6.2. United Arab Emirates (UAE)
7.6.3. Rest of Middle East & Africa (RoMEA)
8. Competitive Landscape
8.1. Overview
8.2. Key Growth Strategies
8.3. Competitive Benchmarking
8.4. Competitive Dashboard
8.4.1. Industry Leaders
8.4.2. Market Differentiators
8.4.3. Vanguards
8.4.4. Contemporary Stalwarts
8.5. Market Share/Ranking Analysis, by the Key Players, 2024
9. Company Profiles (Business Overview, Financial Overview, Product Portfolio, Strategic Developments, and SWOT Analysis*)
9.1. CRH plc
9.2. Holcim Group
9.3. Heidelberg Materials (HeidelbergCement AG)
9.4. Vulcan Materials Company
9.5. Martin Marietta Materials, Inc.
9.6. CEMEX S.A.B. de C.V.
9.7. Breedon Group plc
9.8. Adbri Limited (formerly Adelaide Brighton Ltd)
9.9. Knife River Corporation (spun off from MDU Resources)
9.10. Summit Materials, Inc.
9.11. Rogers Group Inc.
9.12. Luck Companies (Luck Stone)
9.13. Granite Construction Incorporated
9.14. VINCI Construction (including former EUROVIA operations)
9.15. Vicat Group
9.16. Colas Group (Bouygues Group)
9.17. GCC (formerly Grupo Cementos de Chihuahua)
9.18. UltraTech Cement Limited
9.19. Aggregate Industries (Holcim Group)
9.20. LSR Group
10. Appendix
10.1. Available Customization
10.2. Related Reports
LIST OF TABLES
Table 1. Global Construction Aggregates Market, by Type, 2023–2035 (USD Million)
Table 2. Global Crushed Stone Market, by Country/Region, 2023–2035 (USD Million)
Table 3. Global Sand & Gravel Market, by Country/Region, 2023–2035 (USD Million)
Table 4. Global Recycled Aggregates Market, by Country/Region, 2023–2035 (USD Million)
Table 5. Global Manufactured Aggregates Market, by Country/Region, 2023–2035 (USD Million)
Table 6. Global Specialty Aggregates Market, by Country/Region, 2023–2035 (USD Million)
Table 7. Global Construction Aggregates Market, by Application, 2023–2035 (USD Million)
Table 8. Global Construction Aggregates Market for Residential Construction, by Country/Region, 2023–2035 (USD Million)
Table 9. Global Construction Aggregates Market for Non-Residential Construction, by Country/Region, 2023–2035 (USD Million)
Table 10. Global Construction Aggregates Market for Infrastructure Development, by Type, 2023–2035 (USD Million)
Table 11. Global Construction Aggregates Market for Roads & Highways, by Country/Region, 2023–2035 (USD Million)
Table 12. Global Construction Aggregates Market for Bridges & Dams, by Country/Region, 2023–2035 (USD Million)
Table 13. Global Construction Aggregates Market for Airports & Railways, by Country/Region, 2023–2035 (USD Million)
Table 14. Global Construction Aggregates Market for Other Applications, by Country/Region, 2023–2035 (USD Million)
Table 15. North America: Construction Aggregates Market, by Type, 2023–2035 (USD Million)
Table 16. North America: Construction Aggregates Market, by Application, 2023–2035 (USD Million)
Table 17. North America: Construction Aggregates Market for Infrastructure Development Market, by Type, 2023–2035 (USD Million)
Table 18. U.S.: Construction Aggregates Market, by Product Type, 2023–2035 (USD Million)
Table 19. U.S.: Construction Aggregates Market, by Application, 2023–2035 (USD Million)
Table 20. U.S.: Construction Aggregates Market for Infrastructure Development Market, by Type, 2023–2035 (USD Million)
Table 21. Canada: Construction Aggregates Market, by Product Type, 2023–2035 (USD Million)
Table 22. Canada: Construction Aggregates Market, by Application, 2023–2035 (USD Million)
Table 23. Canada: Construction Aggregates Market for Infrastructure Development Market, by Type, 2023–2035 (USD Million)
Table 24. Europe: Construction Aggregates Market, by Product Type, 2023–2035 (USD Million)
Table 25. Europe: Construction Aggregates Market, by Application, 2023–2035 (USD Million)
Table 26. Europe: Construction Aggregates Market for Infrastructure Development Market, by Type, 2023–2035 (USD Million)
Table 27. Germany: Construction Aggregates Market, by Product Type, 2023–2035 (USD Million)
Table 28. Germany: Construction Aggregates Market, by Application, 2023–2035 (USD Million)
Table 29. Germany: Construction Aggregates Market for Infrastructure Development Market, by Type, 2023–2035 (USD Million)
Table 30. France: Construction Aggregates Market, by Product Type, 2023–2035 (USD Million)
Table 31. France: Construction Aggregates Market, by Application, 2023–2035 (USD Million)
Table 32. France: Construction Aggregates Market for Infrastructure Development Market, by Type, 2023–2035 (USD Million)
Table 33. U.K.: Construction Aggregates Market, by Product Type, 2023–2035 (USD Million)
Table 34. U.K.: Construction Aggregates Market, by Application, 2023–2035 (USD Million)
Table 35. U.K.: Construction Aggregates Market for Infrastructure Development Market, by Type, 2023–2035 (USD Million)
Table 36. Italy: Construction Aggregates Market, by Product Type, 2023–2035 (USD Million)
Table 37. Italy: Construction Aggregates Market, by Application, 2023–2035 (USD Million)
Table 38. Italy: Construction Aggregates Market for Infrastructure Development Market, by Type, 2023–2035 (USD Million)
Table 39. Spain: Construction Aggregates Market, by Product Type, 2023–2035 (USD Million)
Table 40. Spain: Construction Aggregates Market, by Application, 2023–2035 (USD Million)
Table 41. Spain: Construction Aggregates Market for Infrastructure Development Market, by Type, 2023–2035 (USD Million)
Table 42. Russia: Construction Aggregates Market, by Product Type, 2023–2035 (USD Million)
Table 43. Russia: Construction Aggregates Market, by Application, 2023–2035 (USD Million)
Table 44. Russia: Construction Aggregates Market for Infrastructure Development Market, by Type, 2023–2035 (USD Million)
Table 45. Rest of Europe: Construction Aggregates Market, by Product Type, 2023–2035 (USD Million)
Table 46. Rest of Europe: Construction Aggregates Market, by Application, 2023–2035 (USD Million)
Table 47. Rest of Europe: Construction Aggregates Market for Infrastructure Development Market, by Type, 2023–2035 (USD Million)
Table 48. Asia-Pacific: Construction Aggregates Market, by Product Type, 2023–2035 (USD Million)
Table 49. Asia-Pacific: Construction Aggregates Market, by Application, 2023–2035 (USD Million)
Table 50. Asia-Pacific: Construction Aggregates Market for Infrastructure Development Market, by Type, 2023–2035 (USD Million)
Table 51. China: Construction Aggregates Market, by Product Type, 2023–2035 (USD Million)
Table 52. China: Construction Aggregates Market, by Application, 2023–2035 (USD Million)
Table 53. China: Construction Aggregates Market for Infrastructure Development Market, by Type, 2023–2035 (USD Million)
Table 54. Japan: Construction Aggregates Market, by Product Type, 2023–2035 (USD Million)
Table 55. Japan: Construction Aggregates Market, by Application, 2023–2035 (USD Million)
Table 56. Japan: Construction Aggregates Market for Infrastructure Development Market, by Type, 2023–2035 (USD Million)
Table 57. India: Construction Aggregates Market, by Product Type, 2023–2035 (USD Million)
Table 58. India: Construction Aggregates Market, by Application, 2023–2035 (USD Million)
Table 59. India: Construction Aggregates Market for Infrastructure Development Market, by Type, 2023–2035 (USD Million)
Table 60. South Korea: Construction Aggregates Market, by Product Type, 2023–2035 (USD Million)
Table 61. South Korea: Construction Aggregates Market, by Application, 2023–2035 (USD Million)
Table 62. South Korea: Construction Aggregates Market for Infrastructure Development Market, by Type, 2023–2035 (USD Million)
Table 63. Australia: Construction Aggregates Market, by Product Type, 2023–2035 (USD Million)
Table 64. Australia: Construction Aggregates Market, by Application, 2023–2035 (USD Million)
Table 65. Australia: Construction Aggregates Market for Infrastructure Development Market, by Type, 2023–2035 (USD Million)
Table 66. Rest of Asia-Pacific: Construction Aggregates Market, by Product Type, 2023–2035 (USD Million)
Table 67. Rest of Asia-Pacific: Construction Aggregates Market, by Application, 2023–2035 (USD Million)
Table 68. Rest of Asia-Pacific: Construction Aggregates Market for Infrastructure Development Market, by Type, 2023–2035 (USD Million)
Table 69. Latin America: Construction Aggregates Market, by Product Type, 2023–2035 (USD Million)
Table 70. Latin America: Construction Aggregates Market, by Application, 2023–2035 (USD Million)
Table 71. Latin America: Construction Aggregates Market for Infrastructure Development Market, by Type, 2023–2035 (USD Million)
Table 72. Brazil: Construction Aggregates Market, by Product Type, 2023–2035 (USD Million)
Table 73. Brazil: Construction Aggregates Market, by Application, 2023–2035 (USD Million)
Table 74. Brazil: Construction Aggregates Market for Infrastructure Development Market, by Type, 2023–2035 (USD Million)
Table 75. Mexico: Construction Aggregates Market, by Product Type, 2023–2035 (USD Million)
Table 76. Mexico: Construction Aggregates Market, by Application, 2023–2035 (USD Million)
Table 77. Mexico: Construction Aggregates Market for Infrastructure Development Market, by Type, 2023–2035 (USD Million)
Table 78. Rest of Latin America: Construction Aggregates Market, by Product Type, 2023–2035 (USD Million)
Table 79. Rest of Latin America: Construction Aggregates Market, by Application, 2023–2035 (USD Million)
Table 80. Rest of Latin America: Construction Aggregates Market for Infrastructure Development Market, by Type, 2023–2035 (USD Million)
Table 81. Middle East & Africa: Construction Aggregates Market, by Product Type, 2023–2035 (USD Million)
Table 82. Middle East & Africa: Construction Aggregates Market, by Application, 2023–2035 (USD Million)
Table 83. Middle East & Africa: Construction Aggregates Market for Infrastructure Development Market, by Type, 2023–2035 (USD Million)
Table 84. Saudi Arabia: Construction Aggregates Market, by Product Type, 2023–2035 (USD Million)
Table 85. Saudi Arabia: Construction Aggregates Market, by Application, 2023–2035 (USD Million)
Table 86. Saudi Arabia: Construction Aggregates Market for Infrastructure Development Market, by Type, 2023–2035 (USD Million)
Table 87. United Arab Emirates: Construction Aggregates Market, by Product Type, 2023–2035 (USD Million)
Table 88. United Arab Emirates: Construction Aggregates Market, by Application, 2023–2035 (USD Million)
Table 89. United Arab Emirates: Construction Aggregates Market for Infrastructure Development Market, by Type, 2023–2035 (USD Million)
Table 90. Rest of Middle East & Africa: Construction Aggregates Market, by Product Type, 2023–2035 (USD Million)
Table 91. Rest of Middle East & Africa: Construction Aggregates Market, by Application, 2023–2035 (USD Million)
Table 92. Rest of Middle East & Africa: Construction Aggregates Market for Infrastructure Development Market, by Type, 2023–2035 (USD Million)
LIST OF FIGURES
Figure 1. Research Process
Figure 2. Secondary Components Referenced for This Study
Figure 3. Primary Research Techniques
Figure 4. Key Executives Interviewed
Figure 5. Breakdown of Primary Interviews (Supply Side & Demand Side)
Figure 6. Market Sizing and Growth Forecast Approach
Figure 7. In 2025, Crushed Stone to Account for the Largest Market Share
Figure 8. In 2025, Infrastructure Development to Account for the Largest Application Share
Figure 9. Asia-Pacific to be the Largest Regional Market
Figure 10. Impact Analysis of Market Dynamics
Figure 11. Global Construction Aggregates Market: Porter's Five Forces Analysis
Figure 12. Global Construction Aggregates Market, by Type, 2025 Vs. 2032 (USD Million)
Figure 13. Global Construction Aggregates Market, by Application, 2025 Vs. 2032 (USD Million)
Figure 14. Global Construction Aggregates Market, by Region, 2025 Vs. 2032 (USD Million)
Figure 15. North America: Construction Aggregates Market Snapshot (2025)
Figure 16. Europe: Construction Aggregates Market Snapshot (2025)
Figure 17. Asia-Pacific: Construction Aggregates Market Snapshot (2025)
Figure 18. Latin America: Construction Aggregates Market Snapshot (2025)
Figure 19. Middle East & Africa: Construction Aggregates Market Snapshot (2025)
Figure 20. Key Growth Strategies Adopted by Leading Players (2022–2025)
Figure 21. Global Construction Aggregates Market Competitive Benchmarking, by Product Type
Figure 22. Competitive Dashboard: Global Construction Aggregates Market
Figure 23. Global Construction Aggregates Market Share/Ranking, by Key Player, 2024 (%)
Figure 24. CRH plc: Financial Overview (2024)
Figure 25. Holcim Group: Financial Overview (2024)
Figure 26. Heidelberg Materials: Financial Overview (2024)
Figure 27. Vulcan Materials Company: Financial Overview (2024)
Figure 28. Martin Marietta Materials, Inc.: Financial Overview (2024)


Published Date: May-2025
Published Date: Oct-2024
Published Date: May-2024
Published Date: Apr-2026
Subscribe to get the latest industry updates