Resources
About Us
Industrial Wastewater Treatment Market by Offering (Treatment Technologies, Treatment Chemicals, Process Control & Automation, Design, Engineering, and Construction Services, Operation & Maintenance Services), End User, and Geography - Global Forecast to 2036
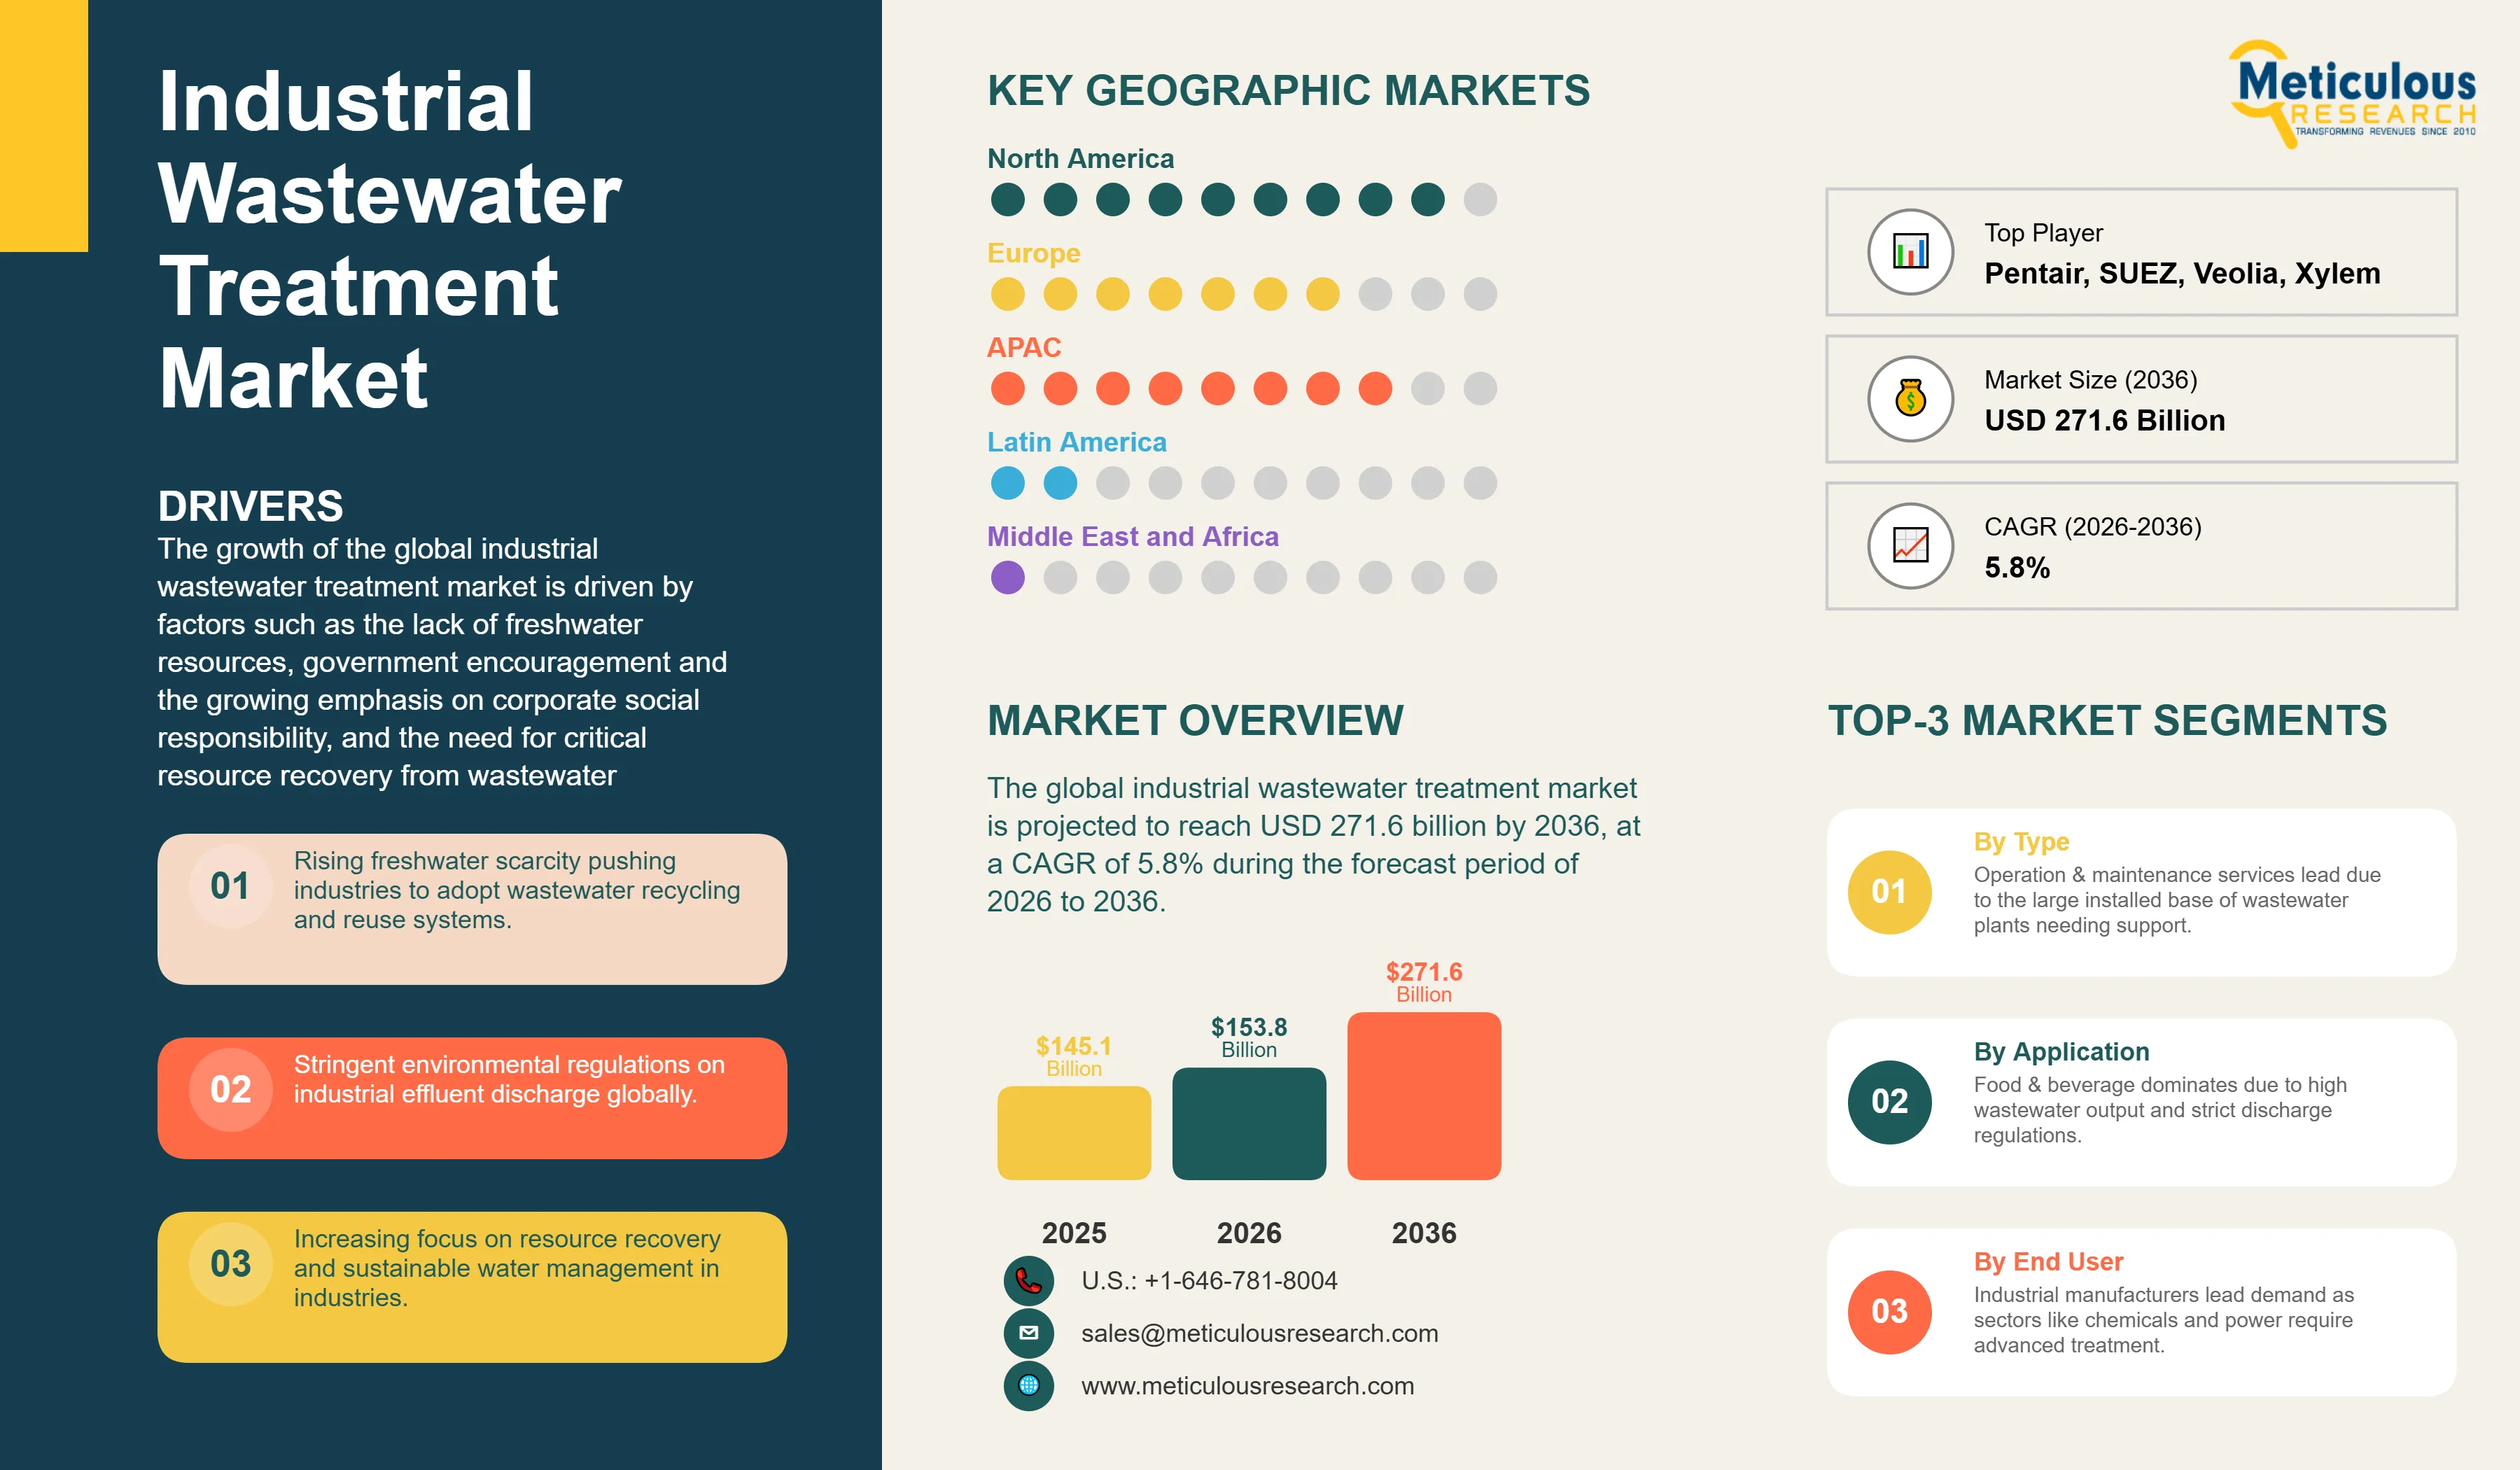
Report ID: MRCHM - 104476 Pages: 384 Mar-2026 Formats*: PDF Category: Chemicals and Materials Delivery: 24 to 48 Hours Download Free Sample ReportThe global industrial wastewater treatment market was valued at USD 145.1 billion in 2025. This market is projected to reach USD 271.6 billion by 2036 from USD 153.8 billion by 2026, at a CAGR of 5.8% during the forecast period of 2026 to 2036.
The growth of the global industrial wastewater treatment market is driven by factors such as the lack of freshwater resources, government encouragement and the growing emphasis on corporate social responsibility, and the need for critical resource recovery from wastewater. However, the high installation, maintenance, and operating costs of wastewater treatment infrastructure may restrain the growth of this market. The growing demand for energy-efficient and advanced wastewater treatment technologies and the generation of green hydrogen from industrial wastewater are expected to provide growth opportunities for market players. High energy consumption and expenditure due to excess sludge production pose a major challenge impacting market growth.
Click here to: Get Free Sample Pages of this Report
Industrial wastewater treatment refers to the processes used to treat water generated during industrial operations to remove contaminants before discharge, reuse, or resource recovery. Industrial effluents typically contain a wide range of pollutants depending on the type of industrial activity, including suspended solids, heavy metals, hydrocarbons, dissolved organic compounds, nutrients (nitrogen and phosphorus), pathogens, and emerging contaminants such as per- and polyfluoroalkyl substances (PFAS), pharmaceuticals, and microplastics. Due to the complexity and variability of industrial effluents, treatment systems generally involve multi-stage treatment processes, including physical, chemical, and biological treatment technologies designed to meet regulatory discharge standards and enable water reuse.
The industrial wastewater treatment market is evolving rapidly due to various factors. Increasingly stringent environmental regulations, rising concerns regarding water pollution, and growing freshwater scarcity are compelling industries to adopt advanced wastewater treatment solutions. In addition, industries in water-stressed regions are increasingly implementing water recycling and reuse systems to reduce freshwater consumption and ensure operational continuity.
Digitalization is also transforming wastewater treatment operations. The integration of advanced monitoring platforms, Internet of Things (IoT) sensors, supervisory control and data acquisition (SCADA) systems, and data analytics technologies is improving operational efficiency, enabling predictive maintenance, and optimizing energy consumption across treatment facilities. According to the United Nations, around 80% of global wastewater is released into the environment without adequate treatment, highlighting the significant need for expanded wastewater treatment infrastructure worldwide.
Water and wastewater treatment processes are energy-intensive. Energy consumption in treatment plants is largely driven by pumping and aeration systems, which represent the largest operational energy loads in many treatment facilities. As a result, industries are increasingly focusing on energy-efficient treatment technologies, process optimization, and automation to reduce operational costs and improve sustainability. At the same time, the market is witnessing growing collaboration between treatment technology providers, engineering companies, specialty chemical suppliers, and digital technology firms as industrial customers increasingly seek integrated solutions combining treatment technologies, process control, and operational services.
Growing Adoption of Zero Liquid Discharge (ZLD) and Near-ZLD Technologies
One of the key trends in the industrial wastewater treatment market is the increasing adoption of zero liquid discharge (ZLD) and near-ZLD technologies, especially in water-stressed regions and industries subject to stringent discharge regulations. ZLD systems are designed to eliminate liquid effluent discharge by recovering up to 95–99% of wastewater for reuse while converting the remaining concentrate into solid waste.
Industries such as power generation, textiles, pharmaceuticals, chemicals, and semiconductor manufacturing are increasingly adopting ZLD systems to meet regulatory compliance requirements and reduce freshwater consumption. In several regions, including parts of Asia-Pacific and the Middle East, industrial facilities are increasingly required to implement advanced water recovery systems to minimize wastewater discharge.
Modern ZLD systems typically integrate multiple treatment stages, including membrane filtration (UF/RO), evaporation technologies such as mechanical vapor recompression (MVR), and crystallization processes to maximize water recovery. As water scarcity and regulatory pressures intensify, the adoption of ZLD systems is expected to increase across several industrial sectors.
Growing Demand for Advanced Membrane Treatment Technologies
Another key trend driving the industrial wastewater treatment market is the growing adoption of advanced membrane technologies, including reverse osmosis (RO), ultrafiltration (UF), nanofiltration (NF), microfiltration (MF), and membrane bioreactors (MBR). These technologies offer several advantages compared with conventional treatment methods, including higher contaminant removal efficiency, smaller system footprint, and the ability to produce high-quality effluent suitable for industrial reuse applications. As a result, membrane technologies are increasingly used in industries such as electronics, pharmaceuticals, chemicals, food processing, and power generation.
Membrane bioreactor (MBR) systems, combining biological treatment with membrane filtration, are gaining wider adoption due to their ability to produce consistent, high-quality treated water while reducing sludge generation and improving process efficiency. In addition, continuous technological innovations aimed at improving membrane durability, reducing fouling, and lowering energy consumption are further driving the adoption of membrane-based wastewater treatment systems.
|
Report Coverage |
Details |
|
Market Size (Value) by 2036 |
USD 271.6 Billion |
|
Market Size (Value) in 2025 (Estimated) |
USD 145.1 Billion |
|
Market Size (Value) in 2026 |
USD 153.8 Billion |
|
Market Growth Rate (Value, 2026-2036) |
CAGR of 5.8% |
|
Base Year |
2025 |
|
Forecast Period |
2026 to 2036 |
|
Dominating Region |
North America (largest share in 2026) |
|
Fastest Growing Region |
Asia-Pacific (highest CAGR during forecast period) |
|
Dominating Offering Segment |
Operation & Maintenance Services (largest share in 2026) |
|
Fastest Growing Offering Segment |
Process Control & Automation (highest CAGR during forecast period) |
|
Dominating End User Segment |
Food & Beverage (largest share in 2026; also highest CAGR) |
|
Segments Covered |
By Offering: Operation & Maintenance Services; Process Control & Automation; Design, Engineering, and Construction Services; Treatment Technologies (Membrane Separation & Filtration [RO, UF, MF, NF, Other]; Sludge Management; Activated Sludge; Clarification; Activated Carbon [Granular, Powdered, Other]; Moving Bed Biofilm Reactor; Chlorination; Membrane Bioreactor; Ion Exchange; UV & Ozone; Dissolved Air Flotation; Other Treatment Technologies); Treatment Chemicals | By End User: Food & Beverage; Power Generation; Pharmaceutical Manufacturing; Pulp & Paper; Chemical Manufacturing; Oil & Gas; Refining & Petrochemicals; Industrial Manufacturing (Automotive, Heavy, and Metal Industries); Semiconductor Manufacturing; Data Centers; Green Hydrogen Generation; Other End Users |
|
Countries Covered |
North America (U.S., Canada); Europe (Germany, U.K., France, Italy, Spain, Poland, Belgium, Switzerland, Denmark, Sweden, Rest of Europe); Asia-Pacific (China, India, Japan, South Korea, Indonesia, Australia, Malaysia, Thailand, Vietnam, Philippines, Singapore, New Zealand, Taiwan, Rest of Asia-Pacific); Latin America (Brazil, Mexico, Chile, Argentina, Rest of Latin America); Middle East & Africa (Saudi Arabia, UAE, Kuwait, South Africa, Iran, Rest of MEA) |
Operation & Maintenance Services Dominate; Process Control & Automation Registers Highest CAGR
Based on offering, the overall industrial wastewater treatment market is segmented into operation & maintenance (O&M) services, process control & automation, design, engineering, and construction (DEC) services, treatment technologies, and treatment chemicals. In 2026, the O&M services segment is poised to account for the largest share of the global market, driven by the large installed base of industrial wastewater treatment facilities globally requiring ongoing operational expertise, personnel, consumables, and maintenance services. O&M contracts provide treatment technology vendors with recurring, resilient revenue streams across the full operational lifetime of treatment assets.
However, the process control & automation segment is projected to grow at the fastest CAGR during the forecast period. The growth of this segment is attributed to the rising technological complexities in industrial wastewater treatment facilities, the increasing need for operational automation to reduce labor costs and improve treatment reliability, the growing number of investments in process control and SCADA systems, and the focus of industrial companies on achieving cost and energy savings targets. AI-powered chemical dosing systems, predictive maintenance platforms, IoT-enabled monitoring networks, and digital twin optimization tools are driving rapid adoption of process automation in industrial treatment facilities.
Food & Beverage: Dominant End User with Highest CAGR
Based on end user, the global industrial wastewater treatment market is segmented into food & beverage, power generation, pharmaceutical manufacturing, pulp & paper, chemical manufacturing, oil & gas, refining & petrochemicals, industrial manufacturing (automotive, heavy, and metal industries), semiconductor manufacturing, data centers, green hydrogen generation, and other end users. In 2026, the food & beverage segment is expected to account for the largest share of the market and is also projected to grow at the fastest CAGR during the forecast period.
The food & beverage industry is one of the major contributors to global economic growth and generates a huge amount of wastewater with relatively high concentrations of total suspended solids (TSS), biological oxygen demand (BOD), and chemical oxygen demand (COD), making it one of the largest sources of industrial environmental pollution. Food production is expected to increase significantly in the coming years due to global population growth. The industry requires large volumes of water for production, cleaning, and sanitation. Food & beverage companies are adopting industrial wastewater treatment techniques, including proper screening of waste streams to increase discharge dryness, resulting in lower hauling and waste disposal costs. The dairy and beverage sector, particularly in China and India, is generating substantial investment opportunities in the Asia-Pacific, thereby driving significant demand for water and wastewater treatment technologies.
North America: Largest Market for Industrial Wastewater Treatment
North America is expected to account for the largest share of the global industrial wastewater treatment market in 2026, driven by stringent environmental regulations, a well-established industrial base, and a large installed base of treatment infrastructure requiring ongoing upgrades and operational services.
In the U.S., regulatory frameworks administered by the U.S. Environmental Protection Agency (EPA) enforce strict industrial discharge standards under the Clean Water Act, including sector-specific effluent limitation guidelines. In addition, the EPA finalized national drinking water standards for six PFAS compounds in April 2024, driving increased investments in advanced treatment technologies such as granular activated carbon (GAC), ion exchange, and membrane filtration across several industrial sectors.
The region also witnesses strong adoption of industrial water reuse and recycling systems, particularly in water-stressed states such as California, Texas, and Colorado. The presence of leading water technology companies, such as Xylem, Ecolab, Pentair, DuPont, Dow, and Calgon Carbon, further strengthens the position of this region as a major market for industrial wastewater treatment solutions.
Asia-Pacific: Fastest-Growing Regional Market
The Asia-Pacific water and wastewater treatment market is expected to grow at the fastest CAGR during the forecast period, driven by rapid industrialization, rising environmental concerns, and increasing investments in water treatment infrastructure.
China and India are the largest markets in the region, driven by large manufacturing sectors and strengthening environmental enforcement. China’s Water Pollution Prevention and Control Action Plan (Water Ten Plan) has significantly tightened industrial wastewater discharge standards, while regulatory enforcement by India’s National Green Tribunal (NGT) has increased compliance pressure on industrial facilities.
Rapid industrial expansion in South Korea, Indonesia, Vietnam, and Thailand is also contributing to growing demand for industrial wastewater treatment solutions. In addition, high-tech manufacturing sectors, particularly semiconductor fabrication in Taiwan, South Korea, and China, require advanced water purification and wastewater treatment systems capable of producing ultra-high purity water and enabling high levels of water reuse.
Increasing adoption of zero liquid discharge (ZLD) systems in industries such as power generation, textiles, and chemicals further drives the growth of water and wastewater treatment in the Asia-Pacific region.
Europe: Mature Market for Water and Wastewater Treatment with Strong Regulatory Framework
Europe is a mature but evolving market for industrial wastewater treatment, driven by a comprehensive environmental regulatory framework and increasing focus on water reuse and circular water management.
The revised EU Urban Wastewater Treatment Directive adopted in 2024 strengthens wastewater treatment requirements across member states, including stricter standards for nutrient removal and emerging contaminants. In addition, the EU REACH framework and ongoing PFAS restriction proposals are expected to increase compliance requirements for several industrial sectors.
Countries such as Germany, France, the U.K., Italy, Spain, and Poland are the largest markets in the region due to their strong industrial bases and advanced environmental regulatory enforcement.
The region is also witnessing growing investments in water reuse and circular water economy initiatives, particularly in industries with high water consumption.
The global industrial wastewater treatment market is moderately competitive, with various companies, including integrated environmental services providers, water technology companies, specialty chemical suppliers, and engineering & construction firms. These companies focus on strategic partnerships, acquisitions, technological innovations, and service expansion to strengthen their market positions.
Xylem Inc. is one of the leading water technology providers globally. The company strengthened its industrial water treatment capabilities through the USD 7.5 billion acquisition of Evoqua Water Technologies completed in May 2023, creating one of the largest pure-play water technology companies. The combined entity offers a broad portfolio of membrane treatment technologies, biological treatment systems, PFAS remediation solutions, and digital water management platforms, including the Xylem Vue platform.
Veolia Environnement S.A. is a global leader in integrated water management solutions, providing design, engineering, operation, and maintenance services for industrial wastewater treatment systems. The company strengthened its industrial water treatment portfolio through the integration of Water Technologies & Solutions (WTS) and continues to invest in advanced treatment technologies such as membrane bioreactors and digital water management solutions.
SUEZ S.A. is another major player in the market, offering industrial water treatment technologies and services, such as membrane filtration, biological treatment systems, and industrial water recycling solutions. The company serves a wide range of industries, including chemicals, pharmaceuticals, and power generation.
Pentair plc provides filtration and separation technologies used in industrial water treatment applications. The company has expanded its filtration portfolio through strategic acquisitions, including Porous Media Corporation and G&F Manufacturing.
Several chemical companies also play an important role in the industrial wastewater treatment market. Ecolab Inc., BASF SE, and Kemira Oyj supply specialty water treatment chemicals and process optimization solutions for industrial treatment systems. These companies increasingly integrate digital monitoring and process control technologies to improve water and energy efficiency.
Membrane technology suppliers such as DuPont de Nemours, Inc. and Dow Inc. provide advanced reverse osmosis, ultrafiltration, and nanofiltration membranes used in industrial water treatment systems.
In addition, engineering and project development firms, such as Burns & McDonnell and WSP Global, provide engineering, procurement, and construction (EPC) services for large industrial water and wastewater treatment projects.
Several regional companies also play an important role in specific markets. For example, Thermax Limited and WOG Technologies are prominent providers of industrial wastewater treatment systems in India and other emerging markets.
Industrial Wastewater Treatment Market Assessment – by Offering
• Operation & Maintenance (O&M) Services
• Process Control & Automation
• Design, Engineering, and Construction Services
• Treatment Technologies
• Membrane Separation & Filtration
• Reverse Osmosis (RO) Membranes
• Ultrafiltration (UF) Membranes
• Microfiltration (MF) Membranes
• Nanofiltration (NF) Membranes
• Other Filtration Technologies
• Sludge Management
• Activated Sludge
• Clarification
• Activated Carbon
• Granular Activated Carbon
• Powdered Activated Carbon
• Other Activated Carbon Technologies
• Moving Bed Biofilm Reactor (MBBR)
• Chlorination
• Membrane Bioreactor (MBR)
• Ion Exchange
• UV & Ozone Treatment
• Dissolved Air Flotation (DAF)
• Other Treatment Technologies
• Treatment Chemicals
Industrial Wastewater Treatment Market Assessment – by End User
• Food & Beverage
• Power Generation
• Pharmaceutical Manufacturing
• Pulp & Paper
• Chemical Manufacturing
• Oil & Gas
• Refining & Petrochemicals
• Industrial Manufacturing (Automotive, Heavy, and Metal Industries)
• Semiconductor Manufacturing
• Data Centers
• Green Hydrogen Generation
• Other End Users
Industrial Wastewater Treatment Market Assessment – by Geography
• Asia-Pacific
• China
• India
• Japan
• South Korea
• Indonesia
• Australia
• Malaysia
• Thailand
• Vietnam
• Philippines
• Singapore
• New Zealand
• Taiwan
• Rest of Asia-Pacific
• Europe
• Germany
• U.K.
• France
• Italy
• Spain
• Poland
• Belgium
• Switzerland
• Denmark
• Sweden
• Rest of Europe
• North America
• U.S.
• Canada
• Latin America
• Brazil
• Mexico
• Chile
• Argentina
• Rest of Latin America
• Middle East & Africa
• Saudi Arabia
• UAE
• Kuwait
• South Africa
• Iran
• Rest of Middle East & Africa
This report analyzes the global industrial wastewater treatment market based on offering, end user, and geography. The study also evaluates the competitive landscape and provides country-level market analysis.
The global industrial wastewater treatment market was valued at USD 145.1 billion in 2025 and is projected to reach USD 271.6 billion by 2036 from USD 153.8 billion in 2026, at a CAGR of 5.8% during the forecast period (2026–2036).
Based on offering, the operation & maintenance (O&M) services segment is expected to account for the largest share of the global industrial wastewater treatment market in 2026 due to the large installed base of treatment facilities requiring ongoing operational support.
Based on end user, the food & beverage segment is expected to account for the largest share of the global industrial wastewater treatment market in 2026 due to the high wastewater generation intensity of food processing operations and increasingly stringent discharge regulations.
Key growth drivers include increasing water scarcity driving industrial water reuse, stringent environmental discharge regulations, rising adoption of advanced treatment technologies, and growing emphasis on sustainable water management and resource recovery.
Key players operating in the global industrial wastewater treatment market include Xylem Inc., Veolia Environnement S.A., SUEZ S.A., Pentair plc, Ecolab Inc., Kurita Water Industries, Ltd., Kemira Oyj, BASF SE, Dow Inc., DuPont de Nemours, Inc., Calgon Carbon Corporation, Trojan Technologies, Thermax Limited, WOG Technologies, Clean TeQ Water Limited, SWA Water Australia Pty Limited, and Burns & McDonnell, among others.
Asia-Pacific is expected to register the highest CAGR during the forecast period, driven by rapid industrialization, increasing water stress, strengthening environmental regulations, and growing adoption of advanced wastewater treatment technologies across countries such as China, India, South Korea, and Vietnam.


Please enter your corporate email id here to view sample report.
Subscribe to get the latest industry updates