Resources
About Us
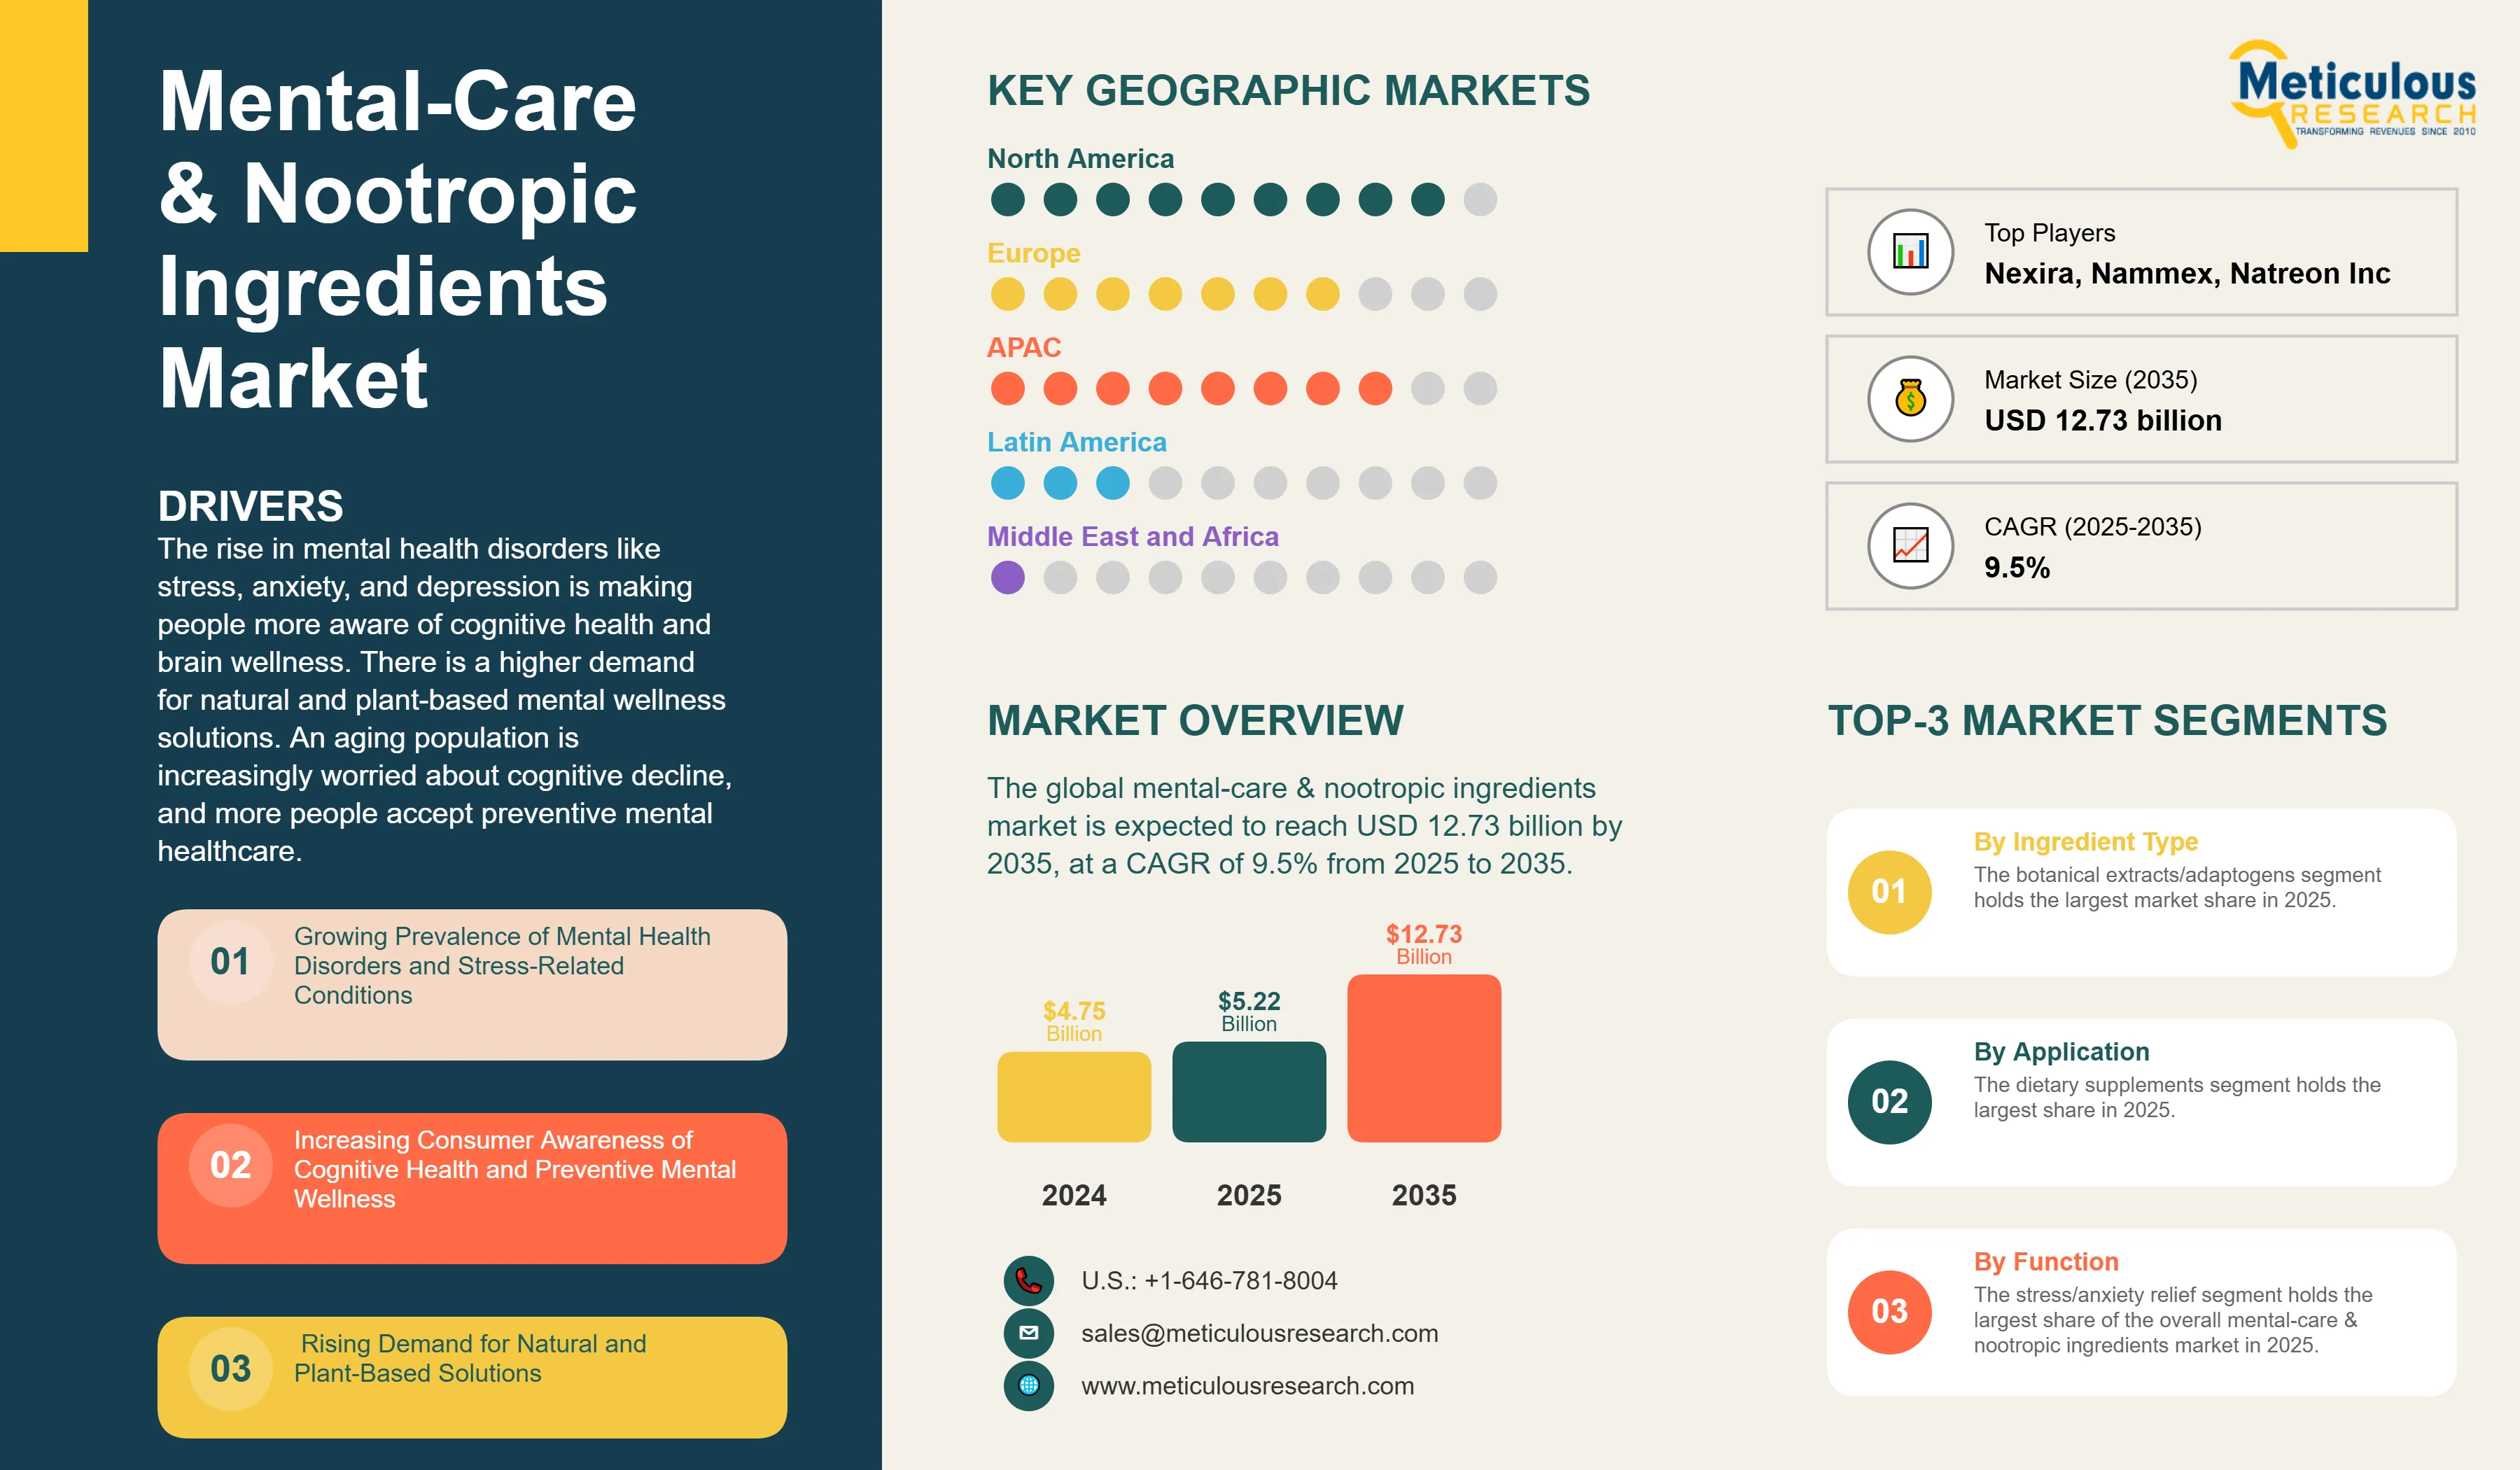
Mental-Care & Nootropic Ingredients Market Size & Forecast
The global mental-care & nootropic ingredients market is projected to reach USD 12.72 billion by 2035 from an estimated USD 5.07 billion in 2025, at a CAGR of 9.6% during the forecast period from 2025 to 2035.
Mental-care and nootropic ingredients are specialized compounds that support cognitive function, emotional well-being, and mental performance through different neurobiological processes. These ingredients include plant extracts, adaptogens, amino acids, vitamins, minerals, omega-3 fatty acids, probiotics that target the gut-brain connection, and synthetic nootropics aimed at improving memory, focus, stress resilience, and overall brain health. The increasing awareness of mental wellness as a key part of overall health, along with the rise of stress-related disorders and concerns about cognitive health, has made these ingredients essential in dietary supplements, functional foods and beverages, and pharmaceutical products.
Key factors driving this market include the rise in mental health disorders and stress-related issues, growing consumer awareness of cognitive health and preventive mental wellness, increased demand for natural and plant-based options, expanding clinical validation and acceptance of mental wellness claims, and the rising use of nootropic ingredients in functional foods and drinks. According to the World Health Organization, over 1 billion people globally are living with mental health conditions, with anxiety and depression being the most common. The economic impact is significant; depression and anxiety cost the global economy an estimated USD 1 trillion each year in lost productivity.
The COVID-19 pandemic worsened mental health issues worldwide. Estimates show a 26% rise in depression and a 28% increase in anxiety disorders during this time, leading to ongoing demand for cognitive support products. From 2018 to 2022, the number of published papers referencing the gut-brain axis more than doubled. This shows growing scientific interest in psychobiotics and the microbiome's role in mental wellness. Research shows that 66% of global consumers actively look for cognitive health products. This marks a shift from treating problems reactively to managing cognitive wellness proactively.
With the growing research on the gut-brain axis and psychobiotic innovation, more people are adopting personalized nutrition for cognitive health. There is also a rise in functional beverages and increasing clinical support for mental wellness ingredients. As a result, the mental-care and nootropic ingredients market is expected to grow significantly. This growth is fueled by wellness trends, scientific progress, and a shift toward preventive mental health management in a world that is becoming more stressful.
Click here to: Get Free Sample Copy of this report
Growing Prevalence of Mental Health Disorders and Stress-Related Conditions
The rising global challenge of mental health disorders is a key factor driving the market for mental-care and nootropic ingredients. According to the World Health Organization's 2024 data, nearly 1 in every 7 people (about 1.1 billion) worldwide live with a mental disorder. Anxiety disorders affect 359 million people, while depressive disorders impact 280 million globally. Mental health issues are common in all countries and communities, affecting people of all ages and income levels.
The COVID-19 pandemic worsened mental health problems globally. It caused a 25% increase in cases of anxiety and depression, leading to more interest in natural remedies for mental wellness. The lasting effects of the pandemic continue to shape consumer behavior. More people are aware of the importance of mental health, which has increased the demand for cognitive support products. Suicide remains a tragic outcome of mental health issues, claiming an estimated 727,000 lives in 2021 and ranking as a leading cause of death among young people.
Modern lifestyle factors like workplace stress, academic pressure, digital overload, and multitasking are contributing to rising concerns about cognitive health. The occurrence of neurological disorders, such as dementia and Alzheimer's disease, is increasing as the global population ages. In Brazil alone, 1.8 million people currently have dementia, a number that is expected to reach 5.6 million by 2050. These demographic and lifestyle changes are creating strong and growing demand for mental-care ingredients in dietary supplements, functional foods, and pharmaceutical applications. This positions mental wellness solutions as essential parts of preventive healthcare strategies.
Increasing Consumer Awareness of Cognitive Health and Preventive Mental Wellness
There is a growing consumer awareness regarding cognitive health and preventive mental wellness. This change is fundamentally shifting demand in the mental-care and nootropic ingredients market. Research shows that 66% of global consumers actively look for cognitive health products. Many prioritize mental health and seek natural solutions. This represents a shift from reactive treatment to proactive cognitive wellness management.
The destigmatization of mental health discussions has helped normalize the use of supplements for cognitive support, aided by public health campaigns and celebrity advocacy. The WHO identifies mental disorders as a leading cause of global disability and highlights the close link between mental and physical health in its public health frameworks. More consumers understand that caring for mental health from an early age is key to long-term well-being. This awareness is especially strong among younger demographics. Gen Z and Millennials show significant interest in cognitive enhancement and mental performance improvement.
The spread of educational content through digital platforms, social media influencers, and health-focused media has increased consumers' knowledge about specific cognitive-enhancing ingredients. Consumers are becoming more familiar with adaptogens like ashwagandha and rhodiola, nootropic compounds such as bacopa and lion's mane mushroom, and traditional cognitive-support ingredients like ginkgo biloba and phosphatidylserine. This knowledge helps them make more informed purchasing decisions and increases demand for clinically validated, high-quality formulations.
The self-care movement and biohacking culture have boosted interest in cognitive enhancement, especially among professionals, students, and entrepreneurs seeking an edge in competitive environments. This growing awareness is contributing to continuous market growth, as cognitive wellness becomes a part of mainstream health practices.
Rising Demand for Natural and Plant-Based Solutions
Consumer preference for natural, plant-based, and clean-label products is a key driver in the mental-care and nootropic ingredients market. In 2024, over 62% of global consumers favored herbal or plant-based supplements. This trend is especially strong in cognitive health, where worries about synthetic compounds and pharmaceutical side effects affect buying choices. Natural products captured a significant market share in 2024, fueled by consumer demand for health and wellness options viewed as gentle and safe.
Traditional medicine systems like Ayurveda, Traditional Chinese Medicine, and indigenous healing practices have offered validated botanical ingredients that appeal to today's consumers looking for natural solutions. Ayurvedic nootropics such as Bacopa monnieri (Brahmi), Ashwagandha, and Shankhpushpi have scientific backing for their cognitive benefits while also maintaining cultural significance. India produces about 85% of the global ashwagandha supply, grown on more than 14,000 hectares, highlighting the strong demand for traditional cognitive-support plants.
The clean-label movement has reached cognitive health products, with consumers wanting clear ingredient sourcing, organic certifications, and minimal processing. European consumers, in particular, show a strong preference for vegan, gluten-free, and sustainably sourced nootropic ingredients, with around 49% prioritizing herbal origins in their cognitive supplement choices. Market research shows that consumers of functional products place a high priority on ingredient quality over taste, favoring natural ingredients like ginkgo biloba and essential vitamins instead of synthetic options. Adaptogenic ingredients such as ashwagandha, reishi mushrooms, and lion's mane are becoming common in cognitive health formulas, reflecting growing consumer interest in holistic wellness.
Expanding Clinical Validation and Regulatory Acceptance of Mental Wellness Claims
Growing investment in clinical research and expanding regulatory pathways for mental wellness claims create significant opportunities for the nootropic ingredients market. Major ingredient suppliers and pharmaceutical companies are increasing their funding in clinical trials to prove cognitive health benefits, allowing for differentiation among scientifically validated ingredients. Companies focused on research, clinical validation, and quality control can establish themselves as credible leaders in the nootropics category.
Regulatory changes in key markets are opening new avenues for approved mental wellness claims. Health Canada has allowed certain probiotic strains to make claims related to stress reduction and cognitive function, setting a precedent for psychobiotic claims. Japan's Foods for Specified Health Uses (FOSHU) labeling system permits cognitive health claims for approved functional ingredients, creating a regulatory route that aids product differentiation and premium positioning.
The emerging field of psychobiotics, which targets the gut-brain axis through probiotic supplementation, is showing strong clinical evidence supporting mental health applications. Leading probiotic strains like Lactobacillus rhamnosus and Bifidobacterium longum 1714 have proven effective in clinical trials for stress, anxiety, and cognitive function. Health Canada approved gut-brain axis claims for Lallemand's Cerebiome®, stating that it "helps moderate general feelings of anxiety" and "promotes healthy mood balance." This shows regulatory acceptance of psychobiotic mental wellness claims.
Academic and government research efforts are improving our understanding of cognitive health ingredients. The U.S. government's Healthy Brain Initiative provides a plan for addressing brain health and incorporating cognitive wellness into public health practices. The World Health Organization has adopted Global Action Plans on mental health and neurological disorders, requiring member states to develop national brain strategies by 2030-31. These initiatives create a positive environment for ingredient development and market growth.
By Ingredient Type: The Botanical Extracts/Adaptogens Segment Dominated the Mental-Care & Nootropic Ingredients Market in 2025
Based on ingredient type, the mental-care and nootropic ingredients market is divided into botanical extracts, amino acids, vitamins and minerals, omega-3s and lipids, probiotics and microbiome-based ingredients, synthetic nootropics, and others. In 2025, the botanical extracts segment held the largest share at 32.4% of the mental-care and nootropic ingredients market. This large market share comes from the rising consumer preference for natural and plant-based solutions for managing stress, enhancing cognitive function, and improving emotional well-being. More scientific support for traditional adaptogenic herbs like ashwagandha, rhodiola, ginseng, and lion's mane mushroom, along with the increasing popularity of Ayurvedic and traditional medicine globally, also helps this segment’s growth.
The clean-label trend and consumer preference for botanical ingredients over synthetic options continue to boost demand. For example, ashwagandha makes up a significant part of the adaptogenic ingredients market, with India producing about 85% of the global supply from over 14,000 hectares.
On the other hand, the probiotics and microbiome-based segment is expected to show the highest CAGR of 13.5% during the forecast period. This growth mainly comes from expanding research and clinical evidence supporting the connection between the gut and brain, rising consumer awareness of psychobiotics for mental wellness, and the emergence of new probiotic strains designed to influence neurotransmitter production and stress response.
By Function: The Stress/Anxiety Relief Segment Dominated the Mental-Care & Nootropic Ingredients Market in 2025
Based on function, the mental care and nootropic ingredients market is divided into several categories: stress and anxiety relief, mood enhancement and emotional well-being, cognitive performance, neuroprotection and brain health, sleep and recovery, and energy and mental fatigue. In 2025, the stress and anxiety relief segment made up the largest share at 26.1% of the market. This segment's size shows the widespread effects of chronic stress on today's population and the increasing preference for natural, non-drug options for managing stress.
The World Health Organization reports that the COVID-19 pandemic led to a 25% rise in anxiety and depression cases worldwide. This surge has greatly increased consumer interest in natural ways to improve mental wellness. Ingredients such as ashwagandha, rhodiola rosea, L-theanine, GABA, and magnesium are common in this segment. Clinical studies show these ingredients can help balance cortisol levels and support healthy stress responses.
Meanwhile, the sleep and recovery segment is experiencing the fastest growth, with a compound annual growth rate (CAGR) of 10.8%. Quality sleep is now recognized as a key part of mental health and cognitive performance. More people are becoming aware of the connection between poor sleep, anxiety, depression, burnout, and lower productivity. This awareness drives consumers to look for targeted solutions to support sleep.
By Application: The Dietary Supplements Segment Dominated the Mental-Care & Nootropic Ingredients Market in 2025
Based on application, the mental-care and nootropic ingredients market is divided into dietary supplements, functional foods and beverages, personal care or nutraceutical cosmetics, pharmaceuticals for clinical mental health use, sports nutrition, and others. In 2025, the dietary supplements segment held the largest share, accounting for 44.5% of the mental-care and nootropic ingredients market. This growth is due to a strong supplement industry, high consumer awareness of cognitive health benefits, and a rising preference for convenient, encapsulated delivery formats that provide precise dosing and standardized ingredient concentrations.
The global dietary supplements market reached USD 133.77 billion in 2024. It is expected to grow at a rate of 4.9% each year through 2032, with brain health supplements becoming one of the fastest-growing categories in this area. The rising number of cognitive health concerns worldwide, especially among older populations looking to maintain mental sharpness and prevent age-related cognitive decline, continues to drive this demand.
On the other hand, the functional foods and beverages segment is anticipated to see the highest growth rate at 11.7% during the forecast period. This increase is mainly due to more consumers seeking health benefits in their daily consumption, the rising need for convenient on-the-go options, and the continued innovation in adaptogenic and nootropic-infused beverage formulas.
By Distribution Channel: The Direct Sales to Manufacturers Segment Dominated the Mental-Care & Nootropic Ingredients Market in 2025
Based on distribution channel, the mental-care and nootropic ingredients market is divided into direct sales to manufacturers, distributors, ingredient brokers, online B2B platforms, and others. In 2025, the direct sales to manufacturers segment held the largest share at 41.1% of the mental-care and nootropic ingredients market. This is due to the removal of intermediary costs, the ability to provide customized ingredient solutions for specific manufacturer needs, and the established relationships between major ingredient suppliers and large nutraceutical and pharmaceutical manufacturers.
The direct sales model provides significant benefits in terms of customization and technical support. Ingredient suppliers work directly with manufacturers to deliver tailored solutions. These include custom particle sizes, specialized extraction methods, proprietary blends, and application-specific standardization levels.
However, the online B2B platforms segment is expected to have the highest compound annual growth rate (CAGR) of 13.7% during the forecast period. This growth is mainly fueled by the digital shift in ingredient sourcing processes. Additionally, online platforms offer convenience and accessibility for small and medium-sized manufacturers, along with increasing access to detailed product information, certifications, and documentation through digital channels.
North America Dominated the Mental-Care & Nootropic Ingredients Market in 2025
Based on geography, the mental-care and nootropic ingredients market is divided into North America, Europe, Asia-Pacific, Latin America, and the Middle East and Africa. In 2025, North America held the largest share of 33.5% of the global mental-care and nootropic ingredients market. North America's leading position comes from high consumer awareness about cognitive health, a strong wellness culture, the presence of major market players, supportive regulations that assist product development and market access, and high consumer spending power.
The U.S. leads the global nootropics market, thanks to its strong health and wellness industry. About 60% of the adult population takes dietary supplements. The well-developed retail infrastructure, which includes both physical stores with dedicated nootropic sections and advanced e-commerce platforms, ensures wide product availability for various demographic groups. Additionally, the region's vibrant biohacking culture and growing interest in cognitive improvement among students, professionals, and entrepreneurs have broadened the customer base beyond typical supplement users.
However, Asia-Pacific is projected to have the highest compound annual growth rate of 11.4% during the forecast period. This rapid growth is fueled by increasing urbanization, a rise in health awareness among the growing middle class, a higher prevalence of mental health issues, the blending of traditional herbal knowledge with modern nootropic products, and significant growth of e-commerce platforms that improve access to cognitive health products. Countries like China, India, Japan, and South Korea are emerging as key growth centers in the Asia-Pacific market.
Key Companies
Major companies in the global mental-care & nootropic ingredients market have implemented various strategies to expand their product offerings and augment their market shares. The key strategies followed by most companies include clinical validation and research investment, product launch and enhancement, collaboration, partnership and agreement, and others (acquisition, vertical integration, and sustainable sourcing initiatives).
Some of the prominent players operating in the global mental-care & nootropic ingredients market include Sabinsa Corporation (U.S.), Arjuna Natural Pvt. Ltd. (India), Ixoreal Biomed Inc. (India), Natreon Inc. (U.S.), Kyowa Hakko Bio Co. Ltd. (Japan), DSM-Firmenich (Switzerland), Chr. Hansen Holding A/S - Novonesis (Denmark), Glanbia Nutritionals (Ireland), Verdure Sciences (U.S.), Nexira (France), and Nammex (Canada).
|
Particulars |
Details |
|
Number of Pages |
369 |
|
Format |
|
|
Forecast Period |
2025–2035 |
|
Base Year |
2024 |
|
CAGR (Value) |
9.6% |
|
Market Size (Value) in 2025 |
USD 5.07 Billion |
|
Market Size (Value) in 2035 |
USD 12.72 Billion |
|
Segments Covered |
By Ingredient Type
By Function
By Application
By Distribution Channel
|
|
Countries Covered |
North America (U.S., Canada), Europe (Germany, France, U.K., Italy, Spain, and Rest of Europe), Asia-Pacific (China, India, Japan, South Korea, Australia, and Rest of Asia-Pacific), Latin America (Brazil, Mexico, Argentina, and Rest of Latin America), and the Middle East & Africa (Saudi Arabia, UAE, and Rest of Middle East & Africa) |
|
Key Companies |
Sabinsa Corporation (U.S.), Arjuna Natural Pvt. Ltd. (India), Ixoreal Biomed Inc. (India), Natreon Inc. (U.S.), Kyowa Hakko Bio Co. Ltd. (Japan), DSM-Firmenich (Switzerland), Chr. Hansen Holding A/S - Novonesis (Denmark), Glanbia Nutritionals (Ireland), Verdure Sciences (U.S.), Nexira (France), and Nammex (Canada) |
The global mental-care & nootropic ingredients market size is projected to reach USD 5.07 billion in 2025.
The market is projected to grow from USD 5.07 billion in 2025 to USD 12,724.9 million by 2035, at a CAGR of 9.6%.
The mental-care & nootropic ingredients market analysis indicates substantial growth, with projections indicating the market will reach USD 12.72 billion by 2035, at a compound annual growth rate (CAGR) of 9.6% from 2025 to 2035.
The key companies operating in this market include Sabinsa Corporation (U.S.), Arjuna Natural Pvt. Ltd. (India), Ixoreal Biomed Inc. (India), Natreon Inc. (U.S.), Kyowa Hakko Bio Co. Ltd. (Japan), DSM-Firmenich (Switzerland), Chr. Hansen Holding A/S - Novonesis (Denmark), Glanbia Nutritionals (Ireland), Verdure Sciences (U.S.), Nexira (France), and Nammex (Canada).
Gut-brain axis and psychobiotic innovation, functional beverage expansion and nootropic coffee alternatives, and personalized nutrition approaches for cognitive health are prominent trends in the mental-care & nootropic ingredients market.
By ingredient type, the botanical extracts/adaptogens segment is forecasted to hold the largest market share during 2025-2035; by function, the stress/anxiety relief segment is expected to dominate; by application, the dietary supplements segment is expected to hold the largest share; by distribution channel, the direct sales to manufacturers segment is expected to dominate; and by geography, North America is expected to hold the largest share of the market during 2025-2035.
By region, North America held the largest share of the mental-care & nootropic ingredients market in 2025. The large share is attributed to high consumer awareness regarding cognitive health, a well-established wellness culture, and strong consumer spending power. However, Asia-Pacific is expected to register the highest growth rate during the forecast period, driven by increasing urbanization and integration of traditional herbal knowledge with modern nootropic formulations.
Key drivers include the growing prevalence of mental health disorders and stress-related conditions, increasing consumer awareness of cognitive health and preventive mental wellness, rising demand for natural and plant-based solutions, expanding clinical validation and regulatory acceptance of mental wellness claims, and the growing integration of nootropic ingredients into functional beverages and foods. These factors are collectively driving the adoption of mental-care ingredients across applications.
1. Introduction
1.1. Market Definition & Scope
1.2. Currency & Limitations
2. Research Methodology
2.1. Research Approach
2.2. Data Collection & Validation
2.2.1. Secondary Research
2.2.2. Primary Research
2.3. Market Assessment
2.3.1. Market Size Estimation
2.3.2. Bottom-Up Approach
2.3.3. Top-Down Approach
2.3.4. Growth Forecast
2.4. Assumptions For the Study
3. Executive Summary
4. Market Insights
4.1. Overview
4.2. Drivers
4.2.1. Growing Prevalence of Mental Health Disorders and Stress-Related Conditions
4.2.2. Increasing Consumer Awareness of Cognitive Health and Preventive Mental Wellness
4.2.3. Rising Demand for Natural and Plant-Based Solutions
4.3. Restraints
4.3.1. Regulatory Variability and Claim Restrictions Across Markets
4.3.2. Limited Clinical Evidence for Some Emerging Ingredients
4.4. Opportunities
4.4.1. Expanding Clinical Validation and Regulatory Acceptance of Mental Wellness Claims
4.4.2. Growing Functional Beverage and Food Integration
4.5. Challenges
4.5.1. Quality Control and Standardization Issues
4.5.2. Supply Chain and Raw Material Sourcing Challenges
4.6. Trends
4.6.1. Gut-Brain Axis and Psychobiotic Innovation
4.6.2. Functional Beverage Expansion and Nootropic Coffee Alternatives
4.7. Porter's Five Forces Analysis
4.7.1. Threat Of New Entrants
4.7.2. Bargaining Power of Suppliers
4.7.3. Bargaining Power of Buyers
4.7.4. Threat Of Substitute Products
4.7.5. Competitive Rivalry
5. The Impact of Ingredient Innovation and Technology on The Global Mental-Care & Nootropic Ingredients Market
5.1. Introduction To Ingredient Innovation and Bioavailability Enhancement
5.2. Advanced Extraction and Standardization Technologies
5.3. Bioavailability Enhancement and Delivery System Innovation
5.4. Clinical Validation and Evidence-Based Ingredient Development
5.5. Sustainable Sourcing and Vertical Integration Strategies
5.6. Proprietary Ingredient Development and Branded Ingredients
5.7. Quality Control and Analytical Testing Advancements
5.8. Impact On Market Growth and Competitive Differentiation
6. Global Mental-Care & Nootropic Ingredients Market, By Ingredient Type
6.1. Overview
6.2. Botanical Extracts / Adaptogens
6.2.1. Ashwagandha
6.2.2. Rhodiola
6.2.3. Ginseng
6.2.4. Lion's Mane & Other Mushroom Extracts
6.2.5. Bacopa Monnieri
6.2.6. Holy Basil (Tulsi)
6.2.7. Ginkgo Biloba
6.2.8. Others (Passionflower, Lemon Balm, Valerian Root)
6.3. Amino Acids
6.3.1. L-Theanine
6.3.2. GABA (Gamma-Aminobutyric Acid)
6.3.3. L-Tyrosine
6.3.4. 5-HTP (5-Hydroxytryptophan)
6.3.5. Others
6.4. Vitamins & Minerals
6.4.1. B-Vitamins
6.4.2. Magnesium
6.4.3. Zinc
6.4.4. Vitamin D
6.4.5. Others
6.5. Omega-3 / Lipids
6.5.1. DHA (Docosahexaenoic Acid)
6.5.1.1. Fish-Derived DHA
6.5.1.2. Algal DHA
6.5.2. EPA (Eicosapentaenoic Acid)
6.5.3. Phospholipids (Phosphatidylserine, Phosphatidylcholine)
6.6. Probiotics / Microbiome-Based
6.6.1. Lactobacillus Strains
6.6.2. Bifidobacterium Strains
6.6.3. Multi-Strain Psychobiotic Formulations
6.6.4. Prebiotics And Postbiotics
6.7. Synthetic Nootropics
6.7.1. Citicoline (CDP-Choline)
6.7.2. Alpha-GPC (Alpha-Glycerylphosphorylcholine)
6.7.3. Others
6.8. Others
7. Global Mental-Care & Nootropic Ingredients Market, By Function
7.1. Overview
7.2. Stress / Anxiety Relief
7.3. Mood Enhancement / Emotional Well-Being
7.4. Cognitive Performance (Memory, Focus, Learning)
7.5. Neuroprotection / Brain Health
7.6. Sleep / Recovery
7.7. Energy & Mental Fatigue
8. Global Mental-Care & Nootropic Ingredients Market, By Application
8.1. Overview
8.2. Dietary Supplements
8.3. Functional Foods & Beverages
8.4. Personal Care / Nutraceutical Cosmetics
8.5. Pharmaceuticals / Clinical Mental Health Use
8.6. Sports Nutrition
8.7. Others
9. Global Mental-Care & Nootropic Ingredients Market, By Distribution Channel
9.1. Overview
9.2. Direct Sales to Manufacturers
9.3. Distributors And Ingredient Brokers
9.4. Online B2B Platforms
9.5. Others
10. Mental-Care & Nootropic Ingredients Market Assessment, By Geography
10.1. Overview
10.2. North America
10.2.1. U.S.
10.2.2. Canada
10.3. Europe
10.3.1. Germany
10.3.2. U.K.
10.3.3. France
10.3.4. Italy
10.3.5. Spain
10.3.6. Switzerland
10.3.7. Rest Of Europe
10.4. Asia-Pacific
10.4.1. China
10.4.2. Japan
10.4.3. India
10.4.4. South Korea
10.4.5. Australia
10.4.6. Indonesia
10.4.7. Thailand
10.4.8. Singapore
10.4.9. Vietnam
10.4.10. Philippines
10.4.11. Rest Of Asia-Pacific
10.5. Latin America
10.5.1. Brazil
10.5.2. Mexico
10.5.3. Argentina
10.5.4. Rest Of Latin America
10.6. Middle East & Africa
10.6.1. Saudi Arabia
10.6.2. UAE
10.6.3. South Africa
10.6.4. Rest Of Middle East & Africa
11. Competitive Landscape
11.1. Introduction
11.2. Key Growth Strategies
11.3. Competitive Benchmarking
11.4. Competitive Dashboard
11.4.1. Industry Leaders
11.4.2. Market Differentiators
11.4.3. Vanguards
11.4.4. Emerging Companies
11.5. Market Share / Position Analysis
12. Company Profiles
12.1. Sabinsa Corporation
12.1.1. Company Overview
12.1.2. Product Portfolio
12.1.3. Strategic Developments
12.2. Arjuna Natural Pvt. Ltd.
12.2.1. Company Overview
12.2.2. Product Portfolio
12.3. Ixoreal Biomed Inc. (KSM-66 Ashwagandha)
12.3.1. Company Overview
12.3.2. Product Portfolio
12.3.3. Strategic Developments
12.4. Natreon Inc.
12.4.1. Company Overview
12.4.2. Product Portfolio
12.5. Verdure Sciences (Lonza - Capsules & Health Ingredients)
12.5.1. Company Overview
12.5.2. Product Portfolio
12.6. Kyowa Hakko Bio Co. Ltd.
12.6.1. Company Overview
12.6.2. Product Portfolio
12.6.3. Strategic Developments
12.7. Chr. Hansen Holding A/S (Novonesis)
12.7.1. Company Overview
12.7.2. Product Portfolio
12.8. DSM-Firmenich (Royal DSM)
12.8.1. Company Overview
12.8.2. Product Portfolio
12.9. Nammex
12.9.1. Company Overview
12.9.2. Product Portfolio
12.10. Pharmachem Laboratories
12.10.1. Company Overview
12.10.2. Product Portfolio
12.11. Organic Herb Inc.
12.11.1. Company Overview
12.11.2. Product Portfolio
12.12. Daesang Corporation
12.12.1. Company Overview
12.12.2. Financial Overview
12.12.3. Product Portfolio
12.13. Nexira
12.13.1. Company Overview
12.13.2. Product Portfolio
12.13.3. Strategic Developments
12.14. Glanbia Nutritionals (Glanbia Plc)
12.14.1. Company Overview
12.14.2. Financial Overview
12.14.3. Product Portfolio
12.15. Roquette Frères
12.15.1. Company Overview
12.15.2. Product Portfolio
13. Appendix
13.1. Available Customization
13.2. Related Reports
List of Table
Table 1 Global Mental-Care & Nootropic Ingredients Market, By Type, 2025-2035 (USD Million)
Table 2 Global Botanical Extracts Market, By Type, 2025-2035 (USD Million)
Table 3 Global Botanical Extracts Market, By Country/Region, 2023-2035 (USD Million)
Table 4 Global Ashwagandha Market, By Country/Region, 2023-2035 (USD Million)
Table 5 Global Rhodiola Market, By Country/Region, 2023-2035 (USD Million)
Table 6 Global Ginseng Market, By Country/Region, 2023-2035 (USD Million)
Table 7 Global Lion’s Mane & Other Mushrooms Extracts Market, By Country/Region, 2023-2035 (USD Million)
Table 8 Global Bacopa Monnieri Market, By Country/Region, 2023-2035 (USD Million)
Table 9 Global Holy Basil (Tulsi) Market, By Country/Region, 2023-2035 (USD Million)
Table 10 Global Ginkgo Biloba Market, By Country/Region, 2023-2035 (USD Million)
Table 11 Global Others Botanical Extracts Market, By Country/Region, 2023-2035 (USD Million)
Table 12 Global Amino Acids Market, By Type, 2025-2035 (USD Million)
Table 13 Global Amino Acids Market, By Country/Region, 2023-2035 (USD Million)
Table 14 Global Amino Acids Market, By Country/Region, 2023-2035 (Metric Tons)
Table 15 Global L-Theanine Market, By Country/Region, 2023-2035 (USD Million)
Table 16 Global L-Theanine Market, By Country/Region, 2023-2035 (Metric Tons)
Table 17 Global Gaba Market, By Country/Region, 2023-2035 (USD Million)
Table 18 Global L-Tyrosine Market, By Country/Region, 2023-2035 (USD Million)
Table 19 Global 5-Htp Market, By Country/Region, 2023-2035 (USD Million)
Table 20 Global Others Amino Acids Market, By Country/Region, 2023-2035 (USD Million)
Table 21 Global Vitamins & Minerals Market, By Type, 2025-2035 (USD Million)
Table 22 Global Vitamins & Minerals Market, By Country/Region, 2023-2035 (USD Million)
Table 23 Global B-Vitamins Market, By Country/Region, 2023-2035 (USD Million)
Table 24 Global Magnesium Market, By Country/Region, 2023-2035 (USD Million)
Table 25 Global Zinc Market, By Country/Region, 2023-2035 (USD Million)
Table 26 Global Vitamin D Market, By Country/Region, 2023-2035 (USD Million)
Table 27 Global Other Vitamins And Minerals Market, By Country/Region, 2023-2035 (USD Million)
Table 28 Global Omega-3 Market, By Type, 2025-2035 (USD Million)
Table 29 Global Omega-3 Market, By Country/Region, 2023-2035 (USD Million)
Table 30 Global Dha (Docosahexaenoic Acid) Market, By Type, 2025-2035 (USD Million)
Table 31 Global Dha (Docosahexaenoic Acid) Market, By Country/Region, 2023-2035 (USD Million)
Table 32 Global Fish-Derived Dha Market, By Country/Region, 2023-2035 (USD Million)
Table 33 Global Algal Dha Market, By Country/Region, 2023-2035 (USD Million)
Table 34 Global Epa Market, By Country/Region, 2023-2035 (USD Million)
Table 35 Global Phospholipids (Ps, Pc) Market, By Country/Region, 2023-2035 (USD Million)
Table 36 Global Probiotics / Microbiome-Based Ingredients, By Type, 2025-2035 (USD Million)
Table 37 Global Probiotics / Microbiome-Based Market, By Country/Region, 2023-2035 (USD Million)
Table 38 Global Lactobacillus Strains Market, By Country/Region, 2023-2035 (USD Million)
Table 39 Global Bifidobacterium Strains Market, By Country/Region, 2023-2035 (USD Million)
Table 40 Global Multi-Strain Psychobiotics Market, By Country/Region, 2023-2035 (USD Million)
Table 41 Global Prebiotics & Postbiotics Market, By Country/Region, 2023-2035 (USD Million)
Table 42 Global Synthetic Nootropics Market, By Type, 2025-2035 (USD Million)
Table 43 Global Synthetic Nootropics Market, By Country/Region, 2023-2035 (USD Million)
Table 44 Global Citicoline (Cdp-Choline) Market, By Country/Region, 2023-2035 (USD Million)
Table 45 Global Alpha-Gpc Market, By Country/Region, 2023-2035 (USD Million)
Table 46 Global Others Synthetic Nootropics Market, By Country/Region, 2023-2035 (USD Million)
Table 47 Global Others Mental-Care & Nootropic Ingredients Market, By Country/Region, 2023-2035 (USD Million)
Table 48 Global Mental-Care & Nootropic Ingredients Market, By Function, 2025-2035 (USD Million)
Table 49 Global Mental-Care & Nootropic Ingredients Market for Stress / Anxiety Relief, By Country/Region, 2023-2035 (USD Million)
Table 50 Global Mental-Care & Nootropic Ingredients Market for Mood Enhancement / Emotional Well-Being, By Country/Region, 2023-2035 (USD Million)
Table 51 Global Mental-Care & Nootropic Ingredients Market for Cognitive Performance (Memory, Focus, Learning), By Country/Region, 2023-2035 (USD Million)
Table 52 Global Mental-Care & Nootropic Ingredients Market for Neuroprotection / Brain Health, By Country/Region, 2023-2035 (USD Million)
Table 53 Global Mental-Care & Nootropic Ingredients Market for Sleep / Recovery, By Country/Region, 2023-2035 (USD Million)
Table 54 Global Mental-Care & Nootropic Ingredients Market for Energy & Mental Fatigue, By Country/Region, 2023-2035 (USD Million)
Table 55 Global Mental-Care & Nootropic Ingredients Market, By Application, 2025–2035 (USD Million)
Table 56 Global Mental-Care & Nootropic Ingredients Market for Dietary Supplements, By Country/Region, 2023-2035 (USD Million)
Table 57 Global Mental-Care & Nootropic Ingredients Market for Functional Foods & Beverages, By Country/Region, 2023-2035 (USD Million)
Table 58 Global Mental-Care & Nootropic Ingredients Market for Personal Care / Nutraceutical Cosmetics, By Country/Region, 2023-2035 (USD Million)
Table 59 Global Mental-Care & Nootropic Ingredients Market for Pharmaceuticals / Clinical Mental Health Use, By Country/Region, 2023-2035 (USD Million)
Table 60 Global Mental-Care & Nootropic Ingredients Market for Sports Nutrition, By Country/Region, 2023-2035 (USD Million)
Table 61 Global Mental-Care & Nootropic Ingredients Market for Others Application, By Country/Region, 2023-2035 (USD Million)
Table 62 Global Mental-Care & Nootropic Ingredients Market, By Distribution Channel, 2025–2035 (USD Million)
Table 63 Global Mental-Care & Nootropic Ingredients Market for Direct Sales to Manufacturers, By Country/Region, 2023-2035 (USD Million)
Table 64 Global Mental-Care & Nootropic Ingredients Market for Distributors & Ingredient Brokers, By Country/Region, 2023-2035 (USD Million)
Table 65 Global Mental-Care & Nootropic Ingredients Market for Online B2b Platforms, By Country/Region, 2023-2035 (USD Million)
Table 66 Global Mental-Care & Nootropic Ingredients Market for Other Channels, By Country/Region, 2023-2035 (USD Million)
Table 67 North America: Mental-Care & Nootropic Ingredients Market, By Country, 2023–2035 (USD Million)
Table 68 North America: Mental-Care & Nootropic Ingredients Market, By Ingredient Type, 2023-2035 (USD Million)
Table 69 North America: Botanical Extracts Market, By Type, 2023-2035 (USD Million)
Table 70 North America: Vitamins & Minerals Market, By Type, 2023-2035 (USD Million)
Table 71 North America: Amino Acids Market, By Type, 2023-2035 (USD Million)
Table 72 North America: Omega-3 Market, By Type, 2025-2035 (USD Million)
Table 73 North America: Dha (Docosahexaenoic Acid) Market, By Type, 2025–2035 (USD Million)
Table 74 North America: Probiotics / Microbiome-Based Ingredients, By Type, 2025-2035 (USD Million)
Table 75 North America: Synthetic Nootropics Market, By Type, 2025-2035 (USD Million)
Table 76 North America: Mental-Care & Nootropic Ingredients Market, By Function, 2025–2035 (USD Million)
Table 77 North America: Mental-Care & Nootropic Ingredients Market, By Application, 2025–2035 (USD Million)
Table 78 North America: Mental-Care & Nootropic Ingredients Market, By Distribution Channel, 2025–2035 (USD Million)
Table 79 U.S.: Mental-Care & Nootropic Ingredients Market, By Ingredient Type, 2023-2035 (USD Million)
Table 80 U.S.: Botanical Extracts Market, By Type, 2023-2035 (USD Million)
Table 81 U.S.: Vitamins & Minerals Market, By Type, 2023-2035 (USD Million)
Table 82 U.S.: Amino Acids Market, By Type, 2023-2035 (USD Million)
Table 83 U.S.: Omega-3 Market, By Type, 2025-2035 (USD Million)
Table 84 U.S.: Dha (Docosahexaenoic Acid) Market, By Type, 2025–2035 (USD Million)
Table 85 U.S.: Probiotics / Microbiome-Based Ingredients, By Type, 2025-2035 (USD Million)
Table 86 U.S.: Synthetic Nootropics Market, By Type, 2025-2035 (USD Million)
Table 87 U.S.: Mental-Care & Nootropic Ingredients Market, By Function, 2025–2035 (USD Million)
Table 88 U.S.: Mental-Care & Nootropic Ingredients Market, By Application, 2025–2035 (USD Million)
Table 89 U.S.: Mental-Care & Nootropic Ingredients Market, By Distribution Channel, 2025–2035 (USD Million)
Table 90 Canada: Mental-Care & Nootropic Ingredients Market, By Ingredient Type, 2023-2035 (USD Million)
Table 91 Canada: Botanical Extracts Market, By Type, 2023-2035 (USD Million)
Table 92 Canada: Vitamins & Minerals Market, By Type, 2023-2035 (USD Million)
Table 93 Canada: Amino Acids Market, By Type, 2023-2035 (USD Million)
Table 94 Canada: Omega-3 Market, By Type, 2025-2035 (USD Million)
Table 95 Canada: Dha (Docosahexaenoic Acid) Market, By Type, 2025–2035 (USD Million)
Table 96 Canada: Probiotics / Microbiome-Based Ingredients, By Type, 2025-2035 (USD Million)
Table 97 Canada: Synthetic Nootropics Market, By Type, 2025-2035 (USD Million)
Table 98 Canada: Mental-Care & Nootropic Ingredients Market, By Function, 2025–2035 (USD Million)
Table 99 Canada: Mental-Care & Nootropic Ingredients Market, By Application, 2025–2035 (USD Million)
Table 100 Canada: Mental-Care & Nootropic Ingredients Market, By Distribution Channel, 2025–2035 (USD Million)
Table 101 Europe: Mental-Care & Nootropic Ingredients Market, By Country, 2023-2035 (USD Million)
Table 102 Europe: Mental-Care & Nootropic Ingredients Market, By Ingredient Type, 2023-2035 (USD Million)
Table 103 Europe: Botanical Extracts Market, By Type, 2023-2035 (USD Million)
Table 104 Europe: Vitamins & Minerals Market, By Type, 2023-2035 (USD Million)
Table 105 Europe: Amino Acids Market, By Type, 2023-2035 (USD Million)
Table 106 Europe: Omega-3 Market, By Type, 2025-2035 (USD Million)
Table 107 Europe: Dha (Docosahexaenoic Acid) Market, By Type, 2025–2035 (USD Million)
Table 108 Europe: Probiotics / Microbiome-Based Ingredients, By Type, 2025-2035 (USD Million)
Table 109 Europe: Synthetic Nootropics Market, By Type, 2025-2035 (USD Million)
Table 110 Europe: Mental-Care & Nootropic Ingredients Market, By Function, 2025–2035 (USD Million)
Table 111 Europe: Mental-Care & Nootropic Ingredients Market, By Application, 2025–2035 (USD Million)
Table 112 Europe: Mental-Care & Nootropic Ingredients Market, By Distribution Channel, 2025–2035 (USD Million)
Table 113 Germany: Mental-Care & Nootropic Ingredients Market, By Ingredient Type, 2023-2035 (USD Million)
Table 114 Germany: Botanical Extracts Market, By Type, 2023-2035 (USD Million)
Table 115 Germany: Vitamins & Minerals Market, By Type, 2023-2035 (USD Million)
Table 116 Germany: Amino Acids Market, By Type, 2023-2035 (USD Million)
Table 117 Germany: Omega-3 Market, By Type, 2025-2035 (USD Million)
Table 118 Germany: Dha (Docosahexaenoic Acid) Market, By Type, 2025–2035 (USD Million)
Table 119 Germany: Probiotics / Microbiome-Based Ingredients, By Type, 2025-2035 (USD Million)
Table 120 Germany: Synthetic Nootropics Market, By Type, 2025-2035 (USD Million)
Table 121 Germany: Mental-Care & Nootropic Ingredients Market, By Function, 2025–2035 (USD Million)
Table 122 Germany: Mental-Care & Nootropic Ingredients Market, By Application, 2025–2035 (USD Million)
Table 123 Germany: Mental-Care & Nootropic Ingredients Market, By Distribution Channel, 2025–2035 (USD Million)
Table 124 U.K.: Mental-Care & Nootropic Ingredients Market, By Ingredient Type, 2023-2035 (USD Million)
Table 125 U.K.: Botanical Extracts Market, By Type, 2023-2035 (USD Million)
Table 126 U.K.: Vitamins & Minerals Market, By Type, 2023-2035 (USD Million)
Table 127 U.K.: Amino Acids Market, By Type, 2023-2035 (USD Million)
Table 128 U.K.: Omega-3 Market, By Type, 2025-2035 (USD Million)
Table 129 U.K.: Dha (Docosahexaenoic Acid) Market, By Type, 2025–2035 (USD Million)
Table 130 U.K.: Probiotics / Microbiome-Based Ingredients, By Type, 2025-2035 (USD Million)
Table 131 U.K.: Synthetic Nootropics Market, By Type, 2025-2035 (USD Million)
Table 132 U.K.: Mental-Care & Nootropic Ingredients Market, By Function, 2025–2035 (USD Million)
Table 133 U.K.: Mental-Care & Nootropic Ingredients Market, By Application, 2025–2035 (USD Million)
Table 134 U.K.: Mental-Care & Nootropic Ingredients Market, By Distribution Channel, 2025–2035 (USD Million)
Table 135 France: Mental-Care & Nootropic Ingredients Market, By Ingredient Type, 2023-2035 (USD Million)
Table 136 France: Botanical Extracts Market, By Type, 2023-2035 (USD Million)
Table 137 France: Vitamins & Minerals Market, By Type, 2023-2035 (USD Million)
Table 138 France: Amino Acids Market, By Type, 2023-2035 (USD Million)
Table 139 France: Omega-3 Market, By Type, 2025-2035 (USD Million)
Table 140 France: Dha (Docosahexaenoic Acid) Market, By Type, 2025–2035 (USD Million)
Table 141 France: Probiotics / Microbiome-Based Ingredients, By Type, 2025-2035 (USD Million)
Table 142 France: Synthetic Nootropics Market, By Type, 2025-2035 (USD Million)
Table 143 France: Mental-Care & Nootropic Ingredients Market, By Function, 2025–2035 (USD Million)
Table 144 France: Mental-Care & Nootropic Ingredients Market, By Application, 2025–2035 (USD Million)
Table 145 France: Mental-Care & Nootropic Ingredients Market, By Distribution Channel, 2025–2035 (USD Million)
Table 146 Italy: Mental-Care & Nootropic Ingredients Market, By Ingredient Type, 2023-2035 (USD Million)
Table 147 Italy: Botanical Extracts Market, By Type, 2023-2035 (USD Million)
Table 148 Italy: Vitamins & Minerals Market, By Type, 2023-2035 (USD Million)
Table 149 Italy: Amino Acids Market, By Type, 2023-2035 (USD Million)
Table 150 Italy: Omega-3 Market, By Type, 2025-2035 (USD Million)
Table 151 Italy: Dha (Docosahexaenoic Acid) Market, By Type, 2025–2035 (USD Million)
Table 152 Italy: Probiotics / Microbiome-Based Ingredients, By Type, 2025-2035 (USD Million)
Table 153 Italy: Synthetic Nootropics Market, By Type, 2025-2035 (USD Million)
Table 154 Italy: Mental-Care & Nootropic Ingredients Market, By Function, 2025–2035 (USD Million)
Table 155 Italy: Mental-Care & Nootropic Ingredients Market, By Application, 2025–2035 (USD Million)
Table 156 Italy: Mental-Care & Nootropic Ingredients Market, By Distribution Channel, 2025–2035 (USD Million)
Table 157 Spain: Mental-Care & Nootropic Ingredients Market, By Ingredient Type, 2023-2035 (USD Million)
Table 158 Spain: Botanical Extracts Market, By Type, 2023-2035 (USD Million)
Table 159 Spain: Vitamins & Minerals Market, By Type, 2023-2035 (USD Million)
Table 160 Spain: Amino Acids Market, By Type, 2023-2035 (USD Million)
Table 161 Spain: Omega-3 Market, By Type, 2025-2035 (USD Million)
Table 162 Spain: Dha (Docosahexaenoic Acid) Market, By Type, 2025–2035 (USD Million)
Table 163 Spain: Probiotics / Microbiome-Based Ingredients, By Type, 2025-2035 (USD Million)
Table 164 Spain: Synthetic Nootropics Market, By Type, 2025-2035 (USD Million)
Table 165 Spain: Mental-Care & Nootropic Ingredients Market, By Function, 2025–2035 (USD Million)
Table 166 Spain: Mental-Care & Nootropic Ingredients Market, By Application, 2025–2035 (USD Million)
Table 167 Spain: Mental-Care & Nootropic Ingredients Market, By Distribution Channel, 2025–2035 (USD Million)
Table 168 Switzerland: Mental-Care & Nootropic Ingredients Market, By Ingredient Type, 2023-2035 (USD Million)
Table 169 Switzerland: Botanical Extracts Market, By Type, 2023-2035 (USD Million)
Table 170 Switzerland: Vitamins & Minerals Market, By Type, 2023-2035 (USD Million)
Table 171 Switzerland: Amino Acids Market, By Type, 2023-2035 (USD Million)
Table 172 Switzerland: Omega-3 Market, By Type, 2025-2035 (USD Million)
Table 173 Switzerland: Dha (Docosahexaenoic Acid) Market, By Type, 2025–2035 (USD Million)
Table 174 Switzerland: Probiotics / Microbiome-Based Ingredients, By Type, 2025-2035 (USD Million)
Table 175 Switzerland: Synthetic Nootropics Market, By Type, 2025-2035 (USD Million)
Table 176 Switzerland: Mental-Care & Nootropic Ingredients Market, By Function, 2025–2035 (USD Million)
Table 177 Switzerland: Mental-Care & Nootropic Ingredients Market, By Application, 2025–2035 (USD Million)
Table 178 Switzerland: Mental-Care & Nootropic Ingredients Market, By Distribution Channel, 2025–2035 (USD Million)
Table 179 Rest of Europe: Mental-Care & Nootropic Ingredients Market, By Ingredient Type, 2023-2035 (USD Million)
Table 180 Rest of Europe: Botanical Extracts Market, By Type, 2023-2035 (USD Million)
Table 181 Rest of Europe: Vitamins & Minerals Market, By Type, 2023-2035 (USD Million)
Table 182 Rest of Europe: Amino Acids Market, By Type, 2023-2035 (USD Million)
Table 183 Rest of Europe: Omega-3 Market, By Type, 2025-2035 (USD Million)
Table 184 Rest of Europe: Dha (Docosahexaenoic Acid) Market, By Type, 2025–2035 (USD Million)
Table 185 Rest of Europe: Probiotics / Microbiome-Based Ingredients, By Type, 2025-2035 (USD Million)
Table 186 Rest of Europe: Synthetic Nootropics Market, By Type, 2025-2035 (USD Million)
Table 187 Rest of Europe: Mental-Care & Nootropic Ingredients Market, By Function, 2025–2035 (USD Million)
Table 188 Rest of Europe: Mental-Care & Nootropic Ingredients Market, By Application, 2025–2035 (USD Million)
Table 189 Rest of Europe: Mental-Care & Nootropic Ingredients Market, By Distribution Channel, 2025–2035 (USD Million)
Table 190 Asia-Pacific: Mental-Care & Nootropic Ingredients Market, By Country, 2023–2035 (USD Million)
Table 191 Asia-Pacific: Mental-Care & Nootropic Ingredients Market, By Ingredient Type, 2023-2035 (USD Million)
Table 192 Asia-Pacific: Botanical Extracts Market, By Type, 2023-2035 (USD Million)
Table 193 Asia-Pacific: Vitamins & Minerals Market, By Type, 2023-2035 (USD Million)
Table 194 Asia-Pacific: Amino Acids Market, By Type, 2023-2035 (USD Million)
Table 195 Asia-Pacific: Omega-3 Market, By Type, 2025-2035 (USD Million)
Table 196 Asia-Pacific: Dha (Docosahexaenoic Acid) Market, By Type, 2025–2035 (USD Million)
Table 197 Asia-Pacific: Probiotics / Microbiome-Based Ingredients, By Type, 2025-2035 (USD Million)
Table 198 Asia-Pacific: Synthetic Nootropics Market, By Type, 2025-2035 (USD Million)
Table 199 Asia-Pacific: Mental-Care & Nootropic Ingredients Market, By Function, 2025–2035 (USD Million)
Table 200 Asia-Pacific: Mental-Care & Nootropic Ingredients Market, By Application, 2025–2035 (USD Million)
Table 201 Asia-Pacific: Mental-Care & Nootropic Ingredients Market, By Distribution Channel, 2025–2035 (USD Million)
Table 202 China: Mental-Care & Nootropic Ingredients Market, By Ingredient Type, 2023-2035 (USD Million)
Table 203 China: Botanical Extracts Market, By Type, 2023-2035 (USD Million)
Table 204 China: Vitamins & Minerals Market, By Type, 2023-2035 (USD Million)
Table 205 China: Amino Acids Market, By Type, 2023-2035 (USD Million)
Table 206 China: Omega-3 Market, By Type, 2025-2035 (USD Million)
Table 207 China: Dha (Docosahexaenoic Acid) Market, By Type, 2025–2035 (USD Million)
Table 208 China: Probiotics / Microbiome-Based Ingredients, By Type, 2025-2035 (USD Million)
Table 209 China: Synthetic Nootropics Market, By Type, 2025-2035 (USD Million)
Table 210 China: Mental-Care & Nootropic Ingredients Market, By Function, 2025–2035 (USD Million)
Table 211 China: Mental-Care & Nootropic Ingredients Market, By Application, 2025–2035 (USD Million)
Table 212 China: Mental-Care & Nootropic Ingredients Market, By Distribution Channel, 2025–2035 (USD Million)
Table 213 Japan: Mental-Care & Nootropic Ingredients Market, By Ingredient Type, 2023-2035 (USD Million)
Table 214 Japan: Botanical Extracts Market, By Type, 2023-2035 (USD Million)
Table 215 Japan: Vitamins & Minerals Market, By Type, 2023-2035 (USD Million)
Table 216 Japan: Amino Acids Market, By Type, 2023-2035 (USD Million)
Table 217 Japan: Omega-3 Market, By Type, 2025-2035 (USD Million)
Table 218 Japan: Dha (Docosahexaenoic Acid) Market, By Type, 2025–2035 (USD Million)
Table 219 Japan: Probiotics / Microbiome-Based Ingredients, By Type, 2025-2035 (USD Million)
Table 220 Japan: Synthetic Nootropics Market, By Type, 2025-2035 (USD Million)
Table 221 Japan: Mental-Care & Nootropic Ingredients Market, By Function, 2025–2035 (USD Million)
Table 222 Japan: Mental-Care & Nootropic Ingredients Market, By Application, 2025–2035 (USD Million)
Table 223 Japan: Mental-Care & Nootropic Ingredients Market, By Distribution Channel, 2025–2035 (USD Million)
Table 224 India: Mental-Care & Nootropic Ingredients Market, By Ingredient Type, 2023-2035 (USD Million)
Table 225 India: Botanical Extracts Market, By Type, 2023-2035 (USD Million)
Table 226 India: Vitamins & Minerals Market, By Type, 2023-2035 (USD Million)
Table 227 India: Amino Acids Market, By Type, 2023-2035 (USD Million)
Table 228 India: Omega-3 Market, By Type, 2025-2035 (USD Million)
Table 229 India: Dha (Docosahexaenoic Acid) Market, By Type, 2025–2035 (USD Million)
Table 230 India: Probiotics / Microbiome-Based Ingredients, By Type, 2025-2035 (USD Million)
Table 231 India: Synthetic Nootropics Market, By Type, 2025-2035 (USD Million)
Table 232 India: Mental-Care & Nootropic Ingredients Market, By Function, 2025–2035 (USD Million)
Table 233 India: Mental-Care & Nootropic Ingredients Market, By Application, 2025–2035 (USD Million)
Table 234 India: Mental-Care & Nootropic Ingredients Market, By Distribution Channel, 2025–2035 (USD Million)
Table 235 South Korea: Mental-Care & Nootropic Ingredients Market, By Ingredient Type, 2023-2035 (USD Million)
Table 236 South Korea: Botanical Extracts Market, By Type, 2023-2035 (USD Million)
Table 237 South Korea: Vitamins & Minerals Market, By Type, 2023-2035 (USD Million)
Table 238 South Korea: Amino Acids Market, By Type, 2023-2035 (USD Million)
Table 239 South Korea: Omega-3 Market, By Type, 2025-2035 (USD Million)
Table 240 South Korea: Dha (Docosahexaenoic Acid) Market, By Type, 2025–2035 (USD Million)
Table 241 South Korea: Probiotics / Microbiome-Based Ingredients, By Type, 2025-2035 (USD Million)
Table 242 South Korea: Synthetic Nootropics Market, By Type, 2025-2035 (USD Million)
Table 243 South Korea: Mental-Care & Nootropic Ingredients Market, By Function, 2025–2035 (USD Million)
Table 244 South Korea: Mental-Care & Nootropic Ingredients Market, By Application, 2025–2035 (USD Million)
Table 245 South Korea: Mental-Care & Nootropic Ingredients Market, By Distribution Channel, 2025–2035 (USD Million)
Table 246 Australia: Mental-Care & Nootropic Ingredients Market, By Ingredient Type, 2023-2035 (USD Million)
Table 247 Australia: Botanical Extracts Market, By Type, 2023-2035 (USD Million)
Table 248 Australia: Vitamins & Minerals Market, By Type, 2023-2035 (USD Million)
Table 249 Australia: Amino Acids Market, By Type, 2023-2035 (USD Million)
Table 250 Australia: Omega-3 Market, By Type, 2025-2035 (USD Million)
Table 251 Australia: Dha (Docosahexaenoic Acid) Market, By Type, 2025–2035 (USD Million)
Table 252 Australia: Probiotics / Microbiome-Based Ingredients, By Type, 2025-2035 (USD Million)
Table 253 Australia: Synthetic Nootropics Market, By Type, 2025-2035 (USD Million)
Table 254 Australia: Mental-Care & Nootropic Ingredients Market, By Function, 2025–2035 (USD Million)
Table 255 Australia: Mental-Care & Nootropic Ingredients Market, By Application, 2025–2035 (USD Million)
Table 256 Australia: Mental-Care & Nootropic Ingredients Market, By Distribution Channel, 2025–2035 (USD Million)
Table 257 Indonesia: Mental-Care & Nootropic Ingredients Market, By Ingredient Type, 2023-2035 (USD Million)
Table 258 Indonesia: Botanical Extracts Market, By Type, 2023-2035 (USD Million)
Table 259 Indonesia: Vitamins & Minerals Market, By Type, 2023-2035 (USD Million)
Table 260 Indonesia: Amino Acids Market, By Type, 2023-2035 (USD Million)
Table 261 Indonesia: Omega-3 Market, By Type, 2025-2035 (USD Million)
Table 262 Indonesia: Dha (Docosahexaenoic Acid) Market, By Type, 2025–2035 (USD Million)
Table 263 Indonesia: Probiotics / Microbiome-Based Ingredients, By Type, 2025-2035 (USD Million)
Table 264 Indonesia: Synthetic Nootropics Market, By Type, 2025-2035 (USD Million)
Table 265 Indonesia: Mental-Care & Nootropic Ingredients Market, By Function, 2025–2035 (USD Million)
Table 266 Indonesia: Mental-Care & Nootropic Ingredients Market, By Application, 2025–2035 (USD Million)
Table 267 Indonesia: Mental-Care & Nootropic Ingredients Market, By Distribution Channel, 2025–2035 (USD Million)
Table 268 Thailand: Mental-Care & Nootropic Ingredients Market, By Ingredient Type, 2023-2035 (USD Million)
Table 269 Thailand: Botanical Extracts Market, By Type, 2023-2035 (USD Million)
Table 270 Thailand: Vitamins & Minerals Market, By Type, 2023-2035 (USD Million)
Table 271 Thailand: Amino Acids Market, By Type, 2023-2035 (USD Million)
Table 272 Thailand: Omega-3 Market, By Type, 2025-2035 (USD Million)
Table 273 Thailand: Dha (Docosahexaenoic Acid) Market, By Type, 2025–2035 (USD Million)
Table 274 Thailand: Probiotics / Microbiome-Based Ingredients, By Type, 2025-2035 (USD Million)
Table 275 Thailand: Synthetic Nootropics Market, By Type, 2025-2035 (USD Million)
Table 276 Thailand: Mental-Care & Nootropic Ingredients Market, By Function, 2025–2035 (USD Million)
Table 277 Thailand: Mental-Care & Nootropic Ingredients Market, By Application, 2025–2035 (USD Million)
Table 278 Thailand: Mental-Care & Nootropic Ingredients Market, By Distribution Channel, 2025–2035 (USD Million)
Table 279 Singapore: Mental-Care & Nootropic Ingredients Market, By Ingredient Type, 2023-2035 (USD Million)
Table 280 Singapore: Botanical Extracts Market, By Type, 2023-2035 (USD Million)
Table 281 Singapore: Vitamins & Minerals Market, By Type, 2023-2035 (USD Million)
Table 282 Singapore: Amino Acids Market, By Type, 2023-2035 (USD Million)
Table 283 Singapore: Omega-3 Market, By Type, 2025-2035 (USD Million)
Table 284 Singapore: Dha (Docosahexaenoic Acid) Market, By Type, 2025–2035 (USD Million)
Table 285 Singapore: Probiotics / Microbiome-Based Ingredients, By Type, 2025-2035 (USD Million)
Table 286 Singapore: Synthetic Nootropics Market, By Type, 2025-2035 (USD Million)
Table 287 Singapore: Mental-Care & Nootropic Ingredients Market, By Function, 2025–2035 (USD Million)
Table 288 Singapore: Mental-Care & Nootropic Ingredients Market, By Application, 2025–2035 (USD Million)
Table 289 Singapore: Mental-Care & Nootropic Ingredients Market, By Distribution Channel, 2025–2035 (USD Million)
Table 290 Vietnam: Mental-Care & Nootropic Ingredients Market, By Ingredient Type, 2023-2035 (USD Million)
Table 291 Vietnam: Botanical Extracts Market, By Type, 2023-2035 (USD Million)
Table 292 Vietnam: Vitamins & Minerals Market, By Type, 2023-2035 (USD Million)
Table 293 Vietnam: Amino Acids Market, By Type, 2023-2035 (USD Million)
Table 294 Vietnam: Omega-3 Market, By Type, 2025-2035 (USD Million)
Table 295 Vietnam: Dha (Docosahexaenoic Acid) Market, By Type, 2025–2035 (USD Million)
Table 296 Vietnam: Probiotics / Microbiome-Based Ingredients, By Type, 2025-2035 (USD Million)
Table 297 Vietnam: Synthetic Nootropics Market, By Type, 2025-2035 (USD Million)
Table 298 Vietnam: Mental-Care & Nootropic Ingredients Market, By Function, 2025–2035 (USD Million)
Table 299 Vietnam: Mental-Care & Nootropic Ingredients Market, By Application, 2025–2035 (USD Million)
Table 300 Vietnam: Mental-Care & Nootropic Ingredients Market, By Distribution Channel, 2025–2035 (USD Million)
Table 301 Philippines: Mental-Care & Nootropic Ingredients Market, By Ingredient Type, 2023-2035 (USD Million)
Table 302 Philippines: Botanical Extracts Market, By Type, 2023-2035 (USD Million)
Table 303 Philippines: Vitamins & Minerals Market, By Type, 2023-2035 (USD Million)
Table 304 Philippines: Amino Acids Market, By Type, 2023-2035 (USD Million)
Table 305 Philippines: Omega-3 Market, By Type, 2025-2035 (USD Million)
Table 306 Philippines: Dha (Docosahexaenoic Acid) Market, By Type, 2025–2035 (USD Million)
Table 307 Philippines: Probiotics / Microbiome-Based Ingredients, By Type, 2025-2035 (USD Million)
Table 308 Philippines: Synthetic Nootropics Market, By Type, 2025-2035 (USD Million)
Table 309 Philippines: Mental-Care & Nootropic Ingredients Market, By Function, 2025–2035 (USD Million)
Table 310 Philippines: Mental-Care & Nootropic Ingredients Market, By Application, 2025–2035 (USD Million)
Table 311 Philippines: Mental-Care & Nootropic Ingredients Market, By Distribution Channel, 2025–2035 (USD Million)
Table 312 Latin America: Mental-Care & Nootropic Ingredients Market, By Country, 2023–2035 (USD Million)
Table 313 Latin America: Mental-Care & Nootropic Ingredients Market, By Ingredient Type, 2023-2035 (USD Million)
Table 314 Latin America: Botanical Extracts Market, By Type, 2023-2035 (USD Million)
Table 315 Latin America: Vitamins & Minerals Market, By Type, 2023-2035 (USD Million)
Table 316 Latin America: Amino Acids Market, By Type, 2023-2035 (USD Million)
Table 317 Latin America: Omega-3 Market, By Type, 2025-2035 (USD Million)
Table 318 Latin America: Dha (Docosahexaenoic Acid) Market, By Type, 2025–2035 (USD Million)
Table 319 Latin America: Probiotics / Microbiome-Based Ingredients, By Type, 2025-2035 (USD Million)
Table 320 Latin America: Synthetic Nootropics Market, By Type, 2025-2035 (USD Million)
Table 321 Latin America: Mental-Care & Nootropic Ingredients Market, By Function, 2025–2035 (USD Million)
Table 322 Latin America: Mental-Care & Nootropic Ingredients Market, By Application, 2025–2035 (USD Million)
Table 323 Latin America: Mental-Care & Nootropic Ingredients Market, By Distribution Channel, 2025–2035 (USD Million)
Table 324 Brazil: Mental-Care & Nootropic Ingredients Market, By Ingredient Type, 2023-2035 (USD Million)
Table 325 Brazil: Botanical Extracts Market, By Type, 2023-2035 (USD Million)
Table 326 Brazil: Vitamins & Minerals Market, By Type, 2023-2035 (USD Million)
Table 327 Brazil: Amino Acids Market, By Type, 2023-2035 (USD Million)
Table 328 Brazil: Omega-3 Market, By Type, 2025-2035 (USD Million)
Table 329 Brazil: Dha (Docosahexaenoic Acid) Market, By Type, 2025–2035 (USD Million)
Table 330 Brazil: Probiotics / Microbiome-Based Ingredients, By Type, 2025-2035 (USD Million)
Table 331 Brazil: Synthetic Nootropics Market, By Type, 2025-2035 (USD Million)
Table 332 Brazil: Mental-Care & Nootropic Ingredients Market, By Function, 2025–2035 (USD Million)
Table 333 Brazil: Mental-Care & Nootropic Ingredients Market, By Application, 2025–2035 (USD Million)
Table 334 Brazil: Mental-Care & Nootropic Ingredients Market, By Distribution Channel, 2025–2035 (USD Million)
Table 335 Mexico: Mental-Care & Nootropic Ingredients Market, By Ingredient Type, 2023-2035 (USD Million)
Table 336 Mexico: Botanical Extracts Market, By Type, 2023-2035 (USD Million)
Table 337 Mexico: Vitamins & Minerals Market, By Type, 2023-2035 (USD Million)
Table 338 Mexico: Amino Acids Market, By Type, 2023-2035 (USD Million)
Table 339 Mexico: Omega-3 Market, By Type, 2025-2035 (USD Million)
Table 340 Mexico: Dha (Docosahexaenoic Acid) Market, By Type, 2025–2035 (USD Million)
Table 341 Mexico: Probiotics / Microbiome-Based Ingredients, By Type, 2025-2035 (USD Million)
Table 342 Mexico: Synthetic Nootropics Market, By Type, 2025-2035 (USD Million)
Table 343 Mexico: Mental-Care & Nootropic Ingredients Market, By Function, 2025–2035 (USD Million)
Table 344 Mexico: Mental-Care & Nootropic Ingredients Market, By Application, 2025–2035 (USD Million)
Table 345 Mexico: Mental-Care & Nootropic Ingredients Market, By Distribution Channel, 2025–2035 (USD Million)
Table 346 Argentina: Mental-Care & Nootropic Ingredients Market, By Ingredient Type, 2023-2035 (USD Million)
Table 347 Argentina: Botanical Extracts Market, By Type, 2023-2035 (USD Million)
Table 348 Argentina: Vitamins & Minerals Market, By Type, 2023-2035 (USD Million)
Table 349 Argentina: Amino Acids Market, By Type, 2023-2035 (USD Million)
Table 350 Argentina: Omega-3 Market, By Type, 2025-2035 (USD Million)
Table 351 Argentina: Dha (Docosahexaenoic Acid) Market, By Type, 2025–2035 (USD Million)
Table 352 Argentina: Probiotics / Microbiome-Based Ingredients, By Type, 2025-2035 (USD Million)
Table 353 Argentina: Synthetic Nootropics Market, By Type, 2025-2035 (USD Million)
Table 354 Argentina: Mental-Care & Nootropic Ingredients Market, By Function, 2025–2035 (USD Million)
Table 355 Argentina: Mental-Care & Nootropic Ingredients Market, By Application, 2025–2035 (USD Million)
Table 356 Argentina: Mental-Care & Nootropic Ingredients Market, By Distribution Channel, 2025–2035 (USD Million)
Table 357 Rest of Latin America: Mental-Care & Nootropic Ingredients Market, By Ingredient Type, 2023-2035 (USD Million)
Table 358 Rest of Latin America: Botanical Extracts Market, By Type, 2023-2035 (USD Million)
Table 359 Rest of Latin America: Vitamins & Minerals Market, By Type, 2023-2035 (USD Million)
Table 360 Rest of Latin America: Amino Acids Market, By Type, 2023-2035 (USD Million)
Table 361 Rest of Latin America: Omega-3 Market, By Type, 2025-2035 (USD Million)
Table 362 Rest of Latin America: Dha (Docosahexaenoic Acid) Market, By Type, 2025–2035 (USD Million)
Table 363 Rest of Latin America: Probiotics / Microbiome-Based Ingredients, By Type, 2025-2035 (USD Million)
Table 364 Rest of Latin America: Synthetic Nootropics Market, By Type, 2025-2035 (USD Million)
Table 365 Rest of Latin America: Mental-Care & Nootropic Ingredients Market, By Function, 2025–2035 (USD Million)
Table 366 Rest of Latin America: Mental-Care & Nootropic Ingredients Market, By Application, 2025–2035 (USD Million)
Table 367 Rest of Latin America: Mental-Care & Nootropic Ingredients Market, By Distribution Channel, 2025–2035 (USD Million)
Table 368 Middle East and Africa: Mental-Care & Nootropic Ingredients Market, By Country, 2023–2035 (USD Million)
Table 369 Middle East and Africa: Mental-Care & Nootropic Ingredients Market, By Ingredient Type, 2023-2035 (USD Million)
Table 370 Middle East and Africa: Botanical Extracts Market, By Type, 2023-2035 (USD Million)
Table 371 Middle East and Africa: Vitamins & Minerals Market, By Type, 2023-2035 (USD Million)
Table 372 Middle East and Africa: Amino Acids Market, By Type, 2023-2035 (USD Million)
Table 373 Middle East and Africa: Omega-3 Market, By Type, 2025-2035 (USD Million)
Table 374 Middle East and Africa: Dha (Docosahexaenoic Acid) Market, By Type, 2025–2035 (USD Million)
Table 375 Middle East and Africa: Probiotics / Microbiome-Based Ingredients, By Type, 2025-2035 (USD Million)
Table 376 Middle East and Africa: Synthetic Nootropics Market, By Type, 2025-2035 (USD Million)
Table 377 Middle East and Africa: Mental-Care & Nootropic Ingredients Market, By Function, 2025–2035 (USD Million)
Table 378 Middle East and Africa: Mental-Care & Nootropic Ingredients Market, By Application, 2025–2035 (USD Million)
Table 379 Middle East and Africa: Mental-Care & Nootropic Ingredients Market, By Distribution Channel, 2025–2035 (USD Million)
Table 380 Saudi Arabia: Mental-Care & Nootropic Ingredients Market, By Ingredient Type, 2023-2035 (USD Million)
Table 381 Saudi Arabia: Botanical Extracts Market, By Type, 2023-2035 (USD Million)
Table 382 Saudi Arabia: Vitamins & Minerals Market, By Type, 2023-2035 (USD Million)
Table 383 Saudi Arabia: Amino Acids Market, By Type, 2023-2035 (USD Million)
Table 384 Saudi Arabia: Omega-3 Market, By Type, 2025-2035 (USD Million)
Table 385 Saudi Arabia: Dha (Docosahexaenoic Acid) Market, By Type, 2025–2035 (USD Million)
Table 386 Saudi Arabia: Probiotics / Microbiome-Based Ingredients, By Type, 2025-2035 (USD Million)
Table 387 Saudi Arabia: Synthetic Nootropics Market, By Type, 2025-2035 (USD Million)
Table 388 Saudi Arabia: Mental-Care & Nootropic Ingredients Market, By Function, 2025–2035 (USD Million)
Table 389 Saudi Arabia: Mental-Care & Nootropic Ingredients Market, By Application, 2025–2035 (USD Million)
Table 390 Saudi Arabia: Mental-Care & Nootropic Ingredients Market, By Distribution Channel, 2025–2035 (USD Million)
Table 391 UAE: Mental-Care & Nootropic Ingredients Market, By Ingredient Type, 2023-2035 (USD Million)
Table 392 UAE: Botanical Extracts Market, By Type, 2023-2035 (USD Million)
Table 393 UAE: Vitamins & Minerals Market, By Type, 2023-2035 (USD Million)
Table 394 UAE: Amino Acids Market, By Type, 2023-2035 (USD Million)
Table 395 UAE: Omega-3 Market, By Type, 2025-2035 (USD Million)
Table 396 UAE: Dha (Docosahexaenoic Acid) Market, By Type, 2025–2035 (USD Million)
Table 397 UAE: Probiotics / Microbiome-Based Ingredients, By Type, 2025-2035 (USD Million)
Table 398 UAE: Synthetic Nootropics Market, By Type, 2025-2035 (USD Million)
Table 399 UAE: Mental-Care & Nootropic Ingredients Market, By Function, 2025–2035 (USD Million)
Table 400 UAE: Mental-Care & Nootropic Ingredients Market, By Application, 2025–2035 (USD Million)
Table 401 UAE: Mental-Care & Nootropic Ingredients Market, By Distribution Channel, 2025–2035 (USD Million)
Table 402 South Africa: Mental-Care & Nootropic Ingredients Market, By Ingredient Type, 2023-2035 (USD Million)
Table 403 South Africa: Botanical Extracts Market, By Type, 2023-2035 (USD Million)
Table 404 South Africa: Vitamins & Minerals Market, By Type, 2023-2035 (USD Million)
Table 405 South Africa: Amino Acids Market, By Type, 2023-2035 (USD Million)
Table 406 South Africa: Omega-3 Market, By Type, 2025-2035 (USD Million)
Table 407 South Africa: Dha (Docosahexaenoic Acid) Market, By Type, 2025–2035 (USD Million)
Table 408 South Africa: Probiotics / Microbiome-Based Ingredients, By Type, 2025-2035 (USD Million)
Table 409 South Africa: Synthetic Nootropics Market, By Type, 2025-2035 (USD Million)
Table 410 South Africa: Mental-Care & Nootropic Ingredients Market, By Function, 2025–2035 (USD Million)
Table 411 South Africa: Mental-Care & Nootropic Ingredients Market, By Application, 2025–2035 (USD Million)
Table 412 South Africa: Mental-Care & Nootropic Ingredients Market, By Distribution Channel, 2025–2035 (USD Million)
Table 413 Rest of Middle East & Africa: Mental-Care & Nootropic Ingredients Market, By Ingredient Type, 2023-2035 (USD Million)
Table 414 Rest of Middle East & Africa: Botanical Extracts Market, By Type, 2023-2035 (USD Million)
Table 415 Rest of Middle East & Africa: Vitamins & Minerals Market, By Type, 2023-2035 (USD Million)
Table 416 Rest of Middle East & Africa: Amino Acids Market, By Type, 2023-2035 (USD Million)
Table 417 Rest of Middle East & Africa: Omega-3 Market, By Type, 2025-2035 (USD Million)
Table 418 Rest of Middle East & Africa: Dha (Docosahexaenoic Acid) Market, By Type, 2025–2035 (USD Million)
Table 419 Rest of Middle East & Africa: Probiotics / Microbiome-Based Ingredients, By Type, 2025-2035 (USD Million)
Table 420 Rest of Middle East & Africa: Synthetic Nootropics Market, By Type, 2025-2035 (USD Million)
Table 421 Rest of Middle East & Africa: Mental-Care & Nootropic Ingredients Market, By Function, 2025–2035 (USD Million)
Table 422 Rest of Middle East & Africa: Mental-Care & Nootropic Ingredients Market, By Application, 2025–2035 (USD Million)
Table 423 Rest of Middle East & Africa: Mental-Care & Nootropic Ingredients Market, By Distribution Channel, 2025–2035 (USD Million)
Table 424 Recent Developments, By Company, 2023-2025
List of Figures
Figure 1 Research Process
Figure 2 Key Secondary Sources
Figure 3 Primary Research Techniques
Figure 4 Key Executives Interviewed
Figure 5 Breakdown of Primary Interviews (Supply-Side & Demand-Side)
Figure 6 Market Sizing and Growth Forecast Approach
Figure 7 Global Mental-Care & Nootropic Ingredients Market, By Ingredient Type, 2025 Vs. 2035 (USD Million)
Figure 8 Global Mental-Care & Nootropic Ingredients Market, By Function, 2025 Vs. 2035 (USD Million)
Figure 9 Global Mental-Care & Nootropic Ingredients Market, By Application, 2025 Vs. 2035 (USD Million)
Figure 10 Global Mental-Care & Nootropic Ingredients Market, By Distribution Channel, 2025 Vs. 2035 (USD Million)
Figure 11 Mental-Care & Nootropic Ingredients Market, By Geography
Figure 12 Factors Affecting Market Growth
Figure 13 Global Mental-Care & Nootropic Ingredients Market, By Type, 2025 Vs. 2035 (USD Million)
Figure 14 Global Botanical Extracts Market, By Type, 2025 Vs. 2035 (USD Million)
Figure 15 Global Amino Acids Market, By Type, 2025 Vs. 2035 (USD Million)
Figure 16 Global Vitamins & Minerals Market, By Type, 2025 Vs. 2035 (USD Million)
Figure 17 Global Omega-3 Market, By Type, 2025 Vs. 2035 (USD Million)
Figure 18 Global Probiotics / Microbiome-Based Ingredients Market, By Type, 2025 Vs. 2035 (USD Million)
Figure 19 Global Synthetic Nootropics Market, By Type, 2025 Vs. 2035 (USD Million)
Figure 20 Global Mental-Care & Nootropic Ingredients Market, By Function, 2025 Vs. 2035 (USD Million)
Figure 21 Global Mental-Care & Nootropic Ingredients Market, By Application, 2025 Vs. 2035 (USD Million)
Figure 22 Global Mental-Care & Nootropic Ingredients Market, By Distribution Channel, 2025 Vs. 2035 (USD Million)
Figure 23 Global Mental-Care & Nootropic Ingredients Market, By Region, 2025 Vs. 2035 (USD Million)
Figure 24 North America: Mental-Care & Nootropic Ingredients Market Snapshot
Figure 25 Europe: Mental-Care & Nootropic Ingredients Market Snapshot
Figure 26 Asia-Pacific: Mental-Care & Nootropic Ingredients Market Snapshot
Figure 27 Latin America: Mental-Care & Nootropic Ingredients Market Snapshot
Figure 28 Middle East & Africa: Mental-Care & Nootropic Ingredients Market Snapshot
Figure 29 Key Growth Strategies Adopted by Leading Players, 2023-2025
Figure 30 Mental-Care & Nootropic Ingredients: Competitive Benchmarking, By Region
Figure 31 Competitive Dashboard: Mental-Care & Nootropic Ingredients Market
Figure 32 Mental-Care & Nootropic Ingredients Market Position Analysis, 2024
Figure 33 DSM-Firmenich: Financial Overview (2024)
Figure 34 Daesang Corporation: Financial Overview (2024)
Figure 35 Glanbia Plc: Financial Overview (2024)


Published Date: Feb-2025
Published Date: Jan-2025
Published Date: Jan-2025
Published Date: Oct-2024
Published Date: Aug-2024
Subscribe to get the latest industry updates