Resources
About Us
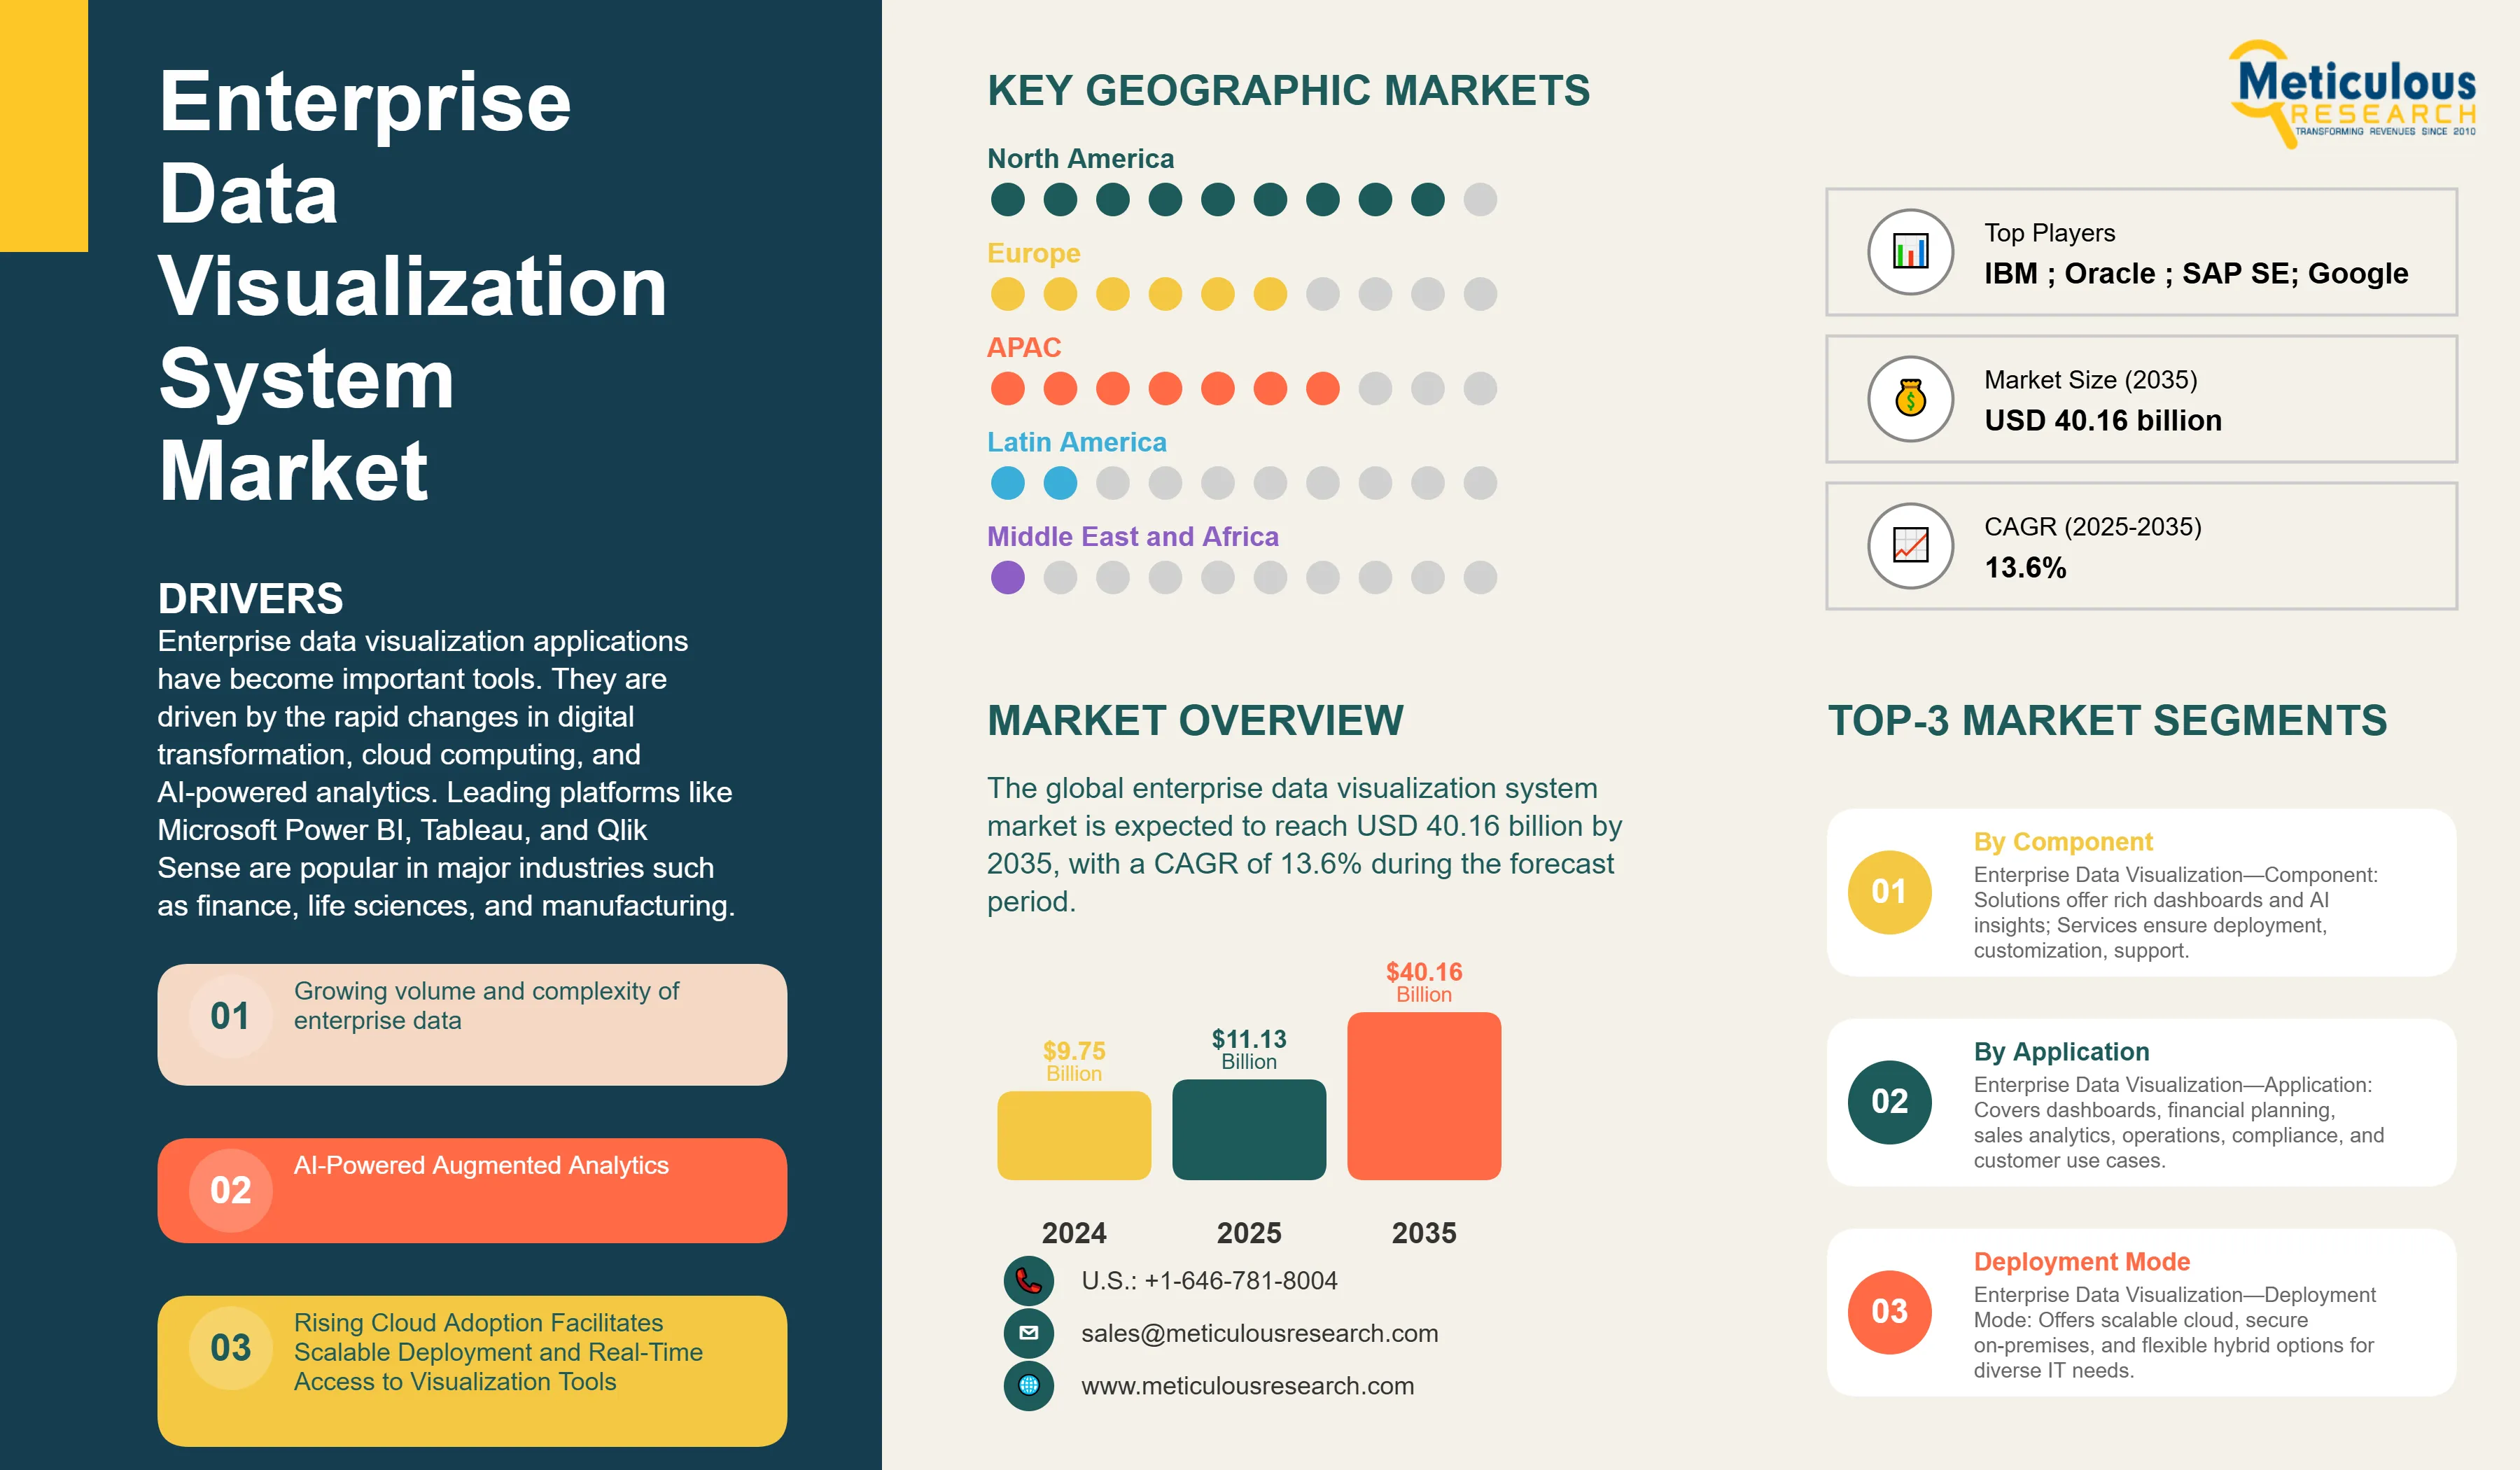
The global enterprise data visualization system market was valued at USD 9.75 billion in 2024. The market is expected to reach USD 40.16 billion by 2035 from USD 11.13 billion in 2025, with a CAGR of 13.6% during the forecast period.
Enterprise data visualization applications have become important tools. They are driven by the rapid changes in digital transformation, cloud computing, and AI-powered analytics. Leading platforms like Microsoft Power BI, Tableau, and Qlik Sense are popular in major industries such as finance, life sciences, and manufacturing. These applications are evolving quickly, embracing advances like real-time analytics, augmented intelligence, and natural language processing. This change is making it easier for more people to use data for decision-making, improving collaboration, and assisting organizations in handling larger data volumes and tougher regulatory requirements.
Competitive Scenario and Insights
Click here to: Get Free Sample Pages of this Report
Microsoft, Salesforce (via Tableau), Qlik, and Google maintain leading roles in the enterprise data visualization market. Each has its own strengths, such as scalability, AI integration, and multi-cloud capabilities. Microsoft Power BI has notably increased its market share after adding Copilot AI. This feature provides automated insights and a natural language query interface, making it easier for non-technical users. Tableau has introduced new tools in embedded analytics for Software-as-a-Service (SaaS) platforms. It offers flexible integration options and better API capabilities designed for enterprise applications. Qlik focuses on real-time data streaming and hybrid cloud functions. It uses Change Data Capture technology to provide near real-time insights and cross-cloud analytics.
In addition to these well-known providers, open-source solutions like Apache Superset and Metabase are becoming popular among businesses that want to keep costs down. These companies are often willing to give up some convenience and customizability. These platforms usually need less technical skill than commercial products. Traditional enterprise customers are increasingly looking for platforms that allow on-premises deployment, work across different platforms, support multi-cloud environments, and provide strong governance controls. Many of these features are improving due to automation, AI, and other new technologies, which reflect changing market needs.
Recent Developments in Enterprise Data Visualization Market
In early 2025, Google improved Looker Studio Pro, its data visualization platform for businesses. The update expanded support for governance, team-based access controls, and integration with BigQuery and Google Workspace. It also enhanced collaborative features, automated report scheduling, live support, and AI-powered Gemini capabilities for natural language data exploration. These upgrades show Google's commitment to using AI-driven analytics in the business sector, competing with Tableau and Power BI.
In April 2024, Salesforce announced new generative AI features in Tableau to automate dashboard creation and generate insights. Tableau’s AI assistant can spot trends, find anomalies, and suggest visualizations based on user questions. Pilot customers said they reduced dashboard creation time by up to 40% and saw more user engagement, using Salesforce’s Einstein GPT technology to make data-driven decisions easier and speed up business insights.
Throughout 2025, Microsoft Power BI released significant updates to its Copilot AI assistant. This upgrade allows users to interact with data naturally, create automated summaries, and build reports using simple language. Improvements include predictive analytics, automated DAX formula support, and the ability to change natural language queries into SQL for large data sets. The integration with the Microsoft 365 ecosystem and Power Platform is growing stronger, enhanced by AI-driven dashboard personalization and tighter governance controls.
Qlik has introduced real-time streaming analytics through Change Data Capture technology. This allows for near real-time insights and smooth hybrid cloud deployments. Their platform now supports both multi-cloud and on-premises setups, with new features allowing live data edits in dashboards. AI-powered automation integrates analytics directly into workflows, providing traceability and version control for business use.
Key Market Drivers of Enterprise Data Visualization Market
The rapid growth in the amount and complexity of data generated by businesses drives the need for data visualization tools. Today, organizations gather large volumes of structured and unstructured data from sources like social media, IoT devices, customer interactions, and operational systems. Traditional data analysis methods find it hard to process this complexity. Modern data visualization platforms tackle this issue by combining different data formats, providing real-time analytics, and allowing for multidimensional exploration. This turns raw data into useful business insights.
Integrating artificial intelligence is changing data visualization by automating complex analytics tasks and making insights available to non-technical users. Augmented analytics powered by AI automates data preparation, pattern detection, and insight generation while providing conversational interfaces for asking questions. These features improve the quality and speed of decision-making in organizations. They also reduce reliance on expert analysts and promote greater access to data. Machine learning increases the relevance of insights through automated storytelling, predictive analytics, and smart recommendations.
Key Market Restraints of Enterprise Data Visualization Market
Despite improvements in low-code interfaces, many data visualization platforms still need technical expertise for setup, integration, and customization. A 2024 survey found that 39% of business users have a hard time creating dashboards without help from data teams. This limits adoption in departments with few resources. Many organizations also struggle to integrate BI tools with old systems and different third-party databases. This creates data silos that hurt the accuracy and timeliness of dashboards. These integration issues increase the need for manual data preparation and slow down decision-making. Although vendors are investing in AI-assisted design, automation, and pre-built connectors to simplify integration, achieving smooth interoperability across complex enterprise IT environments is still a major challenge for widespread market adoption.
Table: Key Factors Impacting Global Enterprise Data Visualization System Market (2025–2035)
Base CAGR: 13.6%
|
Category |
Key Factor |
Short-Term Impact (2025–2028) |
Long-Term Impact (2029–2035) |
Estimated CAGR Impact |
|
Drivers |
1. Growing volume and complexity of enterprise data |
Higher visualization adoption for large datasets |
Universal use for big data and complex analytics |
▲ +2.2% |
|
2. AI-Powered Augmented Analytics |
Early deployment of AI-based insights |
Standardization of AI-driven analytics and decisioning |
▲ +2.1% |
|
|
Restraints |
1. Data Integration Challenges from Disparate Sources |
Delayed deployments and higher project costs |
Mature data integration solutions streamline workflows |
▼ −2.1% |
|
2. Legacy IT Infrastructure and Skills Shortages |
Slow adoption and increased training needs |
Upskilled workforce reduces technical gaps |
▼ −1.9% |
|
|
Opportunities |
1. Industry-specific visualization solutions |
New vertical-focused launches |
Niche dominance in regulated or technical industries |
▲ +2% |
|
2. AI-enabled augmented analytics and automated insights generation |
Faster business insights, improved KPIs |
Fully automated, proactive analytics recommendations |
▲ +1.7% |
|
|
Trends |
1. Integration of AI-driven storytelling and predictive analytics |
Enhanced report narrative and forecast accuracy |
Automated, explainable storytelling as standard |
▲ +2.8% |
|
2. Mobile-first and cross-device UI/UX design adoption |
Increased mobile dashboard access |
Cross-device analytics for all users |
▲ +2.3% |
|
|
Challenges |
1. Managing diverse and unstructured data types across multiple sources |
Complex data preparation tasks |
Automated, unified data handling across sources |
▼ −1.9% |
|
2. Ensuring data governance, transparency, and compliance |
Heightened compliance implementations |
Standardized governance and compliance modules |
▼ −1.6% |
Regional Analysis
North America Leads the Global Enterprise Data Visualization Market with Advanced Data Analytics Infrastructure Adoption
North America dominates the enterprise data visualization market, making up an estimated 40-50% share of the global market. The US is the main driver of this lead, supported by widespread cloud usage, strong analytics infrastructure, and a culture of data-driven decision-making. By the end of 2023, more than 70 percent of U.S. companies had adopted cloud-based business intelligence solutions. This shift boosted demand for advanced visualization platforms that incorporate AI features.
Major companies like JPMorgan Chase and Walmart use data visualization technologies extensively to improve operations, track ESG metrics, and gain better customer insights. Government programs, including a $100 million initiative from the Department of Energy, promote the development of visualization tools for climate modeling and clean energy optimization. The maturity of vendor ecosystems, high levels of digital literacy, and strong regulatory frameworks further strengthen North America's leading position. Additionally, Canadian businesses, especially mid-sized firms, are quickly adopting data visualization to enhance remote workforce management and sustainability reporting.
Asia-Pacific Emerges as the Fastest Growing Market for Enterprise Data Visualization Fueled by Mobile Analytics and Government Support
The Asia-Pacific region is seeing the fastest growth in enterprise data visualization adoption, driven by mobile-first strategies, increasing cloud penetration, and active government digitalization efforts. Mobile data traffic in Asia-Pacific is expected to quadruple between 2023 and 2030, driven by increased consumption of data-intensive content and 5G adoption. This surge is creating a demand for responsive, mobile-compatible dashboards that address the needs of a digitally connected workforce.
The extensive use of big data in manufacturing, financial services, retail, and telecommunications increases the need for powerful visualization tools that can simplify complex data sets. Government-led smart city projects and digital governance initiatives in countries like China and India speed up implementation in public sector organizations. Local vendors are offering customized platforms designed for regional languages and mobile interfaces, boosting adoption among varied user groups. Key industries such as manufacturing, logistics, and public services in China, India, and Southeast Asia are quickly integrating visualization technologies, driving strong market growth in the region.
Segmental Analysis
Integrated Solutions Propel Enterprise Digital Intelligence
In 2025, the solutions segment leads the overall enterprise data visualization market, capturing an estimated 60-70% share. These integrated software platforms offer broad capabilities, including interactive dashboards, real-time analytics, collaboration tools, and AI-driven insights that support complete business intelligence workflows. They help enterprises visualize complex and large datasets in usable formats, speeding up decision-making and improving collaboration across departments. Key features like augmented analytics, natural language querying, and mobile reporting interfaces have boosted user access and engagement. The strong growth in the solutions segment shows how enterprises focus on using data visualization as a driver for digital intelligence transformation, operational excellence, and competitive edge.
Cloud-Based Visualization Solutions Lead with Scalability and Remote Access
Based on deployment mode, cloud-based platforms dominate the data visualization market because they offer key advantages in scalability, remote access, and real-time collaboration. These features are essential for today’s distributed work environment. These platforms provide complete visualization tools, including interactive dashboards, AI insights, and integration of data from multiple sources. Companies see benefits from faster setup times, lighter infrastructure needs, and easy connections with cloud data warehouses like Snowflake and BigQuery. Vendors stand out by offering customizable templates, better reporting, and different pricing options. This makes cloud-based solutions attractive to large corporations and growing mid-sized businesses. The cloud’s flexibility and automatic upgrades also boost its popularity, strengthening its position in the market.
|
Report Attribute |
Details |
|
Market size (2025) |
USD 11.13 billion |
|
Revenue forecast in 2035 |
USD 40.16 billion |
|
CAGR (2025-2035) |
13.6% |
|
Base Year |
2024 |
|
Forecast period |
2025 – 2035 |
|
Report coverage |
Market size and forecast, competitive landscape and benchmarking, country/regional level analysis, key trends, growth drivers and restraints |
|
Segments covered |
Component (Solution, Services), Deployment Mode (Cloud, On-Premise, Hybrid), Application, Organization Size, Industry Vertical. Geography |
|
Regional scope |
North America, Europe, Asia-Pacific, Latin America, and Middle East & Africa |
|
Key companies profiled |
Microsoft Corporation; Tableau Software (Salesforce); Qlik Technologies, Inc.; IBM Corporation; Oracle Corporation; SAP SE; Google LLC (Looker Studio); TIBCO Software Inc.; SAS Institute Inc.; MicroStrategy Incorporated; Zoho Corporation; Amazon Web Services (QuickSight); ThoughtSpot; Domo, Inc.; Sisense; Yellowfin BI; Dundas Data Visualization; InetSoft Technology Corporation; Dataiku; Panoply |
|
Customization |
Comprehensive report customization with purchase. Addition or modification to country, regional & segment scope available |
|
Pricing Details |
Access customized purchase options to meet your specific research requirements. Explore flexible pricing models |
Market Segmentation
The Enterprise Data Visualization System Market size is estimated to be USD 9.75 billion in 2025 and grow at a CAGR of 13.6% from 2025 to reach USD 40.16 billion by 2035.
In 2024, the Enterprise Data Visualization System Market size was estimated at USD 9.75 billion, with projections to reach USD 11.13 billion in 2025.
Microsoft Corporation, Tableau Software (Salesforce), Qlik Technologies, Inc., IBM Corporation, Oracle Corporation, SAP SE, Google LLC (Looker Studio), TIBCO Software Inc., SAS Institute Inc., MicroStrategy Incorporated, Zoho Corporation, and Panoply among others are the major companies operating in the Enterprise Data Visualization System Market.
The Asia-Pacific region is projected to grow at the fastest CAGR over the forecast period (2025-2035).
Cloud-based solutions dominate the overall enterprise data visualization market.
1. Market Definition & Scope
1.1. Market Definition
1.2. Market Ecosystem
1.3. Currency
1.4. Key Stakeholders
2. Research Methodology
2.1. Research Approach
2.2. Process of Data Collection and Validation
2.2.1. Secondary Research
2.2.2. Primary Research/Interviews with Key Opinion Leaders from the Industry
2.3. Market Sizing and Forecast
2.3.1. Market Size Estimation Approach
2.3.1.1. Bottom-up Approach
2.3.1.2. Top-down Approach
2.3.2. Growth Forecast Approach
2.3.3. Assumptions for the Study
3. Executive Summary
3.1. Overview
3.2. Segmental Analysis
3.2.1. Enterprise Data Visualization System Market, by Component
3.2.2. Enterprise Data Visualization System Market, by Deployment Mode
3.2.3. Enterprise Data Visualization System Market, by Organization Type
3.2.4. Enterprise Data Visualization System Market, by Region
3.3. Competitive Landscape
3.4. Strategic Recommendations
4. Market Insights
4.1. Overview
4.2. Factors Affecting Market Growth
4.2.1. Drivers
4.2.1.1. Growing volume and complexity of enterprise data
4.2.1.2. AI-Powered Augmented Analytics
4.2.1.3. Rising Cloud Adoption Facilitates Scalable Deployment and Real-Time Access to Visualization Tools
4.2.1.4. Growing Need for Decision Support and Collaborative Analytics
4.2.2. Restraints
4.2.2.1. Data Integration Challenges from Disparate Sources
4.2.2.2. Legacy IT Infrastructure and Skills Shortages
4.2.2.3. User adoption hurdles related to complexity and training needs
4.2.3. Opportunities
4.2.3.1. Industry-specific visualization solutions for finance, healthcare, manufacturing, retail, and telecom
4.2.3.2. AI-enabled augmented analytics and automated insights generation
4.2.3.3. Expansion of embedded and predictive analytics within enterprise applications
4.2.3.4. Growth in cloud-native and hybrid deployment models
4.2.4. Trends
4.2.4.1. Integration of AI-driven storytelling and predictive analytics
4.2.4.2. Emphasis on collaboration tools, data democratization, and self-service analytics
4.2.4.3. Mobile-first and cross-device UI/UX design adoption
4.2.5. Challenges
4.2.5.1. Managing diverse and unstructured data types across multiple sources
4.2.5.2. Balancing ease of use with advanced analytical capability for heterogeneous user bases
4.2.5.3. Ensuring data governance, transparency, and compliance
4.3. Porter's Five Forces Analysis
4.3.1. Bargaining Power of Suppliers
4.3.2. Bargaining Power of Buyers
4.3.3. Threat of Substitutes
4.3.4. Threat of New Entrants
4.3.5. Degree of Competition
4.4. Technology Impact on Enterprise Data Visualization System Market
4.4.1. AI and ML integration driving automated insight generation and anomaly detection
4.4.2. Cloud infrastructure enabling scalable, elastic deployments and global access
4.4.3. Real-time data streaming and visualization for immediate operational intelligence
4.4.4. Enhanced data blending, natural language querying, and interactive dashboards
5. Impact of Sustainability on Enterprise Data Visualization System Market
5.1. Enabling enterprises to track and visualize ESG metrics and sustainability KPIs
5.2. Driving operational efficiency and resource optimization through better data insights
5.3. Reducing reliance on physical documents and legacy reporting processes
5.4. Supporting regulatory compliance for carbon footprint and energy usage reporting
6. Competitive Landscape
6.1. Overview
6.2. Key Growth Strategies
6.3. Competitive Benchmarking
6.4. Competitive Dashboard
6.4.1. Industry Leaders
6.4.2. Market Differentiators
6.4.3. Vanguards
6.4.4. Contemporary Stalwarts
6.5. Market Share/Ranking Analysis, by Key Players, 2024
7. Enterprise Data Visualization System Market Assessment—By Component Type
7.1. Overview
7.2. Solutions
7.3. Services
8. Enterprise Data Visualization System Market Assessment—By Application
8.1. Overview
8.2. Executive Dashboards & KPI Monitoring
8.3. Financial Reporting & Planning
8.4. Sales & Marketing Analytics
8.5. Operations & Performance Management
8.6. Risk Management & Compliance
8.7. Customer Analytics
9. Enterprise Data Visualization System Market Assessment—By Deployment Mode
9.1. Overview
9.2. Cloud-based
9.3. On-Premises
9.4. Hybrid
10. Enterprise Data Visualization System Market Assessment—By Industry Vertical
10.1. Overview
10.2. Financial Services & Banking
10.3. Healthcare & Life Sciences
10.4. Manufacturing & Industrial
10.5. Retail & E-commerce
10.6. Government & Public Sector
10.7. Telecommunications
10.8. Energy & Utilities
10.9. Others
11. Enterprise Data Visualization System Market Assessment—By Organization Size
11.1. Overview
11.2. Large Enterprises
11.3. Small and Medium Enterprises
12. Enterprise Data Visualization System Market Assessment—By Geography
12.1. Overview
12.2. North America
12.2.1. U.S.
12.2.2. Canada
12.3. Europe
12.3.1. Germany
12.3.2. U.K.
12.3.3. France
12.3.4. Netherlands
12.3.5. Switzerland
12.3.6. Rest of Europe
12.4. Asia-Pacific
12.4.1. China
12.4.2. Japan
12.4.3. South Korea
12.4.4. Taiwan
12.4.5. India
12.4.6. Singapore
12.4.7. Australia
12.4.8. Rest of Asia-Pacific
12.5. Latin America
12.5.1. Brazil
12.5.2. Mexico
12.5.3. Argentina
12.5.4. Rest of Latin America
12.6. Middle East & Africa
12.6.1. UAE
12.6.2. Saudi Arabia
12.6.3. Israel
12.6.4. South Africa
12.6.5. Rest of Middle East & Africa
13. Company Profiles (Business Overview, Financial Overview, Product Portfolio, Strategic Developments, and SWOT Analysis)
13.1. Microsoft Corporation
13.2. Tableau Software (Salesforce)
13.3. Qlik Technologies, Inc.
13.4. IBM Corporation
13.5. Oracle Corporation
13.6. SAP SE
13.7. Google LLC (Looker Studio)
13.8. TIBCO Software Inc.
13.9. SAS Institute Inc.
13.10. MicroStrategy Incorporated
13.11. Zoho Corporation
13.12. Amazon Web Services (QuickSight)
13.13. ThoughtSpot
13.14. Domo, Inc.
13.15. Sisense
13.16. Yellowfin BI
13.17. Dundas Data Visualization
13.18. InetSoft Technology Corporation
13.19. Dataiku
13.20. Panoply
13.21. Others
14. Appendix
14.1. Available Customization
14.2. Related Reports


Published Date: Aug-2025
Published Date: Jan-2025
Subscribe to get the latest industry updates