Resources
About Us
This in-depth market research report analyzes the global construction waste management market, evaluating how waste management solution providers are addressing increasing regulatory requirements, sustainability goals, resource efficiency challenges, and environmental compliance across various construction sectors and regions. The report provides a strategic analysis of market dynamics, growth projections till 2032, and competitive positioning across global and regional/country-level markets.
Key Market Drivers & Trends and Insights
Click here to: Get Free Sample Pages of this Report
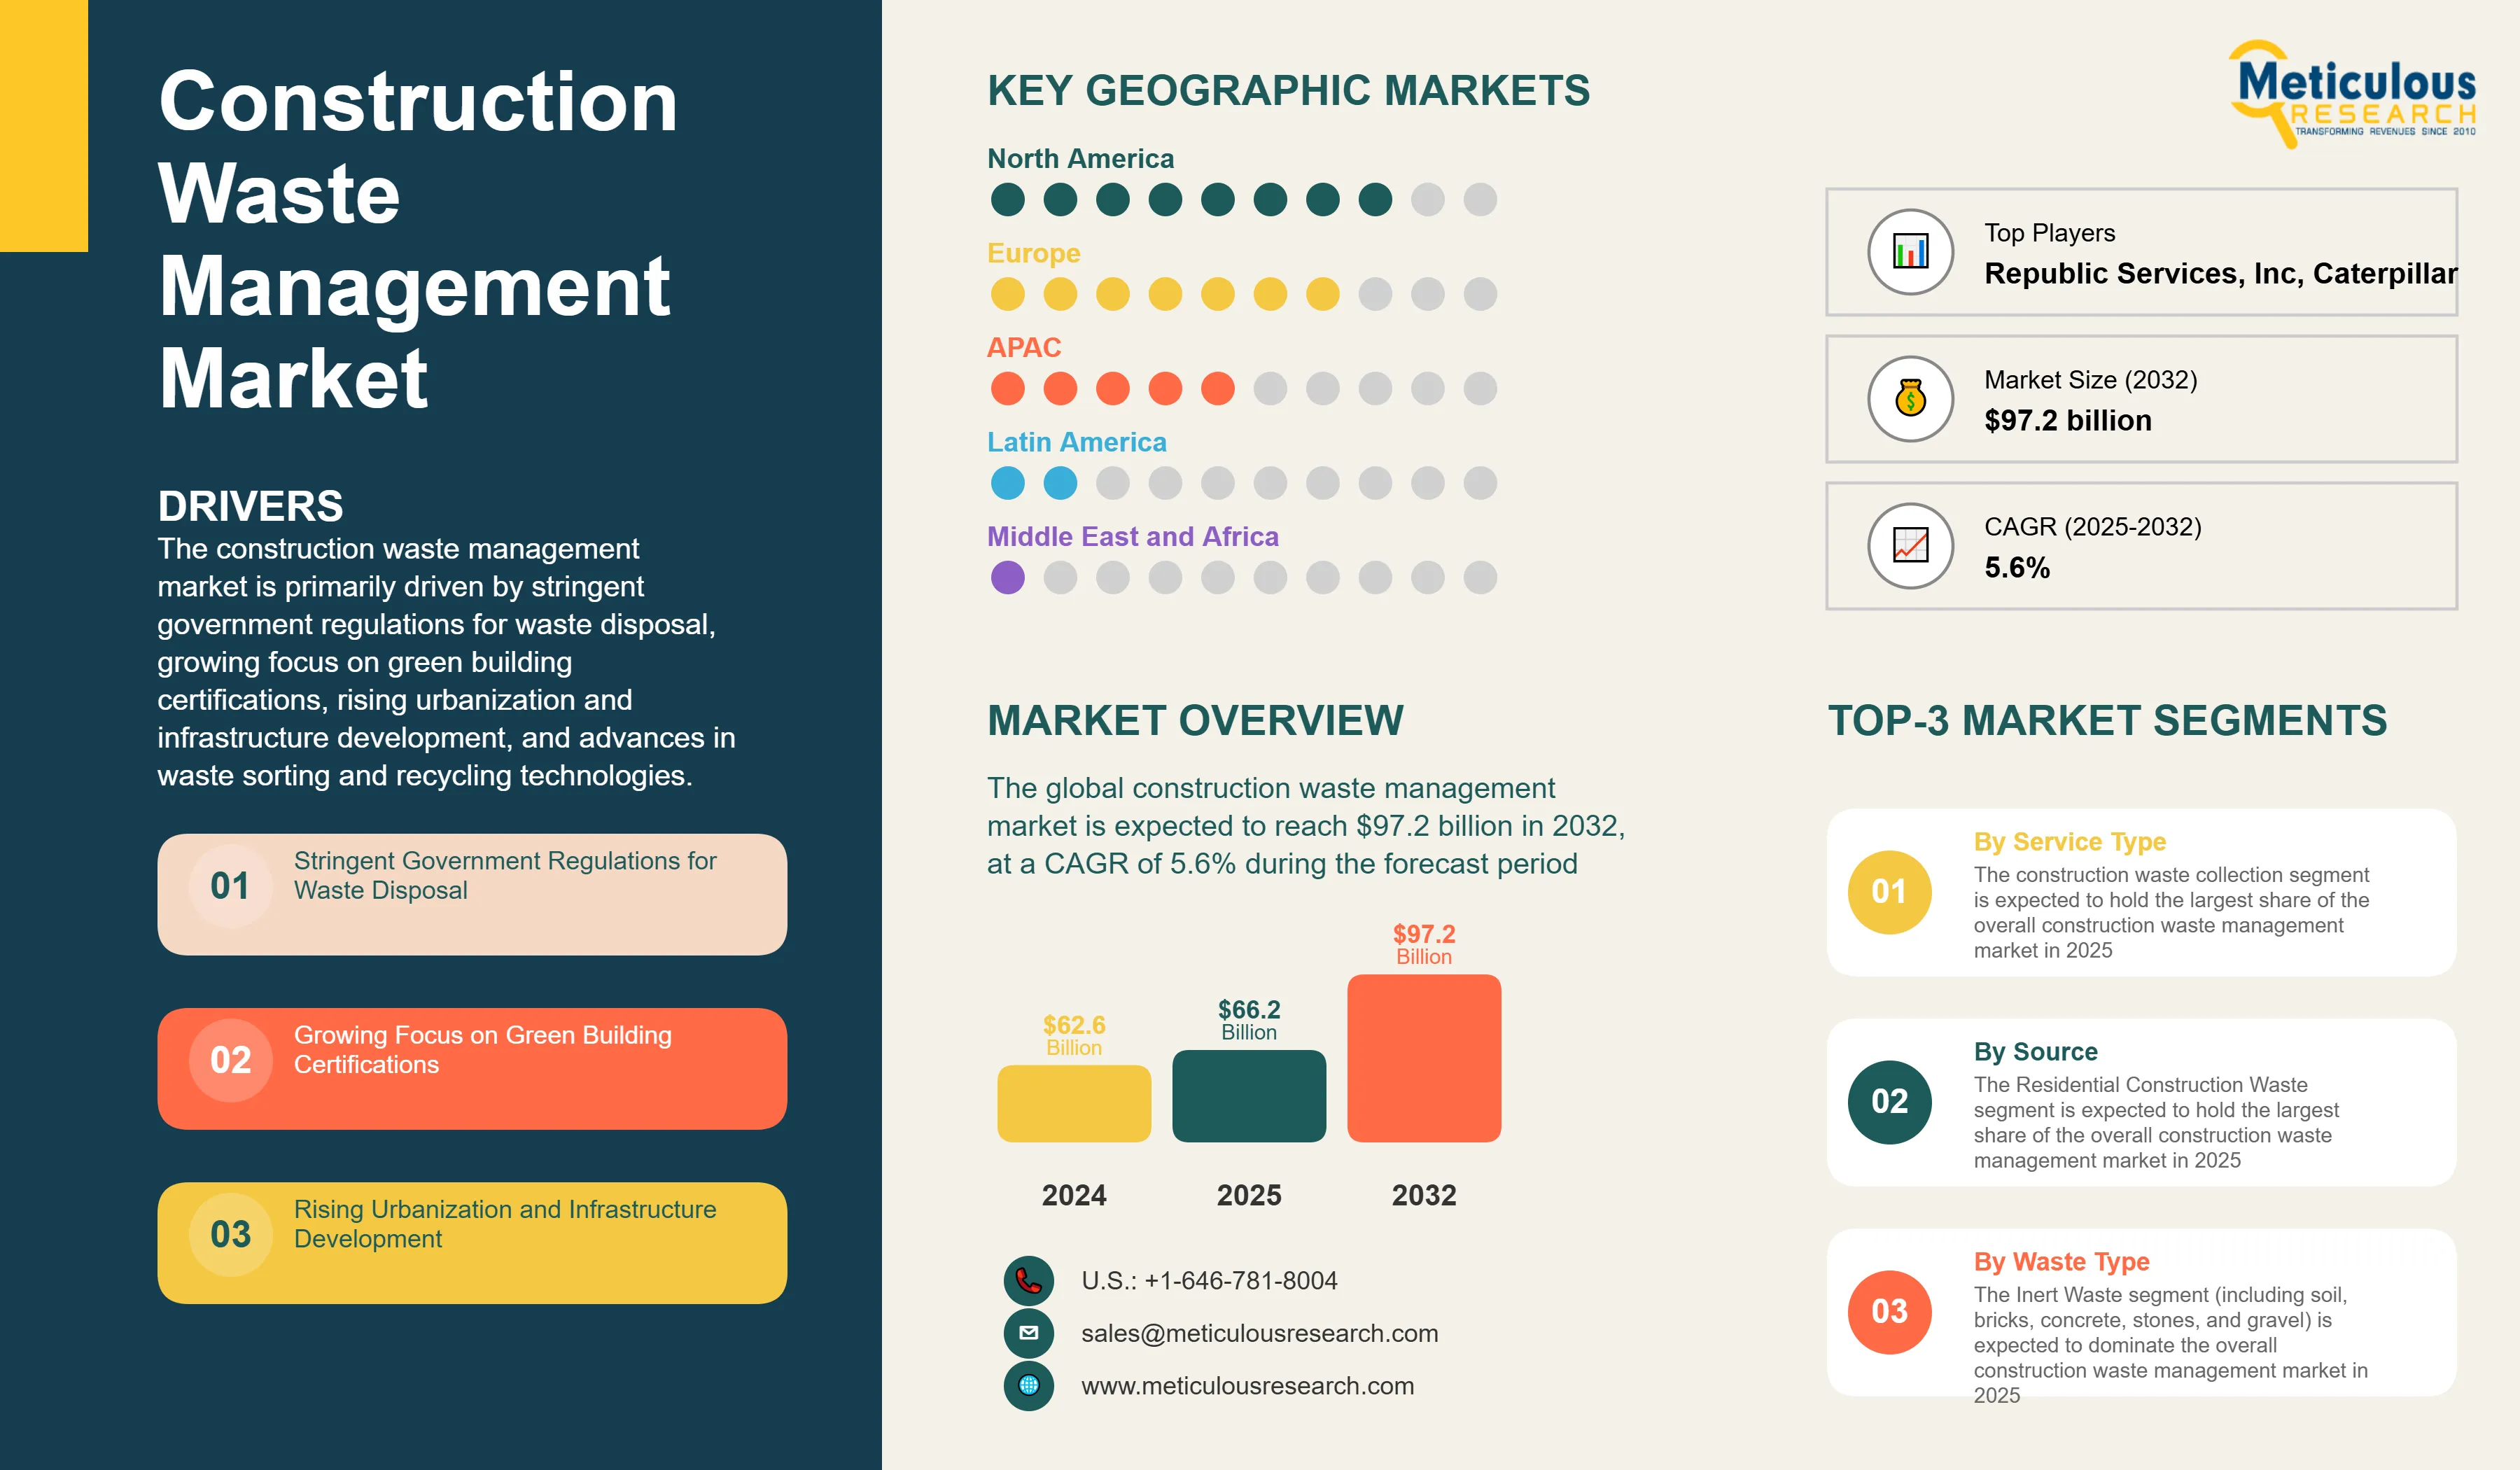
The construction waste management market is primarily driven by stringent government regulations for waste disposal, growing focus on green building certifications, rising urbanization and infrastructure development, and advances in waste sorting and recycling technologies. On-site waste sorting and processing is transforming the industry, while prefabrication to minimize construction waste is gaining significant traction. Additionally, blockchain-based waste chain-of-custody systems and integration of waste data with Building Information Modeling (BIM) are further driving market growth, especially in North America and Europe.
Key Challenges
Despite significant growth potential, the overall construction waste management market faces challenges to some extent including high initial implementation costs, lack of awareness in developing regions, and complex logistical challenges in urban areas. Additionally, contamination in mixed construction waste, balancing cost with sustainability goals, varying regulatory standards across regions, and limited markets for recycled construction materials present significant barriers, potentially slowing down market adoption in different sectors across the globe.
Growth Opportunities
The construction waste management market offers several high-growth opportunities. Circular economy initiatives in construction are driving innovation across multiple segments. Another major opportunity lies in digital waste tracking and management systems. Additionally, resource recovery from construction & demolition waste is creating new revenue streams for solution providers, as organizations increasingly seek to maximize the value of waste materials and minimize disposal costs.
Market Segmentation Highlights
By Service Type
The construction waste collection segment is expected to hold the largest share of the overall construction waste management market in 2025, due to the essential role of waste removal services in construction projects, including containers, dumpsters, and transportation. The construction waste recycling segment follows closely, particularly growing in importance as sustainability regulations become more stringent. However, the Waste Minimization Planning segment is expected to grow at the highest CAGR during the forecast period, driven by increasing emphasis on pre-construction waste reduction strategies and growing demand for specialized consulting, waste audits, and compliance reporting as organizations implement and optimize their construction waste management programs.
By Waste Type
The Inert Waste segment (including soil, bricks, concrete, stones, and gravel) is expected to dominate the overall construction waste management market in 2025, primarily due to its high volume and weight in construction and demolition activities. However, the Plastic Waste segment is expected to grow at the highest CAGR through 2032, driven by increasing regulatory pressures on plastic pollution, growing emphasis on plastic recycling, and innovations in plastic waste processing technologies that enable more effective recovery and reuse.
By Source
The Residential Construction Waste segment is expected to hold the largest share of the overall construction waste management market in 2025, as housing development, renovations, and demolition generate significant waste volumes that require proper management. The Commercial Construction segment follows as retail, office, healthcare, and educational facilities implement comprehensive waste management strategies to meet sustainability goals. However, the Infrastructure and Public Works segment is expected to experience the fastest growth rate during the forecast period, driven by increasing government investments in sustainable infrastructure, large-scale public projects, and growing requirements for waste management compliance in publicly funded construction activities.
By Geography
North America is expected to hold the largest share of the global construction waste management market in 2025, driven by stringent regulatory environments, high adoption of green building certifications, and significant investment in waste recycling technology innovation. Additionally, growing sustainability commitments from major construction firms contribute significantly to market dominance. Europe follows as the second-largest market, bolstered by advanced circular economy frameworks and strong public environmental consciousness. However, Asia-Pacific is witnessing the fastest growth rate during the forecast period, primarily driven by rapid urbanization, increasing construction activities in emerging economies, and strengthening waste management regulations in countries like China and India.
Competitive Landscape
The global construction waste management market features a diverse competitive landscape with established waste management companies, recycling specialists, equipment manufacturers, and innovative digital solution developers pursuing varied approaches to construction waste management.
The broader solution provider landscape is categorized into industry leaders, market differentiators, vanguards, and contemporary stalwarts, with each group employing distinctive strategies to maintain competitive advantage. Leading providers are focusing on integrated solutions that combine traditional waste management with digital tracking systems and circular economy principles while addressing industry-specific challenges.
The key players operating in the global construction waste management market are Waste Management, Inc., Republic Services, Inc., Veolia Environment S.A., Caterpillar Inc., Hitachi Construction Machinery Co., Ltd., Terex Corporation, Komptech GmbH, Rubble Master HMH GmbH, Metso Outotec Corporation, Doppstadt GmbH, HAAS Recycling Systems, BHS-Sonthofen GmbH, and ARJES GmbH, among others.
|
Particulars |
Details |
|
Number of Pages |
205 |
|
Format |
PDF & Excel |
|
Forecast Period |
2025–2032 |
|
Base Year |
2024 |
|
CAGR (Value) |
5.6% |
|
Market Size (Value) in 2025 |
USD 66.2 Billion |
|
Market Size (Value) in 2032 |
USD 97.2 Billion |
|
Segments Covered |
Market Assessment, by Service Type
Market Assessment, by Waste Type
Market Assessment, by Source
|
|
Countries Covered |
North America (U.S., Canada, Mexico), Europe (Germany, France, U.K., Italy, Spain, Nordics, Rest of Europe), Asia-Pacific (China, Japan, India, Australia, South Korea, Rest of Asia-Pacific), Latin America (Brazil, Argentina, Rest of Latin America), Middle East & Africa (UAE, Saudi Arabia, South Africa, Rest of Middle East & Africa) |
|
Key Companies |
Waste Management, Inc., Republic Services, Inc., Veolia Environment S.A., Caterpillar Inc., Hitachi Construction Machinery Co., Ltd., Terex Corporation, Komptech GmbH, Rubble Master HMH GmbH, Metso Outotec Corporation, Doppstadt GmbH, HAAS Recycling Systems, BHS-Sonthofen GmbH, ARJES GmbH |
The global construction waste management market was valued at $62.6 billion in 2024. This market is expected to reach approximately $66.2 billion in 2025, and is projected to grow at a CAGR of 5.6% from 2025 to 2034, reaching an estimated value of $97.2 billion by 2032.
The global construction waste management market is expected to grow at a CAGR of 5.6% during the forecast period of 2025–2032.
The global construction waste management market is expected to reach approximately $97.2 billion by 2032, growing from an estimated $66.2 billion in 2025, at a CAGR of 5.6% during the forecast period of 2025–2032.
The key companies operating in this market include Waste Management, Inc., Republic Services, Inc., Veolia Environment S.A., Caterpillar Inc., Hitachi Construction Machinery Co., Ltd., Terex Corporation, Komptech GmbH, Rubble Master HMH GmbH, Metso Outotec Corporation, Doppstadt GmbH, HAAS Recycling Systems, BHS-Sonthofen GmbH, and ARJES GmbH.
Major trends shaping the market include on-site waste sorting and processing, prefabrication to minimize construction waste, blockchain-based waste chain-of-custody systems, and integration of waste data with Building Information Modeling (BIM).
• In 2025, the Collection segment is expected to dominate the overall construction waste management market by service type
• Based on waste type, the Inert Waste segment is expected to hold the largest share of the overall construction waste management market in 2025
• Based on source, the Residential Construction segment is expected to hold the largest share of the global construction waste management market in 2025
North America is expected to hold the largest share of the global construction waste management market in 2025, driven by stringent regulatory environments, high adoption of green building certifications, and significant investment in waste recycling technology innovation. Asia-Pacific is witnessing the fastest growth rate during the forecast period.
The growth of this market is driven by stringent government regulations for waste disposal, growing focus on green building certifications, rising urbanization and infrastructure development, and advances in waste sorting and recycling technologies.
1. Market Definition & Scope
1.1. Market Definition
1.2. Market Ecosystem
1.3. Currency
1.4. Key Stakeholders
2. Research Methodology
2.1. Research Approach
2.2. Process of Data Collection and Validation
2.2.1. Secondary Research
2.2.2. Primary Research / Interviews with Key Opinion Leaders from the Industry
2.3. Market Sizing and Forecast
2.3.1. Market Size Estimation Approach
2.3.2. Bottom-up Approach
2.3.3. Top-down Approach
2.3.4. Growth Forecast Approach
2.3.5. Assumptions for the Study
3. Executive Summary
3.1. Overview
3.2. Segmental Analysis
3.2.1. Construction Waste Management Market, by Service Type
3.2.2. Construction Waste Management Market, by Waste Type
3.2.3. Construction Waste Management Market, by Source
3.2.4. Construction Waste Management Market, by Geography
3.3. Competitive Landscape
4. Market Insights
4.1. Overview
4.2. Factors Affecting Market Growth
4.2.1. Drivers
4.2.1.1. Stringent Government Regulations for Waste Disposal
4.2.1.2. Growing Focus on Green Building Certifications
4.2.1.3. Rising Urbanization and Infrastructure Development
4.2.1.4. Advances in Waste Sorting and Recycling Technologies
4.2.2. Restraints
4.2.2.1. High Initial Implementation Costs
4.2.2.2. Lack of Awareness in Developing Regions
4.2.2.3. Complex Logistical Challenges in Urban Areas
4.2.3. Opportunities
4.2.3.1. Circular Economy Initiatives in Construction
4.2.3.2. Digital Waste Tracking and Management Systems
4.2.3.3. Resource Recovery from Construction & Demolition Waste
4.2.4. Trends
4.2.4.1. On-site Waste Sorting and Processing
4.2.4.2. Prefabrication to Minimize Construction Waste
4.2.4.3. Blockchain-based Waste Chain-of-Custody Systems
4.2.4.4. Integration of Waste Data with Building Information Modeling (BIM)
4.2.5. Challenges
4.2.5.1. Contamination in Mixed Construction Waste
4.2.5.2. Balancing Cost with Sustainability Goals
4.2.5.3. Varying Regulatory Standards Across Regions
4.2.5.4. Limited Markets for Recycled Construction Materials
4.3. Porter's Five Forces Analysis
4.3.1. Bargaining Power of Suppliers
4.3.2. Bargaining Power of Buyers
4.3.3. Threat of Substitutes
4.3.4. Threat of New Entrants
4.3.5. Competitive Rivalry
4.4. Impact of Sustainability on Construction Waste Management Market
4.4.1. Sustainable Building Certification Programs and Waste Requirements
4.4.2. Circular Economy Principles in Construction Waste
4.4.3. Regulatory Developments for Construction Waste Reduction
4.4.4. Digital Technologies for Waste Tracking and Management
4.4.5. Corporate Sustainability Goals and Construction Waste Metrics
4.4.6. Economic Incentives and Cost Benefits of Waste Diversion
4.4.7. Supply Chain Collaboration for Improved Waste Management
4.4.8. Future Trends in Sustainable Construction Waste Practices
5. Construction Waste Management Market Assessment—by Service Type
5.1. Collection
5.2. Recycling
5.3. Disposal
5.4. Waste Minimization Planning
6. Construction Waste Management Market Assessment—by Waste Type
6.1. Inert Waste
6.1.1. Soil and Sand
6.1.2. Bricks and Concrete
6.1.3. Stones and Gravel
6.2. Wood Waste
6.3. Drywall
6.4. Metal Waste
6.5. Plastic Waste
6.6. Packaging Waste
6.7. Hazardous Waste
6.8. Other Waste Types
7. Construction Waste Management Market Assessment—by Source
7.1. Residential Construction
7.1.1. New Construction
7.1.2. Renovation
7.1.3. Demolition
7.2. Commercial Construction
7.2.1. Office Buildings
7.2.2. Retail and Hospitality
7.2.3. Healthcare Facilities
7.2.4. Educational Institutions
7.3. Industrial Construction
7.4. Infrastructure and Public Works
7.4.1. Roads and Highways
7.4.2. Bridges and Tunnels
7.4.3. Utility Infrastructure
7.4.4. Public Buildings
8. Construction Waste Management Market Assessment—by Geography
8.1. North America
8.1.1. U.S.
8.1.2. Canada
8.1.3. Mexico
8.2. Europe
8.2.1. Germany
8.2.2. France
8.2.3. U.K.
8.2.4. Italy
8.2.5. Spain
8.2.6. Nordics
8.2.7. Rest of Europe (RoE)
8.3. Asia-Pacific
8.3.1. China
8.3.2. Japan
8.3.3. India
8.3.4. Australia
8.3.5. South Korea
8.3.6. Rest of Asia-Pacific (RoAPAC)
8.4. Latin America
8.4.1. Brazil
8.4.2. Argentina
8.4.3. Rest of Latin America (RoLATAM)
8.5. Middle East & Africa
8.5.1. UAE
8.5.2. Saudi Arabia
8.5.3. South Africa
8.5.4. Rest of Middle East & Africa (RoMEA)
9. Competitive Landscape
9.1. Overview
9.2. Key Growth Strategies
9.3. Competitive Benchmarking
9.4. Competitive Dashboard
9.4.1. Industry Leaders
9.4.2. Market Differentiators
9.4.3. Vanguards
9.4.4. Contemporary Stalwarts
9.5. Market Share & Ranking Analysis, by Key Players, 2025
10. Company Profiles (Business Overview, Financial Overview, Product Portfolio, Strategic Developments, and SWOT Analysis)
10.1. Waste Management, Inc.
10.2. Republic Services, Inc.
10.3. Veolia Environment S.A.
10.4. Caterpillar Inc.
10.5. Hitachi Construction Machinery Co., Ltd.
10.6. Terex Corporation
10.7. Komptech GmbH
10.8. Rubble Master HMH GmbH
10.9. Metso Outotec Corporation
10.10. Doppstadt GmbH
10.11. HAAS Recycling Systems
10.12. BHS-Sonthofen GmbH
10.13. ARJES GmbH
11. Appendix
11.1. Available Customization
11.2. Related Reports
LIST OF TABLES
Global Market Overview
Table 1: Global Construction Waste Management Market, 2023–2032 (USD Million)
Table 2: Global Construction Waste Management Market, by Service Type, 2023–2032 (USD Million)
Table 3: Global Construction Waste Management Market, by Waste Type, 2023–2032 (USD Million)
Table 4: Global Construction Waste Management Market, by Source, 2023–2032 (USD Million)
Table 5: Global Construction Waste Management Market, by Region/Country, 2023–2032 (USD Million)
Service Type Segment
Table 6: Global Construction Waste Collection Services Market, by Type, 2023–2032 (USD Million)
Table 7: Global Construction Waste Collection Services Market, by Region/Country, 2023–2032 (USD Million)
Table 8: Global Construction Waste Recycling Services Market, by Region/Country, 2023–2032 (USD Million)
Table 9: Global Construction Waste Disposal Services Market, by Region/Country, 2023–2032 (USD Million)
Table 10: Global Construction Waste Minimization Planning Services Market, by Region/Country, 2023–2032 (USD Million)
Waste Type Segment
Table 11: Global Construction Inert Waste Market, by Region/Country, 2023–2032 (USD Million)
Table 12: Global Construction Soil and Sand Waste Market, by Region/Country, 2023–2032 (USD Million)
Table 13: Global Construction Bricks and Concrete Waste Market, by Region/Country, 2023–2032 (USD Million)
Table 14: Global Construction Stones and Gravel Waste Market, by Region/Country, 2023–2032 (USD Million)
Table 15: Global Construction Wood Waste Market, by Region/Country, 2023–2032 (USD Million)
Table 16: Global Construction Drywall Waste Market, by Region/Country, 2023–2032 (USD Million)
Table 17: Global Construction Metal Waste Market, by Region/Country, 2023–2032 (USD Million)
Table 18: Global Construction Plastic Waste Market, by Region/Country, 2023–2032 (USD Million)
Table 19: Global Construction Packaging Waste Market, by Region/Country, 2023–2032 (USD Million)
Table 20: Global Construction Hazardous Waste Market, by Region/Country, 2023–2032 (USD Million)
Table 21: Other Waste Types Market, by Region/Country, 2023–2032 (USD Million)
Source Segment
Table 22: Global Residential Construction Waste Management Market, by Source, 2023–2032 (USD Million)
Table 23: Global Residential Construction Waste Management Market, by Region/Country, 2023–2032 (USD Million)
Table 24: Global New Construction Waste Management Market, by Region/Country, 2023–2032 (USD Million)
Table 25: Global Renovation Waste Management Market, by Region/Country, 2023–2032 (USD Million)
Table 26: Global Demolition Waste Management Market, by Region/Country, 2023–2032 (USD Million)
Table 27: Global Commercial Construction Waste Management Market, by Region/Country, 2023–2032 (USD Million)
Table 28: Global Office Buildings Construction Waste Management Market, by Region/Country, 2023–2032 (USD Million)
Table 29: Global Retail and Hospitality Construction Waste Management Market, by Region/Country, 2023–2032 (USD Million)
Table 30: Global Healthcare Facilities Construction Waste Management Market, by Region/Country, 2023–2032 (USD Million)
Table 31: Global Educational Institutions Construction Waste Management Market, by Region/Country, 2023–2032 (USD Million)
Table 32: Global Industrial Construction Waste Management Market, by Region/Country, 2023–2032 (USD Million)
Table 33: Global Infrastructure and Public Works Construction Waste Management Market, by Region/Country, 2023–2032 (USD Million)
Table 34: Global Roads and Highways Construction Waste Management Market, by Region/Country, 2023–2032 (USD Million)
Table 35: Global Bridges and Tunnels Construction Waste Management Market, by Region/Country, 2023–2032 (USD Million)
Table 36: Global Utility Infrastructure Construction Waste Management Market, by Region/Country, 2023–2032 (USD Million)
Table 37: Global Public Buildings Construction Waste Management Market, by Region/Country, 2023–2032 (USD Million)
North America Market
Table 38: North America Construction Waste Management Market, 2023–2032 (USD Million)
Table 39: North America Construction Waste Management Market, by Service Type, 2023–2032 (USD Million)
Table 40: North America Construction Waste Management Market, by Waste Type, 2023–2032 (USD Million)
Table 41: North America Construction Waste Management Market, by Source, 2023–2032 (USD Million)
Table 44: North America Construction Waste Management Market, by Country, 2023–2032 (USD Million)
U.S. Market
Table 45: U.S. Construction Waste Management Market, 2023–2032 (USD Million)
Table 46: U.S. Construction Waste Management Market, by Service Type, 2023–2032 (USD Million)
Table 47: U.S. Construction Waste Management Market, by Waste Type, 2023–2032 (USD Million)
Table 48: U.S. Construction Waste Management Market, by Source, 2023–2032 (USD Million)
Canada Market
Table 49: Canada Construction Waste Management Market, 2023–2032 (USD Million)
Table 50: Canada Construction Waste Management Market, by Service Type, 2023–2032 (USD Million)
Table 51: Canada Construction Waste Management Market, by Waste Type, 2023–2032 (USD Million)
Table 52: Canada Construction Waste Management Market, by Source, 2023–2032 (USD Million)
Mexico Market
Table 53: Mexico Construction Waste Management Market, 2023–2032 (USD Million)
Table 54: Mexico Construction Waste Management Market, by Service Type, 2023–2032 (USD Million)
Table 55: Mexico Construction Waste Management Market, by Waste Type, 2023–2032 (USD Million)
Table 56: Mexico Construction Waste Management Market, by Source, 2023–2032 (USD Million)
Europe Market
Table 57: Europe Construction Waste Management Market, 2023–2032 (USD Million)
Table 58: Europe Construction Waste Management Market, by Service Type, 2023–2032 (USD Million)
Table 59: Europe Construction Waste Management Market, by Waste Type, 2023–2032 (USD Million)
Table 60: Europe Construction Waste Management Market, by Source, 2023–2032 (USD Million)
Table 61: Europe Construction Waste Management Market, by Country, 2023–2032 (USD Million)
Germany Market
Table 62: Germany Construction Waste Management Market, 2023–2032 (USD Million)
Table 63: Germany Construction Waste Management Market, by Service Type, 2023–2032 (USD Million)
Table 64: Germany Construction Waste Management Market, by Waste Type, 2023–2032 (USD Million)
Table 65: Germany Construction Waste Management Market, by Source, 2023–2032 (USD Million)
France Market
Table 66: France Construction Waste Management Market, 2023–2032 (USD Million)
Table 67: France Construction Waste Management Market, by Service Type, 2023–2032 (USD Million)
Table 68: France Construction Waste Management Market, by Waste Type, 2023–2032 (USD Million)
Table 69: France Construction Waste Management Market, by Source, 2023–2032 (USD Million)
U.K. Market
Table 70: U.K. Construction Waste Management Market, 2023–2032 (USD Million)
Table 71: U.K. Construction Waste Management Market, by Service Type, 2023–2032 (USD Million)
Table 72: U.K. Construction Waste Management Market, by Waste Type, 2023–2032 (USD Million)
Table 73: U.K. Construction Waste Management Market, by Source, 2023–2032 (USD Million)
Italy Market
Table 74: Italy Construction Waste Management Market, 2023–2032 (USD Million)
Table 75: Italy Construction Waste Management Market, by Service Type, 2023–2032 (USD Million)
Table 76: Italy Construction Waste Management Market, by Waste Type, 2023–2032 (USD Million)
Table 77: Italy Construction Waste Management Market, by Source, 2023–2032 (USD Million)
Spain Market
Table 78: Spain Construction Waste Management Market, 2023–2032 (USD Million)
Table 79: Spain Construction Waste Management Market, by Service Type, 2023–2032 (USD Million)
Table 80: Spain Construction Waste Management Market, by Waste Type, 2023–2032 (USD Million)
Table 81: Spain Construction Waste Management Market, by Source, 2023–2032 (USD Million)
Nordics Market
Table 82: Nordics Construction Waste Management Market, 2023–2032 (USD Million)
Table 83: Nordics Construction Waste Management Market, by Service Type, 2023–2032 (USD Million)
Table 84: Nordics Construction Waste Management Market, by Waste Type, 2023–2032 (USD Million)
Table 85: Nordics Construction Waste Management Market, by Source, 2023–2032 (USD Million)
Rest of Europe Market
Table 86: Rest of Europe Construction Waste Management Market, 2023–2032 (USD Million)
Table 87: Rest of Europe Construction Waste Management Market, by Service Type, 2023–2032 (USD Million)
Table 88: Rest of Europe Construction Waste Management Market, by Waste Type, 2023–2032 (USD Million)
Table 89: Rest of Europe Construction Waste Management Market, by Source, 2023–2032 (USD Million)
Asia-Pacific Market
Table 90: Asia-Pacific Construction Waste Management Market, 2023–2032 (USD Million)
Table 91: Asia-Pacific Construction Waste Management Market, by Service Type, 2023–2032 (USD Million)
Table 92: Asia-Pacific Construction Waste Management Market, by Waste Type, 2023–2032 (USD Million)
Table 93: Asia-Pacific Construction Waste Management Market, by Source, 2023–2032 (USD Million)
Table 94: Asia-Pacific Construction Waste Management Market, by Country, 2023–2032 (USD Million)
China Market
Table 95: China Construction Waste Management Market, 2023–2032 (USD Million)
Table 96: China Construction Waste Management Market, by Service Type, 2023–2032 (USD Million)
Table 97: China Construction Waste Management Market, by Waste Type, 2023–2032 (USD Million)
Table 98: China Construction Waste Management Market, by Source, 2023–2032 (USD Million)
Japan Market
Table 99: Japan Construction Waste Management Market, 2023–2032 (USD Million)
Table 100: Japan Construction Waste Management Market, by Service Type, 2023–2032 (USD Million)
Table 101: Japan Construction Waste Management Market, by Waste Type, 2023–2032 (USD Million)
Table 102: Japan Construction Waste Management Market, by Source, 2023–2032 (USD Million)
India Market
Table 103: India Construction Waste Management Market, 2023–2032 (USD Million)
Table 104: India Construction Waste Management Market, by Service Type, 2023–2032 (USD Million)
Table 105: India Construction Waste Management Market, by Waste Type, 2023–2032 (USD Million)
Table 106: India Construction Waste Management Market, by Source, 2023–2032 (USD Million)
Australia Market
Table 107: Australia Construction Waste Management Market, 2023–2032 (USD Million)
Table 108: Australia Construction Waste Management Market, by Service Type, 2023–2032 (USD Million)
Table 109: Australia Construction Waste Management Market, by Waste Type, 2023–2032 (USD Million)
Table 110: Australia Construction Waste Management Market, by Source, 2023–2032 (USD Million)
South Korea Market
Table 111: South Korea Construction Waste Management Market, 2023–2032 (USD Million)
Table 112: South Korea Construction Waste Management Market, by Service Type, 2023–2032 (USD Million)
Table 113: South Korea Construction Waste Management Market, by Waste Type, 2023–2032 (USD Million)
Table 114: South Korea Construction Waste Management Market, by Source, 2023–2032 (USD Million)
Rest of Asia-Pacific Market
Table 115: Rest of Asia-Pacific Construction Waste Management Market, 2023–2032 (USD Million)
Table 116: Rest of Asia-Pacific Construction Waste Management Market, by Service Type, 2023–2032 (USD Million)
Table 117: Rest of Asia-Pacific Construction Waste Management Market, by Waste Type, 2023–2032 (USD Million)
Table 118: Rest of Asia-Pacific Construction Waste Management Market, by Source, 2023–2032 (USD Million)
Latin America Market
Table 119: Latin America Construction Waste Management Market, 2023–2032 (USD Million)
Table 120: Latin America Construction Waste Management Market, by Service Type, 2023–2032 (USD Million)
Table 121: Latin America Construction Waste Management Market, by Waste Type, 2023–2032 (USD Million)
Table 122: Latin America Construction Waste Management Market, by Source, 2023–2032 (USD Million)
Table 123: Latin America Construction Waste Management Market, by Country, 2023–2032 (USD Million)
Brazil Market
Table 124: Brazil Construction Waste Management Market, 2023–2032 (USD Million)
Table 125: Brazil Construction Waste Management Market, by Service Type, 2023–2032 (USD Million)
Table 126: Brazil Construction Waste Management Market, by Waste Type, 2023–2032 (USD Million)
Table 127: Brazil Construction Waste Management Market, by Source, 2023–2032 (USD Million)
Argentina Market
Table 128: Argentina Construction Waste Management Market, 2023–2032 (USD Million)
Table 129: Argentina Construction Waste Management Market, by Service Type, 2023–2032 (USD Million)
Table 130: Argentina Construction Waste Management Market, by Waste Type, 2023–2032 (USD Million)
Table 131: Argentina Construction Waste Management Market, by Source, 2023–2032 (USD Million)
Rest of Latin America Market
Table 132: Rest of Latin America Construction Waste Management Market, 2023–2032 (USD Million)
Table 133: Rest of Latin America Construction Waste Management Market, by Service Type, 2023–2032 (USD Million)
Table 134: Rest of Latin America Construction Waste Management Market, by Waste Type, 2023–2032 (USD Million)
Table 135: Rest of Latin America Construction Waste Management Market, by Source, 2023–2032 (USD Million)
Middle East & Africa Market
Table 136: Middle East & Africa Construction Waste Management Market, 2023–2032 (USD Million)
Table 137: Middle East & Africa Construction Waste Management Market, by Service Type, 2023–2032 (USD Million)
Table 138: Middle East & Africa Construction Waste Management Market, by Waste Type, 2023–2032 (USD Million)
Table 139: Middle East & Africa Construction Waste Management Market, by Source, 2023–2032 (USD Million)
Table 140: Middle East & Africa Construction Waste Management Market, by Country, 2023–2032 (USD Million)
UAE Market
Table 141: UAE Construction Waste Management Market, 2023–2032 (USD Million)
Table 142: UAE Construction Waste Management Market, by Service Type, 2023–2032 (USD Million)
Table 143: UAE Construction Waste Management Market, by Waste Type, 2023–2032 (USD Million)
Table 144: UAE Construction Waste Management Market, by Source, 2023–2032 (USD Million)
Saudi Arabia Market
Table 145: Saudi Arabia Construction Waste Management Market, 2023–2032 (USD Million)
Table 146: Saudi Arabia Construction Waste Management Market, by Service Type, 2023–2032 (USD Million)
Table 147: Saudi Arabia Construction Waste Management Market, by Waste Type, 2023–2032 (USD Million)
Table 148: Saudi Arabia Construction Waste Management Market, by Source, 2023–2032 (USD Million)
South Africa Market
Table 149: South Africa Construction Waste Management Market, 2023–2032 (USD Million)
Table 150: South Africa Construction Waste Management Market, by Service Type, 2023–2032 (USD Million)
Table 151: South Africa Construction Waste Management Market, by Waste Type, 2023–2032 (USD Million)
Table 152: South Africa Construction Waste Management Market, by Source, 2023–2032 (USD Million)
Rest of Middle East & Africa Market
Table 153: Rest of Middle East & Africa Construction Waste Management Market, 2023–2032 (USD Million)
Table 154: Rest of Middle East & Africa Construction Waste Management Market, by Service Type, 2023–2032 (USD Million)
Table 155: Rest of Middle East & Africa Construction Waste Management Market, by Waste Type, 2023–2032 (USD Million)
Table 156: Rest of Middle East & Africa Construction Waste Management Market, by Source, 2023–2032 (USD Million)
LIST OF FIGURES
Figure 1: Global Construction Waste Management Market Size, 2023–2032 (USD Million)
Figure 2: Global Construction Waste Management Market Growth, Y-o-Y % Growth, 2025-2032
Figure 3: Global Construction Waste Management Market, by Service Type, 2025 vs. 2032 (%)
Figure 4: Global Construction Waste Management Market, by Waste Type, 2025 vs. 2032 (%)
Figure 5: Global Construction Waste Management Market, by Source, 2025 vs. 2032 (%)
Figure 6: Global Construction Waste Management Market, by Region/Country, 2025 vs. 2032 (%)
Figure 7: Impact Assessment of Market Drivers on Global Construction Waste Management Market (2025-2032)
Figure 8: Impact Assessment of Market Restraints on Global Construction Waste Management Market (2025-2032)
Figure 9: Impact Assessment of Market Opportunities on Global Construction Waste Management Market (2025-2032)
Figure 10: Porter's Five Forces Analysis: Global Construction Waste Management Market
Figure 11: Construction Waste Generation by Region, 2024
Figure 12: Key Regulatory Frameworks for Construction Waste Management by Region
Figure 13: Construction Industry Sustainability Metrics and Waste Reduction Targets, 2022-2025
Figure 14: Circular Economy Framework for Construction Waste
Figure 15: Construction Waste Recovery and Recycling Rates by Material Type
Figure 16: North America Construction Waste Management Market Snapshot, 2025-2032 (USD Million)
Figure 17: North America Construction Waste Management Market Share, by Country, 2025 vs. 2032 (%)
Figure 18: Europe Construction Waste Management Market Snapshot, 2025-2032 (USD Million)
Figure 19: Europe Construction Waste Management Market Share, by Country, 2025 vs. 2032 (%)
Figure 20: Asia-Pacific Construction Waste Management Market Snapshot, 2025-2032 (USD Million)
Figure 21: Asia-Pacific Construction Waste Management Market Share, by Country, 2025 vs. 2032 (%)
Figure 22: Latin America Construction Waste Management Market Snapshot, 2025-2032 (USD Million)
Figure 23: Latin America Construction Waste Management Market Share, by Country, 2025 vs. 2032 (%)
Figure 24: Middle East & Africa Construction Waste Management Market Snapshot, 2025-2032 (USD Million)
Figure 25: Middle East & Africa Construction Waste Management Market Share, by Country, 2025 vs. 2032 (%)
Figure 26: Waste Generation by Construction Project Type, 2023
Figure 27: Recycling Rates by Construction Material Type, 2023
Figure 28: Key Growth Strategies Adopted by Leading Players in the Global Construction Waste Management Market, 2021-2025
Figure 29: Global Construction Waste Management Market Share Analysis, by Key Player (2024)
Figure 30: Competitive Benchmarking of Key Players in the Global Construction Waste Management Market
Figure 31: Competitive Dashboard of the Global Construction Waste Management Market


Published Date: Jun-2026
Published Date: May-2026
Published Date: May-2026
Published Date: May-2026
Published Date: Apr-2026
Subscribe to get the latest industry updates