Resources
About Us
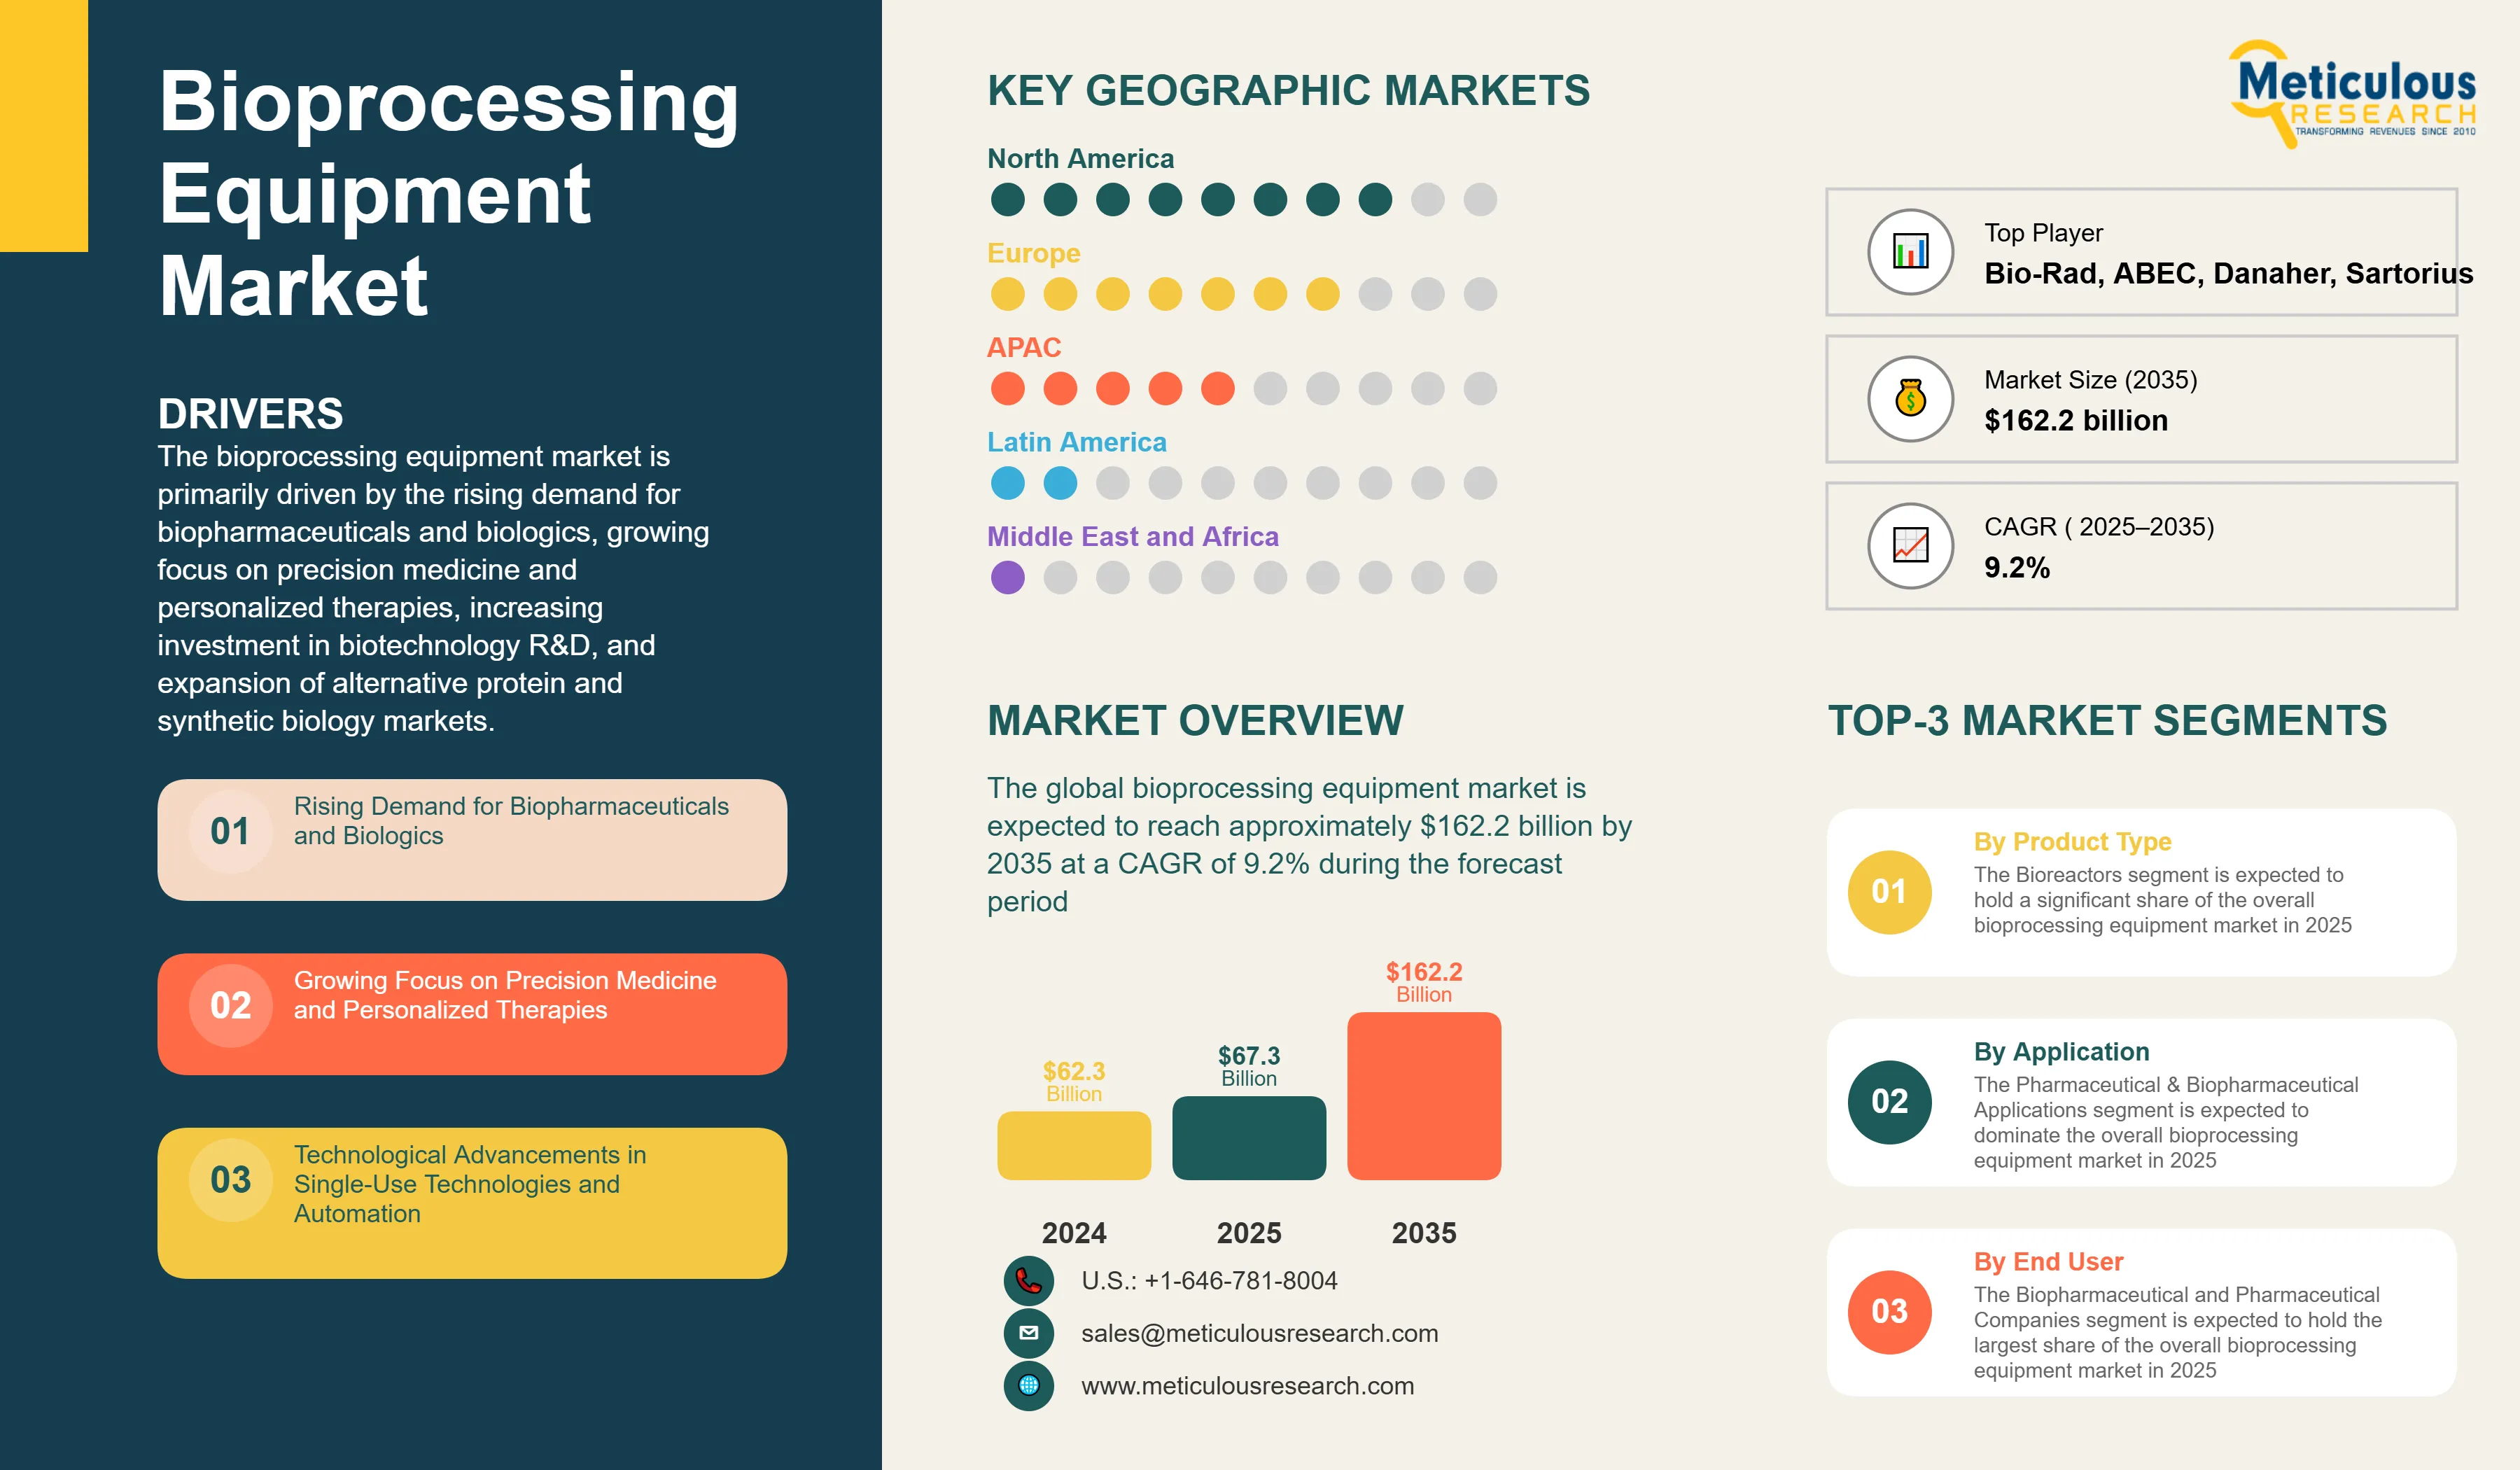
The global bioprocessing equipment market was valued at $62.3 billion in 2024. This market is expected to reach approximately $162.2 billion by 2035, growing from an estimated $67.3 billion in 2025, at a CAGR of 9.2% during the forecast period of 2025–2035.
Report Overview
This report analyzes the global bioprocessing equipment market, highlighting how bioprocessing equipment providers are addressing the growing demand for biopharmaceuticals and biologics, precision medicine and personalized therapies, as well as the surge in biotechnology R&D investments across emerging markets. It provides a strategic assessment of market dynamics, forecasts through 2035, and evaluates the competitive landscape at global, regional, and country levels.
Key Market Drivers & Trends and Insights
Click here to: Get Free Sample Pages of this Report
The bioprocessing equipment market is primarily driven by the rising demand for biopharmaceuticals and biologics, growing focus on precision medicine and personalized therapies, increasing investment in biotechnology R&D, and expansion of alternative protein and synthetic biology markets. The shift towards continuous bioprocessing and perfusion systems, single-use and disposable technologies are reshaping the industry, while modular and flexible manufacturing platforms and AI and machine learning integration technologies are gaining significant traction. Additionally, integration with Industry 4.0 and digital technologies and technological advancements in automation are further driving market growth, especially in developed markets with advanced biotechnology infrastructure.
Key Challenges
Although the bioprocessing equipment market holds substantial growth potential, it encounters several challenges such as high capital investment and operational costs, complex regulatory approval processes, and technical challenges in scale-up and process optimization. Furthermore, hurdles like regulatory compliance across different regions, quality standards and validation requirements, and supply chain disruptions and material shortages pose significant barriers that could hinder market adoption in different parts of the world.
Growth Opportunities
The bioprocessing equipment market presents numerous avenues for high growth. Emerging markets offer substantial expansion opportunities for market players looking to reach new customer bases. Integration with Industry 4.0 and digital technologies provides another key opportunity, enhancing the accessibility of advanced bioprocessing control systems. Moreover, the growing demand for contract manufacturing services and environmental applications and sustainable manufacturing are generating new revenue streams for solution providers as organizations seek efficient alternatives to traditional manufacturing methods.
Market Segmentation Highlights
By Product Type
The Bioreactors segment is expected to hold a significant share of the overall bioprocessing equipment market in 2025, due to their critical role in cell culture and fermentation processes across pharmaceutical and biotechnology applications. The segment includes stirred-tank bioreactors, single-use bioreactors, wave/rocking bioreactors, air-lift bioreactors, and perfusion bioreactors. However, the Filtration Systems segment continues to maintain strong market presence, driven by increasing demand for downstream processing and purification technologies.
By Application
The Pharmaceutical & Biopharmaceutical Applications segment is expected to dominate the overall bioprocessing equipment market in 2025, primarily due to the increasing development of monoclonal antibodies, vaccines, cell and gene therapy, and recombinant proteins. However, the Food & Beverage Applications segment is expected to grow significantly during the forecast period, driven by the growing focus on alternative proteins, probiotics, and fermented products.
By End User
The Biopharmaceutical and Pharmaceutical Companies segment is expected to hold the largest share of the overall bioprocessing equipment market in 2025, due to the growing pipeline of biologics and increasing manufacturing capacity investments. However, the Contract Development and Manufacturing Organizations (CDMOs/CMOs) segment is expected to experience notable growth during the forecast period, driven by the increasing outsourcing trend in pharmaceutical manufacturing.
By Geography
North America is expected to hold the largest share of the global bioprocessing equipment market in 2025, driven by advanced biotechnology infrastructure, strong focus on biopharmaceutical development, well-established pharmaceutical industry, and favorable regulatory environment for biologics. Additionally, high R&D investments and mature market infrastructure contribute significantly to market dominance. Europe follows as a significant market, bolstered by growing biotechnology sector and increasing adoption of advanced bioprocessing technologies. However, Asia-Pacific is witnessing the fastest growth rate during the forecast period, primarily driven by expanding pharmaceutical manufacturing, growing biotechnology investments, increasing healthcare expenditure, and rising demand for biologics.
Competitive Landscape
The global bioprocessing equipment market is characterized by a diverse competitive environment, comprising established biotechnology equipment manufacturers, pharmaceutical technology providers, automation solution providers, and innovative technology companies, each adopting unique approaches to advancing bioprocessing technologies.
Within this landscape, equipment providers are segmented into industry leaders, market differentiators, vanguards, and contemporary stalwarts, with each group implementing distinct strategies to sustain their competitive edge. Leading companies are prioritizing integrated solutions that merge cutting-edge bioprocessing technologies with comprehensive manufacturing automation systems, while also addressing scalability and regulatory compliance challenges specific to various regions.
The key players operating in the global bioprocessing equipment market are Thermo Fisher Scientific Inc., Sartorius AG, Danaher Corporation, Merck KGaA, Eppendorf SE, Getinge AB, Applikon Biotechnology B.V., ABEC, Inc., Solaris Biotech Solutions S.r.l., Pierre Guerin Technologies, Bioengineering AG, Infors HT, CerCell ApS, Pall Corporation (Cytiva - GE Healthcare), and Bio-Rad Laboratories, Inc. among others.
Bioprocessing Equipment Market Report Summary
|
Particulars |
Details |
|
Number of Pages |
285 |
|
Format |
PDF & Excel |
|
Forecast Period |
2025–2035 |
|
Base Year |
2024 |
|
CAGR (Value) |
9.2% |
|
Market Size (Value) in 2025 |
USD 67.3 Billion |
|
Market Size (Value) in 2035 |
USD 162.2 Billion |
|
Segments Covered |
Market Assessment, by Product Type
Market Assessment, by Application
Market Assessment, by End User
|
|
Countries Covered |
North America (U.S., Canada), Europe (Germany, U.K., France, Switzerland, Denmark, Rest of Europe), Asia-Pacific (China, Japan, India, South Korea, Singapore, Rest of Asia-Pacific), Latin America (Brazil, Mexico, Rest of Latin America), Middle East & Africa (UAE, Saudi Arabia, South Africa, Rest of MEA) |
|
Key Companies |
Thermo Fisher Scientific Inc., Sartorius AG, Danaher Corporation, Merck KGaA, Eppendorf SE, Getinge AB, Applikon Biotechnology B.V., ABEC, Inc., Solaris Biotech Solutions S.r.l., Pierre Guerin Technologies, Bioengineering AG, Infors HT, CerCell ApS, Pall Corporation (Cytiva - GE Healthcare), Bio-Rad Laboratories, Inc. |
Key Questions Answered in the Report:
The global bioprocessing equipment market was valued at $62.3 billion in 2024. This market is expected to reach approximately $162.2 billion by 2035, growing from an estimated $67.3 billion in 2025, at a CAGR of 9.2% during the forecast period of 2025–2035.
The global bioprocessing equipment market is expected to grow at a CAGR of 9.2% during the forecast period of 2025–2035.
The global bioprocessing equipment market is expected to reach approximately $162.2 billion by 2035, growing from an estimated $67.5 billion in 2025, at a CAGR of 9.2% during the forecast period of 2025–2035.
The key companies operating in this market include Thermo Fisher Scientific Inc., Sartorius AG, Danaher Corporation, Merck KGaA, Eppendorf SE, Getinge AB, Applikon Biotechnology B.V., ABEC, Inc., Solaris Biotech Solutions S.r.l., Pierre Guerin Technologies, and others.
Major trends shaping the market include continuous bioprocessing and perfusion systems, single-use and disposable technologies, modular and flexible manufacturing platforms, and AI and machine learning integration.
Which Segments Will Hold Large Market Shares in the Bioprocessing Equipment Market during 2025-2035?
• In 2025, the Bioreactors segment is expected to hold a significant share of the overall bioprocessing equipment market by product type
• Based on application, the Pharmaceutical & Biopharmaceutical Applications segment is expected to hold the largest share of the overall market in 2025
• Based on end user, the Biopharmaceutical and Pharmaceutical Companies segment is expected to hold the largest share of the overall market in 2025
North America is expected to hold the largest share of the global bioprocessing equipment market in 2025, driven by advanced biotechnology infrastructure, strong focus on biopharmaceutical development, and favorable regulatory environment for biologics. Asia-Pacific is witnessing the fastest growth rate during the forecast period.
The growth of this market is driven by rising demand for biopharmaceuticals and biologics, growing focus on precision medicine and personalized therapies, increasing investment in biotechnology R&D, and expansion of alternative protein and synthetic biology markets.
1. Market Definition & Scope
1.1. Market Definition
1.2. Market Ecosystem
1.3. Currency
1.4. Key Stakeholders
2. Research Methodology
2.1. Research Approach
2.2. Process of Data Collection and Validation
2.2.1. Secondary Research
2.2.2. Primary Research/Interviews with Key Opinion Leaders
2.3. Market Sizing and Forecast
2.3.1. Market Size Estimation Approach
2.3.1.1. Bottom-up Approach
2.3.1.2. Top-down Approach
2.3.2. Growth Forecast Approach
2.3.3. Assumptions for the Study
3. Executive Summary
3.1. Overview
3.2. Segmental Analysis
3.2.1. Bioprocessing Equipment Market, by Product Type
3.2.2. Bioprocessing Equipment Market, by Application
3.2.3. Bioprocessing Equipment Market, by End User
3.2.4. Bioprocessing Equipment Market, by Geography
3.3. Competitive Landscape
4. Market Insights
4.1. Overview
4.2. Factors Affecting Market Growth
4.2.1. Drivers
4.2.1.1. Rising Demand for Biopharmaceuticals and Biologics
4.2.1.2. Growing Focus on Precision Medicine and Personalized Therapies
4.2.1.3. Increasing Investment in Biotechnology R&D
4.2.1.4. Expansion of Alternative Protein and Synthetic Biology Markets
4.2.1.5. Technological Advancements in Single-Use Technologies and Automation
4.2.2. Restraints
4.2.2.1. High Capital Investment and Operational Costs
4.2.2.2. Complex Regulatory Approval Processes
4.2.2.3. Technical Challenges in Scale-up and Process Optimization
4.2.2.4. Shortage of Skilled Workforce
4.2.3. Opportunities
4.2.3.1. Expansion in Emerging Markets
4.2.3.2. Integration with Industry 4.0 and Digital Technologies
4.2.3.3. Growing Demand for Contract Manufacturing Services
4.2.3.4. Environmental Applications and Sustainable Manufacturing
4.2.4. Trends
4.2.4.1. Continuous Bioprocessing and Perfusion Systems
4.2.4.2. Single-Use and Disposable Technologies
4.2.4.3. Modular and Flexible Manufacturing Platforms
4.2.4.4. AI and Machine Learning Integration
4.2.5. Challenges
4.2.5.1. Regulatory Compliance Across Different Regions
4.2.5.2. Quality Standards and Validation Requirements
4.2.5.3. Supply Chain Disruptions and Material Shortages
4.3. Porter's Five Forces Analysis
4.3.1. Bargaining Power of Suppliers
4.3.2. Bargaining Power of Buyers
4.3.3. Threat of Substitutes
4.3.4. Threat of New Entrants
4.3.5. Degree of Competition
4.4. Sustainability Impact on the Bioprocessing Equipment Market
4.4.1. Environmental Sustainability Factors
4.4.1.1. Energy Efficiency and Carbon Footprint Reduction
4.4.1.2. Sustainable Manufacturing Practices
4.4.2. Market Response to Sustainability Demands
4.4.2.1. Regulatory Compliance and Green Manufacturing Standards
4.4.2.2. Manufacturer-led Sustainability Initiatives
4.4.3. Opportunities from Sustainability Focus
4.4.3.1. Eco-friendly Equipment Development
4.4.3.2. Challenges in Sustainable Bioprocessing
5. Bioprocessing Equipment Market Assessment—By Product Type
5.1. Overview
5.2. Bioreactors
5.2.1. Stirred-Tank Bioreactors
5.2.2. Single-Use Bioreactors
5.2.3. Wave/Rocking Bioreactors
5.2.4. Air-Lift Bioreactors
5.2.5. Perfusion Bioreactors
5.3. Fermenters
5.3.1. Laboratory-Scale Fermenters
5.3.2. Pilot-Scale Fermenters
5.3.3. Production-Scale Fermenters
5.4. Filtration Systems
5.4.1. Tangential Flow Filtration (TFF)
5.4.2. Depth Filtration
5.4.3. Microfiltration Systems
5.4.4. Ultrafiltration Systems
5.4.5. Nanofiltration Systems
5.5. Control & Monitoring Systems
5.5.1. Process Control Systems
5.5.2. SCADA Systems
5.5.3. Sensors and Analyzers
5.5.4. Data Acquisition Systems
5.6. Support Equipment
5.6.1. Cleaning-in-Place (CIP) Systems
5.6.2. Sterilization-in-Place (SIP) Systems
5.6.3. Agitators and Mixing Systems
5.6.4. Pumps and Valves
6. Bioprocessing Equipment Market Assessment—By Application
6.1. Overview
6.2. Pharmaceutical & Biopharmaceutical Applications
6.2.1. Monoclonal Antibodies (mAbs)
6.2.2. Vaccines
6.2.3. Cell and Gene Therapy
6.2.4. Recombinant Proteins
6.2.5. Antibiotics and Enzymes
6.2.6. Other Biopharmaceutical Products
6.3. Food & Beverage Applications
6.3.1. Alternative Proteins (Precision Fermentation, Cultivated Meat)
6.3.2. Probiotics and Functional Foods
6.3.3. Enzymes and Food Additives
6.3.4. Fermented Beverages
6.4. Agricultural Applications
6.4.1. Biopesticides and Biofertilizers
6.4.2. Plant Cell Culture
6.4.3. Microbial Soil Enhancers
6.5. Industrial Biotechnology
6.5.1. Bio-based Chemicals
6.5.2. Biopolymers and Bioplastics
6.5.3. Biofuels and Renewable Energy
6.5.4. Industrial Enzymes
6.6. Environmental Applications
6.6.1. Wastewater Treatment
6.6.2. Biogas Production
6.6.3. Bioremediation
6.7. Research & Development Applications
7. Bioprocessing Equipment Market Assessment—By End User
7.1. Overview
7.2. Biopharmaceutical and Pharmaceutical Companies
7.3. Food & Beverage Manufacturers
7.4. Agricultural Input Companies
7.5. Chemical and Bio-based Product Manufacturers
7.6. Contract Development and Manufacturing Organizations (CDMOs/CMOs)
7.7. Academic & Research Institutions
7.8. Biotechnology and Synthetic Biology Companies
8. Bioprocessing Equipment Market Assessment—By Geography
8.1. Overview
8.2. North America
8.2.1. U.S.
8.2.2. Canada
8.3. Europe
8.3.1. Germany
8.3.2. U.K.
8.3.3. France
8.3.4. Switzerland
8.3.5. Denmark
8.3.6. Rest of Europe
8.4. Asia-Pacific
8.4.1. China
8.4.2. Japan
8.4.3. India
8.4.4. South Korea
8.4.5. Singapore
8.4.6. Rest of Asia-Pacific
8.5. Latin America
8.5.1. Brazil
8.5.2. Mexico
8.5.3. Rest of Latin America
8.6. Middle East & Africa
8.6.1. UAE
8.6.2. Saudi Arabia
8.6.3. South Africa
8.6.4. Rest of MEA
9. Competitive Landscape
9.1. Overview
9.2. Key Growth Strategies
9.3. Competitive Benchmarking
9.4. Competitive Dashboard
9.4.1. Industry Leaders
9.4.2. Market Differentiators
9.4.3. Vanguards
9.4.4. Contemporary Stalwarts
9.5. Market Share Analysis, by Key Players, 2024
10. Company Profiles (Business Overview, Financial Overview, Product Portfolio, Strategic Developments, and SWOT Analysis)
10.1. Thermo Fisher Scientific Inc. (USA)
10.2. Sartorius AG (Germany)
10.3. Danaher Corporation (USA)
10.4. Merck KGaA (Germany)
10.5. Eppendorf SE (Germany)
10.6. Getinge AB (Sweden)
10.7. Applikon Biotechnology B.V. (Netherlands)
10.8. ABEC, Inc. (USA)
10.9. Solaris Biotech Solutions S.r.l. (Italy)
10.10. Pierre Guerin Technologies (France)
10.11. Bioengineering AG (Switzerland)
10.12. Infors HT (Switzerland)
10.13. CerCell ApS (Denmark)
10.14. Pall Corporation (Cytiva - GE Healthcare) (USA)
10.15. Bio-Rad Laboratories, Inc. (USA)
11. Appendix
11.1. Available Customization
11.2. Related Reports
LIST OF TABLES
Table 1. Global Bioprocessing Equipment Market, by Product Type, 2023–2035 (USD Million)
Table 2. Global Bioreactors Market, by Country/Region, 2023–2035 (USD Million)
Table 3. Global Stirred-Tank Bioreactors Market, by Country/Region, 2023–2035 (USD Million)
Table 4. Global Single-Use Bioreactors Market, by Country/Region, 2023–2035 (USD Million)
Table 5. Global Wave/Rocking Bioreactors Market, by Country/Region, 2023–2035 (USD Million)
Table 6. Global Air-Lift Bioreactors Market, by Country/Region, 2023–2035 (USD Million)
Table 7. Global Perfusion Bioreactors Market, by Country/Region, 2023–2035 (USD Million)
Table 8. Global Fermenters Market, by Country/Region, 2023–2035 (USD Million)
Table 9. Global Laboratory-Scale Fermenters Market, by Country/Region, 2023–2035 (USD Million)
Table 10. Global Pilot-Scale Fermenters Market, by Country/Region, 2023–2035 (USD Million)
Table 11. Global Production-Scale Fermenters Market, by Country/Region, 2023–2035 (USD Million)
Table 12. Global Filtration Systems Market, by Country/Region, 2023–2035 (USD Million)
Table 13. Global Tangential Flow Filtration (TFF) Market, by Country/Region, 2023–2035 (USD Million)
Table 14. Global Depth Filtration Market, by Country/Region, 2023–2035 (USD Million)
Table 15. Global Microfiltration Systems Market, by Country/Region, 2023–2035 (USD Million)
Table 16. Global Ultrafiltration Systems Market, by Country/Region, 2023–2035 (USD Million)
Table 17. Global Nanofiltration Systems Market, by Country/Region, 2023–2035 (USD Million)
Table 18. Global Control & Monitoring Systems Market, by Country/Region, 2023–2035 (USD Million)
Table 19. Global Process Control Systems Market, by Country/Region, 2023–2035 (USD Million)
Table 20. Global SCADA Systems Market, by Country/Region, 2023–2035 (USD Million)
Table 21. Global Sensors and Analyzers Market, by Country/Region, 2023–2035 (USD Million)
Table 22. Global Data Acquisition Systems Market, by Country/Region, 2023–2035 (USD Million)
Table 23. Global Support Equipment Market, by Country/Region, 2023–2035 (USD Million)
Table 24. Global Cleaning-in-Place (CIP) Systems Market, by Country/Region, 2023–2035 (USD Million)
Table 25. Global Sterilization-in-Place (SIP) Systems Market, by Country/Region, 2023–2035 (USD Million)
Table 26. Global Agitators and Mixing Systems Market, by Country/Region, 2023–2035 (USD Million)
Table 27. Global Pumps and Valves Market, by Country/Region, 2023–2035 (USD Million)
Table 28. Global Bioprocessing Equipment Market, by Application, 2023–2035 (USD Million)
Table 29. Global Bioprocessing Equipment Market for Pharmaceutical & Biopharmaceutical Applications, by Country/Region, 2023–2035 (USD Million)
Table 30. Global Monoclonal Antibodies (mAbs) Market, by Country/Region, 2023–2035 (USD Million)
Table 31. Global Vaccines Market, by Country/Region, 2023–2035 (USD Million)
Table 32. Global Cell and Gene Therapy Market, by Country/Region, 2023–2035 (USD Million)
Table 33. Global Recombinant Proteins Market, by Country/Region, 2023–2035 (USD Million)
Table 34. Global Antibiotics and Enzymes Market, by Country/Region, 2023–2035 (USD Million)
Table 35. Global Other Biopharmaceutical Products Market, by Country/Region, 2023–2035 (USD Million)
Table 36. Global Bioprocessing Equipment Market for Food & Beverage Applications, by Country/Region, 2023–2035 (USD Million)
Table 37. Global Alternative Proteins Market, by Country/Region, 2023–2035 (USD Million)
Table 38. Global Probiotics and Functional Foods Market, by Country/Region, 2023–2035 (USD Million)
Table 39. Global Enzymes and Food Additives Market, by Country/Region, 2023–2035 (USD Million)
Table 40. Global Fermented Beverages Market, by Country/Region, 2023–2035 (USD Million)
Table 41. Global Bioprocessing Equipment Market for Agricultural Applications, by Country/Region, 2023–2035 (USD Million)
Table 42. Global Biopesticides and Biofertilizers Market, by Country/Region, 2023–2035 (USD Million)
Table 43. Global Plant Cell Culture Market, by Country/Region, 2023–2035 (USD Million)
Table 44. Global Microbial Soil Enhancers Market, by Country/Region, 2023–2035 (USD Million)
Table 45. Global Bioprocessing Equipment Market for Industrial Biotechnology, by Country/Region, 2023–2035 (USD Million)
Table 46. Global Bio-based Chemicals Market, by Country/Region, 2023–2035 (USD Million)
Table 47. Global Biopolymers and Bioplastics Market, by Country/Region, 2023–2035 (USD Million)
Table 48. Global Biofuels and Renewable Energy Market, by Country/Region, 2023–2035 (USD Million)
Table 49. Global Industrial Enzymes Market, by Country/Region, 2023–2035 (USD Million)
Table 50. Global Bioprocessing Equipment Market for Environmental Applications, by Country/Region, 2023–2035 (USD Million)
Table 51. Global Wastewater Treatment Market, by Country/Region, 2023–2035 (USD Million)
Table 52. Global Biogas Production Market, by Country/Region, 2023–2035 (USD Million)
Table 53. Global Bioremediation Market, by Country/Region, 2023–2035 (USD Million)
Table 54. Global Bioprocessing Equipment Market for Research & Development Applications, by Country/Region, 2023–2035 (USD Million)
Table 55. Global Bioprocessing Equipment Market, by End User, 2023–2035 (USD Million)
Table 56. Global Bioprocessing Equipment Market for Biopharmaceutical and Pharmaceutical Companies, by Country/Region, 2023–2035 (USD Million)
Table 57. Global Bioprocessing Equipment Market for Food & Beverage Manufacturers, by Country/Region, 2023–2035 (USD Million)
Table 58. Global Bioprocessing Equipment Market for Agricultural Input Companies, by Country/Region, 2023–2035 (USD Million)
Table 59. Global Bioprocessing Equipment Market for Chemical and Bio-based Product Manufacturers, by Country/Region, 2023–2035 (USD Million)
Table 60. Global Bioprocessing Equipment Market for CDMOs/CMOs, by Country/Region, 2023–2035 (USD Million)
Table 61. Global Bioprocessing Equipment Market for Academic & Research Institutions, by Country/Region, 2023–2035 (USD Million)
Table 62. Global Bioprocessing Equipment Market for Biotechnology and Synthetic Biology Companies, by Country/Region, 2023–2035 (USD Million)
Table 63. North America: Bioprocessing Equipment Market, by Product Type, 2023–2035 (USD Million)
Table 64. North America: Bioreactors Market, by Type, 2023–2035 (USD Million)
Table 65. North America: Fermenters Market, by Type, 2023–2035 (USD Million)
Table 66. North America: Filtration Systems Market, by Type, 2023–2035 (USD Million)
Table 67. North America: Control & Monitoring Systems Market, by Type, 2023–2035 (USD Million)
Table 68. North America: Support Equipment Market, by Type, 2023–2035 (USD Million)
Table 69. North America: Bioprocessing Equipment Market, by Application, 2023–2035 (USD Million)
Table 70. North America: Pharmaceutical & Biopharmaceutical Applications Market, by Type, 2023–2035 (USD Million)
Table 71. North America: Food & Beverage Applications Market, by Type, 2023–2035 (USD Million)
Table 72. North America: Agricultural Applications Market, by Type, 2023–2035 (USD Million)
Table 73. North America: Industrial Biotechnology Market, by Type, 2023–2035 (USD Million)
Table 74. North America: Environmental Applications Market, by Type, 2023–2035 (USD Million)
Table 75. North America: Bioprocessing Equipment Market, by End User, 2023–2035 (USD Million)
Table 76. U.S.: Bioprocessing Equipment Market, by Product Type, 2023–2035 (USD Million)
Table 77. U.S.: Bioreactors Market, by Type, 2023–2035 (USD Million)
Table 78. U.S.: Fermenters Market, by Type, 2023–2035 (USD Million)
Table 79. U.S.: Filtration Systems Market, by Type, 2023–2035 (USD Million)
Table 80. U.S.: Control & Monitoring Systems Market, by Type, 2023–2035 (USD Million)
Table 81. U.S.: Support Equipment Market, by Type, 2023–2035 (USD Million)
Table 82. U.S.: Bioprocessing Equipment Market, by Application, 2023–2035 (USD Million)
Table 83. U.S.: Pharmaceutical & Biopharmaceutical Applications Market, by Type, 2023–2035 (USD Million)
Table 84. U.S.: Food & Beverage Applications Market, by Type, 2023–2035 (USD Million)
Table 85. U.S.: Agricultural Applications Market, by Type, 2023–2035 (USD Million)
Table 86. U.S.: Industrial Biotechnology Market, by Type, 2023–2035 (USD Million)
Table 87. U.S.: Environmental Applications Market, by Type, 2023–2035 (USD Million)
Table 88. U.S.: Bioprocessing Equipment Market, by End User, 2023–2035 (USD Million)
Table 89. Canada: Bioprocessing Equipment Market, by Product Type, 2023–2035 (USD Million)
Table 90. Canada: Bioreactors Market, by Type, 2023–2035 (USD Million)
Table 91. Canada: Fermenters Market, by Type, 2023–2035 (USD Million)
Table 92. Canada: Filtration Systems Market, by Type, 2023–2035 (USD Million)
Table 93. Canada: Control & Monitoring Systems Market, by Type, 2023–2035 (USD Million)
Table 94. Canada: Support Equipment Market, by Type, 2023–2035 (USD Million)
Table 95. Canada: Bioprocessing Equipment Market, by Application, 2023–2035 (USD Million)
Table 96. Canada: Pharmaceutical & Biopharmaceutical Applications Market, by Type, 2023–2035 (USD Million)
Table 97. Canada: Food & Beverage Applications Market, by Type, 2023–2035 (USD Million)
Table 98. Canada: Agricultural Applications Market, by Type, 2023–2035 (USD Million)
Table 99. Canada: Industrial Biotechnology Market, by Type, 2023–2035 (USD Million)
Table 100. Canada: Environmental Applications Market, by Type, 2023–2035 (USD Million)
Table 101. Canada: Bioprocessing Equipment Market, by End User, 2023–2035 (USD Million)
Table 102. Europe: Bioprocessing Equipment Market, by Product Type, 2023–2035 (USD Million)
Table 103. Europe: Bioreactors Market, by Type, 2023–2035 (USD Million)
Table 104. Europe: Fermenters Market, by Type, 2023–2035 (USD Million)
Table 105. Europe: Filtration Systems Market, by Type, 2023–2035 (USD Million)
Table 106. Europe: Control & Monitoring Systems Market, by Type, 2023–2035 (USD Million)
Table 107. Europe: Support Equipment Market, by Type, 2023–2035 (USD Million)
Table 108. Europe: Bioprocessing Equipment Market, by Application, 2023–2035 (USD Million)
Table 109. Europe: Pharmaceutical & Biopharmaceutical Applications Market, by Type, 2023–2035 (USD Million)
Table 110. Europe: Food & Beverage Applications Market, by Type, 2023–2035 (USD Million)
Table 111. Europe: Agricultural Applications Market, by Type, 2023–2035 (USD Million)
Table 112. Europe: Industrial Biotechnology Market, by Type, 2023–2035 (USD Million)
Table 113. Europe: Environmental Applications Market, by Type, 2023–2035 (USD Million)
Table 114. Europe: Bioprocessing Equipment Market, by End User, 2023–2035 (USD Million)
Table 115. Germany: Bioprocessing Equipment Market, by Product Type, 2023–2035 (USD Million)
Table 116. Germany: Bioreactors Market, by Type, 2023–2035 (USD Million)
Table 117. Germany: Fermenters Market, by Type, 2023–2035 (USD Million)
Table 118. Germany: Filtration Systems Market, by Type, 2023–2035 (USD Million)
Table 119. Germany: Control & Monitoring Systems Market, by Type, 2023–2035 (USD Million)
Table 120. Germany: Support Equipment Market, by Type, 2023–2035 (USD Million)
Table 121. Germany: Bioprocessing Equipment Market, by Application, 2023–2035 (USD Million)
Table 122. Germany: Pharmaceutical & Biopharmaceutical Applications Market, by Type, 2023–2035 (USD Million)
Table 123. Germany: Food & Beverage Applications Market, by Type, 2023–2035 (USD Million)
Table 124. Germany: Agricultural Applications Market, by Type, 2023–2035 (USD Million)
Table 125. Germany: Industrial Biotechnology Market, by Type, 2023–2035 (USD Million)
Table 126. Germany: Environmental Applications Market, by Type, 2023–2035 (USD Million)
Table 127. Germany: Bioprocessing Equipment Market, by End User, 2023–2035 (USD Million)
Table 128. U.K.: Bioprocessing Equipment Market, by Product Type, 2023–2035 (USD Million)
Table 129. U.K.: Bioreactors Market, by Type, 2023–2035 (USD Million)
Table 130. U.K.: Fermenters Market, by Type, 2023–2035 (USD Million)
Table 131. U.K.: Filtration Systems Market, by Type, 2023–2035 (USD Million)
Table 132. U.K.: Control & Monitoring Systems Market, by Type, 2023–2035 (USD Million)
Table 133. U.K.: Support Equipment Market, by Type, 2023–2035 (USD Million)
Table 134. U.K.: Bioprocessing Equipment Market, by Application, 2023–2035 (USD Million)
Table 135. U.K.: Pharmaceutical & Biopharmaceutical Applications Market, by Type, 2023–2035 (USD Million)
Table 136. U.K.: Food & Beverage Applications Market, by Type, 2023–2035 (USD Million)
Table 137. U.K.: Agricultural Applications Market, by Type, 2023–2035 (USD Million)
Table 138. U.K.: Industrial Biotechnology Market, by Type, 2023–2035 (USD Million)
Table 139. U.K.: Environmental Applications Market, by Type, 2023–2035 (USD Million)
Table 140. U.K.: Bioprocessing Equipment Market, by End User, 2023–2035 (USD Million)
Table 141. France: Bioprocessing Equipment Market, by Product Type, 2023–2035 (USD Million)
Table 142. France: Bioreactors Market, by Type, 2023–2035 (USD Million)
Table 143. France: Fermenters Market, by Type, 2023–2035 (USD Million)
Table 144. France: Filtration Systems Market, by Type, 2023–2035 (USD Million)
Table 145. France: Control & Monitoring Systems Market, by Type, 2023–2035 (USD Million)
Table 146. France: Support Equipment Market, by Type, 2023–2035 (USD Million)
Table 147. France: Bioprocessing Equipment Market, by Application, 2023–2035 (USD Million)
Table 148. France: Pharmaceutical & Biopharmaceutical Applications Market, by Type, 2023–2035 (USD Million)
Table 149. France: Food & Beverage Applications Market, by Type, 2023–2035 (USD Million)
Table 150. France: Agricultural Applications Market, by Type, 2023–2035 (USD Million)
Table 151. France: Industrial Biotechnology Market, by Type, 2023–2035 (USD Million)
Table 152. France: Environmental Applications Market, by Type, 2023–2035 (USD Million)
Table 153. France: Bioprocessing Equipment Market, by End User, 2023–2035 (USD Million)
Table 154. Switzerland: Bioprocessing Equipment Market, by Product Type, 2023–2035 (USD Million)
Table 155. Switzerland: Bioreactors Market, by Type, 2023–2035 (USD Million)
Table 156. Switzerland: Fermenters Market, by Type, 2023–2035 (USD Million)
Table 157. Switzerland: Filtration Systems Market, by Type, 2023–2035 (USD Million)
Table 158. Switzerland: Control & Monitoring Systems Market, by Type, 2023–2035 (USD Million)
Table 159. Switzerland: Support Equipment Market, by Type, 2023–2035 (USD Million)
Table 160. Switzerland: Bioprocessing Equipment Market, by Application, 2023–2035 (USD Million)
Table 161. Switzerland: Pharmaceutical & Biopharmaceutical Applications Market, by Type, 2023–2035 (USD Million)
Table 162. Switzerland: Food & Beverage Applications Market, by Type, 2023–2035 (USD Million)
Table 163. Switzerland: Agricultural Applications Market, by Type, 2023–2035 (USD Million)
Table 164. Switzerland: Industrial Biotechnology Market, by Type, 2023–2035 (USD Million)
Table 165. Switzerland: Environmental Applications Market, by Type, 2023–2035 (USD Million)
Table 166. Switzerland: Bioprocessing Equipment Market, by End User, 2023–2035 (USD Million)
Table 167. Denmark: Bioprocessing Equipment Market, by Product Type, 2023–2035 (USD Million)
Table 168. Denmark: Bioreactors Market, by Type, 2023–2035 (USD Million)
Table 169. Denmark: Fermenters Market, by Type, 2023–2035 (USD Million)
Table 170. Denmark: Filtration Systems Market, by Type, 2023–2035 (USD Million)
Table 171. Denmark: Control & Monitoring Systems Market, by Type, 2023–2035 (USD Million)
Table 172. Denmark: Support Equipment Market, by Type, 2023–2035 (USD Million)
Table 173. Denmark: Bioprocessing Equipment Market, by Application, 2023–2035 (USD Million)
Table 174. Denmark: Pharmaceutical & Biopharmaceutical Applications Market, by Type, 2023–2035 (USD Million)
Table 175. Denmark: Food & Beverage Applications Market, by Type, 2023–2035 (USD Million)
Table 176. Denmark: Agricultural Applications Market, by Type, 2023–2035 (USD Million)
Table 177. Denmark: Industrial Biotechnology Market, by Type, 2023–2035 (USD Million)
Table 178. Denmark: Environmental Applications Market, by Type, 2023–2035 (USD Million)
Table 179. Denmark: Bioprocessing Equipment Market, by End User, 2023–2035 (USD Million)
Table 180. Rest of Europe: Bioprocessing Equipment Market, by Product Type, 2023–2035 (USD Million)
Table 181. Rest of Europe: Bioreactors Market, by Type, 2023–2035 (USD Million)
Table 182. Rest of Europe: Fermenters Market, by Type, 2023–2035 (USD Million)
Table 183. Rest of Europe: Filtration Systems Market, by Type, 2023–2035 (USD Million)
Table 184. Rest of Europe: Control & Monitoring Systems Market, by Type, 2023–2035 (USD Million)
Table 185. Rest of Europe: Support Equipment Market, by Type, 2023–2035 (USD Million)
Table 186. Rest of Europe: Bioprocessing Equipment Market, by Application, 2023–2035 (USD Million)
Table 187. Rest of Europe: Pharmaceutical & Biopharmaceutical Applications Market, by Type, 2023–2035 (USD Million)
Table 188. Rest of Europe: Food & Beverage Applications Market, by Type, 2023–2035 (USD Million)
Table 189. Rest of Europe: Agricultural Applications Market, by Type, 2023–2035 (USD Million)
Table 190. Rest of Europe: Industrial Biotechnology Market, by Type, 2023–2035 (USD Million)
Table 191. Rest of Europe: Environmental Applications Market, by Type, 2023–2035 (USD Million)
Table 192. Rest of Europe: Bioprocessing Equipment Market, by End User, 2023–2035 (USD Million)
Table 193. Asia-Pacific: Bioprocessing Equipment Market, by Product Type, 2023–2035 (USD Million)
Table 194. Asia-Pacific: Bioreactors Market, by Type, 2023–2035 (USD Million)
Table 195. Asia-Pacific: Fermenters Market, by Type, 2023–2035 (USD Million)
Table 196. Asia-Pacific: Filtration Systems Market, by Type, 2023–2035 (USD Million)
Table 197. Asia-Pacific: Control & Monitoring Systems Market, by Type, 2023–2035 (USD Million)
Table 198. Asia-Pacific: Support Equipment Market, by Type, 2023–2035 (USD Million)
Table 199. Asia-Pacific: Bioprocessing Equipment Market, by Application, 2023–2035 (USD Million)
Table 200. Asia-Pacific: Pharmaceutical & Biopharmaceutical Applications Market, by Type, 2023–2035 (USD Million)
Table 201. Asia-Pacific: Food & Beverage Applications Market, by Type, 2023–2035 (USD Million)
Table 202. Asia-Pacific: Agricultural Applications Market, by Type, 2023–2035 (USD Million)
Table 203. Asia-Pacific: Industrial Biotechnology Market, by Type, 2023–2035 (USD Million)
Table 204. Asia-Pacific: Environmental Applications Market, by Type, 2023–2035 (USD Million)
Table 205. Asia-Pacific: Bioprocessing Equipment Market, by End User, 2023–2035 (USD Million)
Table 206. China: Bioprocessing Equipment Market, by Product Type, 2023–2035 (USD Million)
Table 207. China: Bioreactors Market, by Type, 2023–2035 (USD Million)
Table 208. China: Fermenters Market, by Type, 2023–2035 (USD Million)
Table 209. China: Filtration Systems Market, by Type, 2023–2035 (USD Million)
Table 210. China: Control & Monitoring Systems Market, by Type, 2023–2035 (USD Million)
Table 211. China: Support Equipment Market, by Type, 2023–2035 (USD Million)
Table 212. China: Bioprocessing Equipment Market, by Application, 2023–2035 (USD Million)
Table 213. China: Pharmaceutical & Biopharmaceutical Applications Market, by Type, 2023–2035 (USD Million)
Table 214. China: Food & Beverage Applications Market, by Type, 2023–2035 (USD Million)
Table 215. China: Agricultural Applications Market, by Type, 2023–2035 (USD Million)
Table 216. China: Industrial Biotechnology Market, by Type, 2023–2035 (USD Million)
Table 217. China: Environmental Applications Market, by Type, 2023–2035 (USD Million)
Table 218. China: Bioprocessing Equipment Market, by End User, 2023–2035 (USD Million)
Table 219. Japan: Bioprocessing Equipment Market, by Product Type, 2023–2035 (USD Million)
Table 220. Japan: Bioreactors Market, by Type, 2023–2035 (USD Million)
Table 221. Japan: Fermenters Market, by Type, 2023–2035 (USD Million)
Table 222. Japan: Filtration Systems Market, by Type, 2023–2035 (USD Million)
Table 223. Japan: Control & Monitoring Systems Market, by Type, 2023–2035 (USD Million)
Table 224. Japan: Support Equipment Market, by Type, 2023–2035 (USD Million)
Table 225. Japan: Bioprocessing Equipment Market, by Application, 2023–2035 (USD Million)
Table 226. Japan: Pharmaceutical & Biopharmaceutical Applications Market, by Type, 2023–2035 (USD Million)
Table 227. Japan: Food & Beverage Applications Market, by Type, 2023–2035 (USD Million)
Table 228. Japan: Agricultural Applications Market, by Type, 2023–2035 (USD Million)
Table 229. Japan: Industrial Biotechnology Market, by Type, 2023–2035 (USD Million)
Table 230. Japan: Environmental Applications Market, by Type, 2023–2035 (USD Million)
Table 231. Japan: Bioprocessing Equipment Market, by End User, 2023–2035 (USD Million)
Table 232. India: Bioprocessing Equipment Market, by Product Type, 2023–2035 (USD Million)
Table 233. India: Bioreactors Market, by Type, 2023–2035 (USD Million)
Table 234. India: Fermenters Market, by Type, 2023–2035 (USD Million)
Table 235. India: Filtration Systems Market, by Type, 2023–2035 (USD Million)
Table 236. India: Control & Monitoring Systems Market, by Type, 2023–2035 (USD Million)
Table 237. India: Support Equipment Market, by Type, 2023–2035 (USD Million)
Table 238. India: Bioprocessing Equipment Market, by Application, 2023–2035 (USD Million)
Table 239. India: Pharmaceutical & Biopharmaceutical Applications Market, by Type, 2023–2035 (USD Million)
Table 240. India: Food & Beverage Applications Market, by Type, 2023–2035 (USD Million)
Table 241. India: Agricultural Applications Market, by Type, 2023–2035 (USD Million)
Table 242. India: Industrial Biotechnology Market, by Type, 2023–2035 (USD Million)
Table 243. India: Environmental Applications Market, by Type, 2023–2035 (USD Million)
Table 244. India: Bioprocessing Equipment Market, by End User, 2023–2035 (USD Million)
Table 245. South Korea: Bioprocessing Equipment Market, by Product Type, 2023–2035 (USD Million)
Table 246. South Korea: Bioreactors Market, by Type, 2023–2035 (USD Million)
Table 247. South Korea: Fermenters Market, by Type, 2023–2035 (USD Million)
Table 248. South Korea: Filtration Systems Market, by Type, 2023–2035 (USD Million)
Table 249. South Korea: Control & Monitoring Systems Market, by Type, 2023–2035 (USD Million)
Table 250. South Korea: Support Equipment Market, by Type, 2023–2035 (USD Million)
Table 251. South Korea: Bioprocessing Equipment Market, by Application, 2023–2035 (USD Million)
Table 252. South Korea: Pharmaceutical & Biopharmaceutical Applications Market, by Type, 2023–2035 (USD Million)
Table 253. South Korea: Food & Beverage Applications Market, by Type, 2023–2035 (USD Million)
Table 254. South Korea: Agricultural Applications Market, by Type, 2023–2035 (USD Million)
Table 255. South Korea: Industrial Biotechnology Market, by Type, 2023–2035 (USD Million)
Table 256. South Korea: Environmental Applications Market, by Type, 2023–2035 (USD Million)
Table 257. South Korea: Bioprocessing Equipment Market, by End User, 2023–2035 (USD Million)
Table 258. Singapore: Bioprocessing Equipment Market, by Product Type, 2023–2035 (USD Million)
Table 259. Singapore: Bioreactors Market, by Type, 2023–2035 (USD Million)
Table 260. Singapore: Fermenters Market, by Type, 2023–2035 (USD Million)
Table 261. Singapore: Filtration Systems Market, by Type, 2023–2035 (USD Million)
Table 262. Singapore: Control & Monitoring Systems Market, by Type, 2023–2035 (USD Million)
Table 263. Singapore: Support Equipment Market, by Type, 2023–2035 (USD Million)
Table 264. Singapore: Bioprocessing Equipment Market, by Application, 2023–2035 (USD Million)
Table 265. Singapore: Pharmaceutical & Biopharmaceutical Applications Market, by Type, 2023–2035 (USD Million)
Table 266. Singapore: Food & Beverage Applications Market, by Type, 2023–2035 (USD Million)
Table 267. Singapore: Agricultural Applications Market, by Type, 2023–2035 (USD Million)
Table 268. Singapore: Industrial Biotechnology Market, by Type, 2023–2035 (USD Million)
Table 269. Singapore: Environmental Applications Market, by Type, 2023–2035 (USD Million)
Table 270. Singapore: Bioprocessing Equipment Market, by End User, 2023–2035 (USD Million)
Table 271. Rest of Asia-Pacific: Bioprocessing Equipment Market, by Product Type, 2023–2035 (USD Million)
Table 272. Rest of Asia-Pacific: Bioreactors Market, by Type, 2023–2035 (USD Million)
Table 273. Rest of Asia-Pacific: Fermenters Market, by Type, 2023–2035 (USD Million)
Table 274. Rest of Asia-Pacific: Filtration Systems Market, by Type, 2023–2035 (USD Million)
Table 275. Rest of Asia-Pacific: Control & Monitoring Systems Market, by Type, 2023–2035 (USD Million)
Table 276. Rest of Asia-Pacific: Support Equipment Market, by Type, 2023–2035 (USD Million)
Table 277. Rest of Asia-Pacific: Bioprocessing Equipment Market, by Application, 2023–2035 (USD Million)
Table 278. Rest of Asia-Pacific: Food & Beverage Applications Market, by Type, 2023–2035 (USD Million)
Table 279. Rest of Asia-Pacific: Agricultural Applications Market, by Type, 2023–2035 (USD Million)
Table 280. Rest of Asia-Pacific: Industrial Biotechnology Market, by Type, 2023–2035 (USD Million)
Table 281. Rest of Asia-Pacific: Environmental Applications Market, by Type, 2023–2035 (USD Million)
Table 282. Rest of Asia-Pacific: Bioprocessing Equipment Market, by End User, 2023–2035 (USD Million)
Latin America Regional Tables
Table 283. Latin America: Bioprocessing Equipment Market, by Product Type, 2023–2035 (USD Million)
Table 284. Latin America: Bioreactors Market, by Type, 2023–2035 (USD Million)
Table 285. Latin America: Fermenters Market, by Type, 2023–2035 (USD Million)
Table 286. Latin America: Filtration Systems Market, by Type, 2023–2035 (USD Million)
Table 287. Latin America: Control & Monitoring Systems Market, by Type, 2023–2035 (USD Million)
Table 288. Latin America: Support Equipment Market, by Type, 2023–2035 (USD Million)
Table 289. Latin America: Bioprocessing Equipment Market, by Application, 2023–2035 (USD Million)
Table 290. Latin America: Pharmaceutical & Biopharmaceutical Applications Market, by Type, 2023–2035 (USD Million)
Table 291. Latin America: Food & Beverage Applications Market, by Type, 2023–2035 (USD Million)
Table 292. Latin America: Agricultural Applications Market, by Type, 2023–2035 (USD Million)
Table 293. Latin America: Industrial Biotechnology Market, by Type, 2023–2035 (USD Million)
Table 294. Latin America: Environmental Applications Market, by Type, 2023–2035 (USD Million)
Table 295. Latin America: Bioprocessing Equipment Market, by End User, 2023–2035 (USD Million)
Brazil Country-Specific Tables
Table 296. Brazil: Bioprocessing Equipment Market, by Product Type, 2023–2035 (USD Million)
Table 297. Brazil: Bioreactors Market, by Type, 2023–2035 (USD Million)
Table 298. Brazil: Fermenters Market, by Type, 2023–2035 (USD Million)
Table 299. Brazil: Filtration Systems Market, by Type, 2023–2035 (USD Million)
Table 300. Brazil: Control & Monitoring Systems Market, by Type, 2023–2035 (USD Million)
Table 301. Brazil: Support Equipment Market, by Type, 2023–2035 (USD Million)
Table 302. Brazil: Bioprocessing Equipment Market, by Application, 2023–2035 (USD Million)
Table 303. Brazil: Pharmaceutical & Biopharmaceutical Applications Market, by Type, 2023–2035 (USD Million)
Table 304. Brazil: Food & Beverage Applications Market, by Type, 2023–2035 (USD Million)
Table 305. Brazil: Agricultural Applications Market, by Type, 2023–2035 (USD Million)
Table 306. Brazil: Industrial Biotechnology Market, by Type, 2023–2035 (USD Million)
Table 307. Brazil: Environmental Applications Market, by Type, 2023–2035 (USD Million)
Table 308. Brazil: Bioprocessing Equipment Market, by End User, 2023–2035 (USD Million)
Mexico Country-Specific Tables
Table 309. Mexico: Bioprocessing Equipment Market, by Product Type, 2023–2035 (USD Million)
Table 310. Mexico: Bioreactors Market, by Type, 2023–2035 (USD Million)
Table 311. Mexico: Fermenters Market, by Type, 2023–2035 (USD Million)
Table 312. Mexico: Filtration Systems Market, by Type, 2023–2035 (USD Million)
Table 313. Mexico: Control & Monitoring Systems Market, by Type, 2023–2035 (USD Million)
Table 314. Mexico: Support Equipment Market, by Type, 2023–2035 (USD Million)
Table 315. Mexico: Bioprocessing Equipment Market, by Application, 2023–2035 (USD Million)
Table 316. Mexico: Pharmaceutical & Biopharmaceutical Applications Market, by Type, 2023–2035 (USD Million)
Table 317. Mexico: Food & Beverage Applications Market, by Type, 2023–2035 (USD Million)
Table 318. Mexico: Agricultural Applications Market, by Type, 2023–2035 (USD Million)
Table 319. Mexico: Industrial Biotechnology Market, by Type, 2023–2035 (USD Million)
Table 320. Mexico: Environmental Applications Market, by Type, 2023–2035 (USD Million)
Table 321. Mexico: Bioprocessing Equipment Market, by End User, 2023–2035 (USD Million)
Rest of Latin America Tables
Table 322. Rest of Latin America: Bioprocessing Equipment Market, by Product Type, 2023–2035 (USD Million)
Table 323. Rest of Latin America: Bioreactors Market, by Type, 2023–2035 (USD Million)
Table 324. Rest of Latin America: Fermenters Market, by Type, 2023–2035 (USD Million)
Table 325. Rest of Latin America: Filtration Systems Market, by Type, 2023–2035 (USD Million)
Table 326. Rest of Latin America: Control & Monitoring Systems Market, by Type, 2023–2035 (USD Million)
Table 327. Rest of Latin America: Support Equipment Market, by Type, 2023–2035 (USD Million)
Table 328. Rest of Latin America: Bioprocessing Equipment Market, by Application, 2023–2035 (USD Million)
Table 329. Rest of Latin America: Pharmaceutical & Biopharmaceutical Applications Market, by Type, 2023–2035 (USD Million)
Table 330. Rest of Latin America: Food & Beverage Applications Market, by Type, 2023–2035 (USD Million)
Table 331. Rest of Latin America: Agricultural Applications Market, by Type, 2023–2035 (USD Million)
Table 332. Rest of Latin America: Industrial Biotechnology Market, by Type, 2023–2035 (USD Million)
Table 333. Rest of Latin America: Environmental Applications Market, by Type, 2023–2035 (USD Million)
Table 334. Rest of Latin America: Bioprocessing Equipment Market, by End User, 2023–2035 (USD Million)
Tables 335-420 (Middle East & Africa Region)
Middle East & Africa Regional Tables
Table 335. Middle East & Africa: Bioprocessing Equipment Market, by Product Type, 2023–2035 (USD Million)
Table 336. Middle East & Africa: Bioreactors Market, by Type, 2023–2035 (USD Million)
Table 337. Middle East & Africa: Fermenters Market, by Type, 2023–2035 (USD Million)
Table 338. Middle East & Africa: Filtration Systems Market, by Type, 2023–2035 (USD Million)
Table 339. Middle East & Africa: Control & Monitoring Systems Market, by Type, 2023–2035 (USD Million)
Table 340. Middle East & Africa: Support Equipment Market, by Type, 2023–2035 (USD Million)
Table 341. Middle East & Africa: Bioprocessing Equipment Market, by Application, 2023–2035 (USD Million)
Table 342. Middle East & Africa: Pharmaceutical & Biopharmaceutical Applications Market, by Type, 2023–2035 (USD Million)
Table 343. Middle East & Africa: Food & Beverage Applications Market, by Type, 2023–2035 (USD Million)
Table 344. Middle East & Africa: Agricultural Applications Market, by Type, 2023–2035 (USD Million)
Table 345. Middle East & Africa: Industrial Biotechnology Market, by Type, 2023–2035 (USD Million)
Table 346. Middle East & Africa: Environmental Applications Market, by Type, 2023–2035 (USD Million)
Table 347. Middle East & Africa: Bioprocessing Equipment Market, by End User, 2023–2035 (USD Million)
UAE Country-Specific Tables
Table 348. UAE: Bioprocessing Equipment Market, by Product Type, 2023–2035 (USD Million)
Table 349. UAE: Bioreactors Market, by Type, 2023–2035 (USD Million)
Table 350. UAE: Fermenters Market, by Type, 2023–2035 (USD Million)
Table 351. UAE: Filtration Systems Market, by Type, 2023–2035 (USD Million)
Table 352. UAE: Control & Monitoring Systems Market, by Type, 2023–2035 (USD Million)
Table 353. UAE: Support Equipment Market, by Type, 2023–2035 (USD Million)
Table 354. UAE: Bioprocessing Equipment Market, by Application, 2023–2035 (USD Million)
Table 355. UAE: Pharmaceutical & Biopharmaceutical Applications Market, by Type, 2023–2035 (USD Million)
Table 356. UAE: Food & Beverage Applications Market, by Type, 2023–2035 (USD Million)
Table 357. UAE: Agricultural Applications Market, by Type, 2023–2035 (USD Million)
Table 358. UAE: Industrial Biotechnology Market, by Type, 2023–2035 (USD Million)
Table 359. UAE: Environmental Applications Market, by Type, 2023–2035 (USD Million)
Table 360. UAE: Bioprocessing Equipment Market, by End User, 2023–2035 (USD Million)
Saudi Arabia Country-Specific Tables
Table 361. Saudi Arabia: Bioprocessing Equipment Market, by Product Type, 2023–2035 (USD Million)
Table 362. Saudi Arabia: Bioreactors Market, by Type, 2023–2035 (USD Million)
Table 363. Saudi Arabia: Fermenters Market, by Type, 2023–2035 (USD Million)
Table 364. Saudi Arabia: Filtration Systems Market, by Type, 2023–2035 (USD Million)
Table 365. Saudi Arabia: Control & Monitoring Systems Market, by Type, 2023–2035 (USD Million)
Table 366. Saudi Arabia: Support Equipment Market, by Type, 2023–2035 (USD Million)
Table 367. Saudi Arabia: Bioprocessing Equipment Market, by Application, 2023–2035 (USD Million)
Table 368. Saudi Arabia: Pharmaceutical & Biopharmaceutical Applications Market, by Type, 2023–2035 (USD Million)
Table 369. Saudi Arabia: Food & Beverage Applications Market, by Type, 2023–2035 (USD Million)
Table 370. Saudi Arabia: Agricultural Applications Market, by Type, 2023–2035 (USD Million)
Table 371. Saudi Arabia: Industrial Biotechnology Market, by Type, 2023–2035 (USD Million)
Table 372. Saudi Arabia: Environmental Applications Market, by Type, 2023–2035 (USD Million)
Table 373. Saudi Arabia: Bioprocessing Equipment Market, by End User, 2023–2035 (USD Million)
South Africa Country-Specific Tables
Table 374. South Africa: Bioprocessing Equipment Market, by Product Type, 2023–2035 (USD Million)
Table 375. South Africa: Bioreactors Market, by Type, 2023–2035 (USD Million)
Table 376. South Africa: Fermenters Market, by Type, 2023–2035 (USD Million)
Table 377. South Africa: Filtration Systems Market, by Type, 2023–2035 (USD Million)
Table 378. South Africa: Control & Monitoring Systems Market, by Type, 2023–2035 (USD Million)
Table 379. South Africa: Support Equipment Market, by Type, 2023–2035 (USD Million)
Table 380. South Africa: Bioprocessing Equipment Market, by Application, 2023–2035 (USD Million)
Table 381. South Africa: Pharmaceutical & Biopharmaceutical Applications Market, by Type, 2023–2035 (USD Million)
Table 382. South Africa: Food & Beverage Applications Market, by Type, 2023–2035 (USD Million)
Table 383. South Africa: Agricultural Applications Market, by Type, 2023–2035 (USD Million)
Table 384. South Africa: Industrial Biotechnology Market, by Type, 2023–2035 (USD Million)
Table 385. South Africa: Environmental Applications Market, by Type, 2023–2035 (USD Million)
Table 386. South Africa: Bioprocessing Equipment Market, by End User, 2023–2035 (USD Million)
Rest of MEA Tables
Table 387. Rest of MEA: Bioprocessing Equipment Market, by Product Type, 2023–2035 (USD Million)
Table 388. Rest of MEA: Bioreactors Market, by Type, 2023–2035 (USD Million)
Table 389. Rest of MEA: Fermenters Market, by Type, 2023–2035 (USD Million)
Table 390. Rest of MEA: Filtration Systems Market, by Type, 2023–2035 (USD Million)
Table 391. Rest of MEA: Control & Monitoring Systems Market, by Type, 2023–2035 (USD Million)
Table 392. Rest of MEA: Support Equipment Market, by Type, 2023–2035 (USD Million)
Table 393. Rest of MEA: Bioprocessing Equipment Market, by Application, 2023–2035 (USD Million)
Table 394. Rest of MEA: Pharmaceutical & Biopharmaceutical Applications Market, by Type, 2023–2035 (USD Million)
Table 395. Rest of MEA: Food & Beverage Applications Market, by Type, 2023–2035 (USD Million)
Table 396. Rest of MEA: Agricultural Applications Market, by Type, 2023–2035 (USD Million)
Table 397. Rest of MEA: Industrial Biotechnology Market, by Type, 2023–2035 (USD Million)
Table 398. Rest of MEA: Environmental Applications Market, by Type, 2023–2035 (USD Million)
Table 399. Rest of MEA: Bioprocessing Equipment Market, by End User, 2023–2035 (USD Million)
LIST OF FIGURES
Figure 1. Research Process
Figure 2. Secondary Components Referenced for This Study
Figure 3. Primary Research Techniques
Figure 4. Key Executives Interviewed
Figure 5. Breakdown of Primary Interviews (Supply Side & Demand Side)
Figure 6. Market Sizing and Growth Forecast Approach
Figure 7. In 2025, the Bioreactors to Account for the Largest Share by Product Type
Figure 8. In 2025, the Pharmaceutical & Biopharmaceutical Applications to Account for the Largest Share
Figure 9. In 2025, the Biopharmaceutical and Pharmaceutical Companies to Account for the Largest Share by End User
Figure 10. North America to be the Largest Regional Market
Figure 11. Impact Analysis of Market Dynamics
Figure 12. Global Bioprocessing Equipment Market: Porter's Five Forces Analysis
Figure 13. Sustainability Impact Framework on Bioprocessing Equipment Market
Figure 14. Global Bioprocessing Equipment Market, by Product Type, 2025 Vs. 2035 (USD Million)
Figure 15. Global Bioprocessing Equipment Market, by Application, 2025 Vs. 2035 (USD Million)
Figure 16. Global Bioprocessing Equipment Market, by End User, 2025 Vs. 2035 (USD Million)
Figure 17. Global Bioprocessing Equipment Market, by Region, 2025 Vs. 2035 (USD Million)
Figure 18. Bioreactors Market, by Type, 2025 Vs. 2035 (USD Million)
Figure 19. Fermenters Market, by Scale, 2025 Vs. 2035 (USD Million)
Figure 20. Filtration Systems Market, by Technology, 2025 Vs. 2035 (USD Million)
Figure 21. Control & Monitoring Systems Market, by Component, 2025 Vs. 2035 (USD Million)
Figure 22. Support Equipment Market, by Type, 2025 Vs. 2035 (USD Million)
Figure 23. Pharmaceutical & Biopharmaceutical Applications Market, by Product, 2025 Vs. 2035 (USD Million)
Figure 24. Food & Beverage Applications Market, by Category, 2025 Vs. 2035 (USD Million)
Figure 25. Industrial Biotechnology Applications Market, by Product, 2025 Vs. 2035 (USD Million)
Figure 26. North America: Bioprocessing Equipment Market Snapshot (2025)
Figure 27. Europe: Bioprocessing Equipment Market Snapshot (2025)
Figure 28. Asia-Pacific: Bioprocessing Equipment Market Snapshot (2025)
Figure 29. Latin America: Bioprocessing Equipment Market Snapshot (2025)
Figure 30. Middle East & Africa: Bioprocessing Equipment Market Snapshot (2025)
Figure 31. Key Growth Strategies Adopted by Leading Players (2022–2025)
Figure 32. Global Bioprocessing Equipment Market Competitive Benchmarking, by Product Type
Figure 33. Competitive Dashboard: Global Bioprocessing Equipment Market
Figure 34. Global Bioprocessing Equipment Market Share/Ranking, by Key Player, 2024 (%)


Published Date: Jun-2026
Published Date: Jan-2025
Published Date: Jan-2025
Published Date: Jan-2025
Subscribe to get the latest industry updates