Resources
About Us
Big Data in Oil & Gas Market Analysis and Forecast Booms as Digital Transformation and AI-Driven Insights Drive Growth
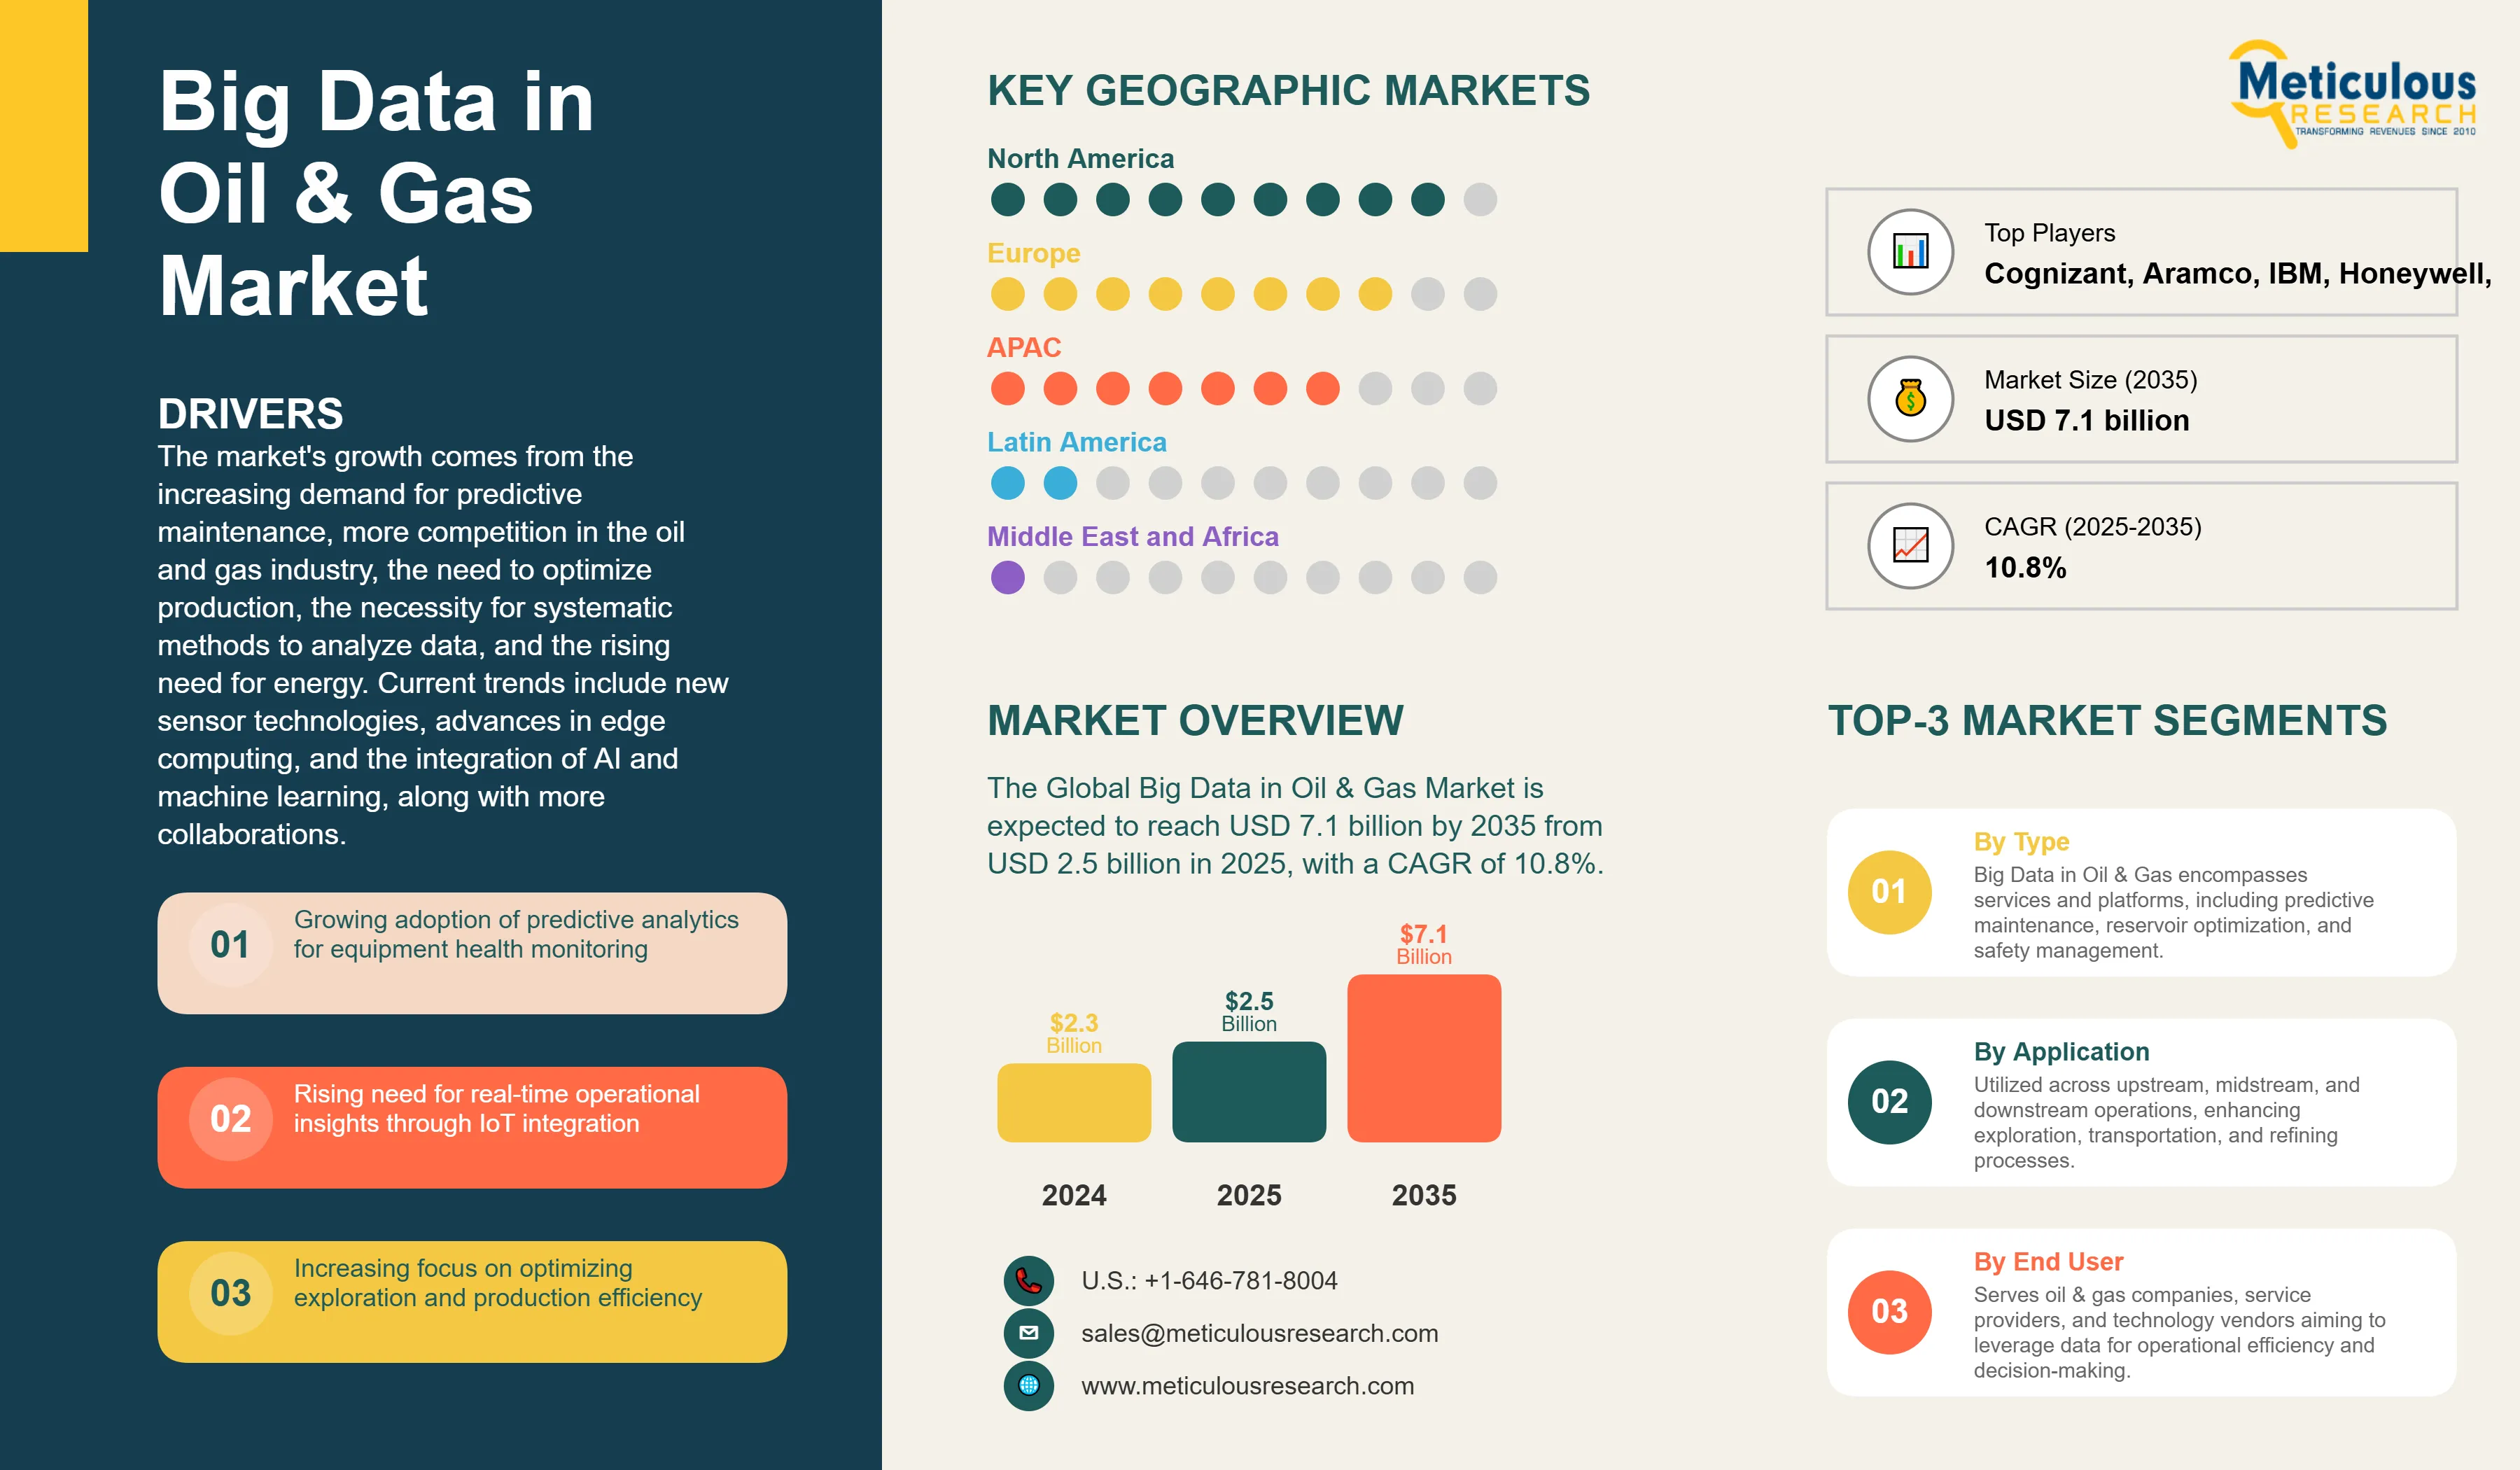
The Global Big Data in Oil & Gas Market was valued at USD 2.3 billion in 2024. The market is expected to reach USD 7.1 billion by 2035 from USD 2.5 billion in 2025, with a CAGR of 10.8%. The market's growth comes from the increasing demand for predictive maintenance, more competition in the oil and gas industry, the need to optimize production, the necessity for systematic methods to analyze data, and the rising need for energy. Current trends include new sensor technologies, advances in edge computing, and the integration of AI and machine learning, along with more collaborations.
Companies can improve decision-making, reduce downtime, and significantly optimize their operations by analyzing large datasets from seismic surveys, sensor-based drilling equipment, and pipeline monitoring systems. For instance, ExxonMobil can enhance equipment health monitoring beyond basic one-time tests. By using predictive analytics, they can foresee equipment issues and carry out maintenance proactively, instead of facing costly unscheduled shutdowns.
Competitive Scenario and Insights
Click here to: Get Free Sample Pages of this Report
The global big data market in oil and gas is very competitive. It includes oilfield service providers, leading technology companies, and integrated energy firms. Market players are investing heavily in analytics platforms that combine artificial intelligence (AI), cloud computing, and real-time data processing. This helps them strengthen their competitive edge.
Major technology companies like IBM, Microsoft, and Oracle offer scalable big data and cloud-based solutions designed for oil and gas operations. These solutions enable predictive maintenance, production optimization, and reservoir modeling. Oilfield service leaders such as Schlumberger and Halliburton use their industry knowledge to integrate big data analytics into drilling, seismic interpretation, and field management. Integrated energy companies, including big names like ExxonMobil, BP, and Shell, are also expanding their in-house digital projects to improve efficiency and sustainability.
Competition is influenced by technological innovation, industry knowledge, and the ability to provide complete digital solutions. These solutions support predictive maintenance, reservoir optimization, and real-time decision-making. Partnerships, joint ventures, and collaborations between oil and gas companies and digital tech providers are becoming more common. This trend shows the industry's increasing dependence on data-driven strategies to improve efficiency and cut costs.
Recent Developments
Blackstone to Acquire Energy Analytics Firm Enverus
In August 2025, Blackstone has acquired Enverus one of the top energy data and analytics firms with around USD 6.5 billion. Enverus has more than 8,000 clients in 50 countries and provides AI-enabled decision-making and real-time energy intelligence. The purchase highlights the increased role of data-based knowledge in the energy industry.
BP Makes Its Largest Oil & Gas Discovery Offshore Brazil in 25 Years
In August 2025, BP had announced a significant discovery at the Bumerangue exploration well in the deepwater Santos Basin of Brazil what could be the largest discovery in its 25 year history. The discovery is consistent with the policy of the BP to increase its upstream unit production to 2.5 million barrels per day by 2030, compared to slightly above 2.3 million barrels in 2024. The company is interested in the block on favorable commercial rates.
Key Market Drivers
Oil and gas companies are increasingly adopting predictive maintenance solutions to reduce downtime and lower operational costs through big data analytics. By forecasting equipment failures and scheduling timely maintenance, operators can significantly enhance asset reliability. Shell, a British multinational oil and gas company, has expanded its predictive maintenance program to more than 10,000 units of equipment across its global facilities, making it one of the largest implementations in the energy sector. This large-scale rollout highlights Shell’s commitment to leveraging AI and big data to improve operational efficiency and safety.
Big data analytics is playing a transformative role in enhancing reservoir modeling, seismic data interpretation, and drilling optimization, leading to increased production and reduced operational risks. For instance, in March 2025, ExxonMobil combined its Discovery 6 supercomputer with elastic Full Wavefield Inversion (eFWI) technology to achieve 4D seismic imaging in weeks instead of months. This advancement has enabled more accurate exploration activities, improved resource identification, and greater efficiency in upstream operations.
The convergence of IoT-enabled devices and real-time analytics is providing oil and gas companies with actionable insights to improve operational efficiency and safety. For example, BP employs AI-powered pipeline monitoring platforms integrated with IoT sensors to detect anomalies in real time, enabling proactive responses to potential environmental risks. These technologies support predictive interventions, reduce unplanned outages, and strengthen the integrity of pipeline and production operations.
Key Market Restraints
Table: Key Factors Impacting the Global Big Data in Oil & Gas Market Analysis and Forecast (2025–2035)
Base CAGR: 10.8%
|
Category |
Key Factor |
Short-Term Impact (2025–2028) |
Long-Term Impact (2029–2035) |
Estimated CAGR Impact |
|
Drivers |
1. Demand for Lightweight and Fuel-Efficient Aircraft |
Increased adoption of 3D-printed titanium and composite parts in commercial and defense aircraft |
Integration of additive manufacturing for major structural and interior Offerings across fleets |
▲ +3.4% |
|
2. Supply Chain Resilience & On-Demand Manufacturing |
Localized printing of spare parts to reduce lead times in MRO operations |
Fully distributed additive manufacturing networks supporting global aerospace fleets |
▲ +3.0% |
|
|
3. Rapid Prototyping and Reduced Time-to-Market |
Faster design cycles for aerospace Offerings and prototypes |
Permanent integration of AM into R&D and production pipelines |
▲ +2.7% |
|
|
Restraints |
1. High Certification and Qualification Costs |
Limits adoption to high-value and mission-critical parts initially |
Certification processes become standardized, reducing costs |
▼ −1.4% |
|
2. Limited Aerospace-Grade Applications & Build Sizes |
Restricts printing of large primary structures |
Development of new alloys and large-format printers expands Analytics range |
▼ −1.2% |
|
|
Opportunities |
1. Expansion in Space Exploration Programs |
Increased demand for lightweight, high-performance parts for rockets and satellites |
Space-based manufacturing using 3D printing for in-orbit assembly |
▲ +3.1% |
|
2. Sustainability and Waste Reduction |
Reduced raw Application waste compared to subtractive manufacturing |
Alignment with zero-emission and green aerospace manufacturing goals |
▲ +2.8% |
|
|
Trends |
1. Hybrid Manufacturing Integration |
Combined additive-subtractive production for precision aerospace parts |
Industry standard for critical Offering production |
▲ +2.4% |
|
Challenges |
1. Scaling Production for Large Aerospace Offerings |
Large structures remain difficult to produce efficiently |
Breakthroughs in printer scale and speed enable full structural printing |
▼ −0.9% |
Regional Analysis
North America Leads the Big Data in Oil & Gas Market
North America is set to hold the largest share, around 32 to 35%, of the global big data in oil and gas market by 2025. This leadership comes from the region's strong technological base, the presence of major oil and gas companies, and the wide adoption of digital transformation efforts. The rise in shale gas production is being boosted by IoT sensors, AI analytics, and cloud computing across upstream and midstream operations. A key example is Chevron’s Decision Support Center in Houston; it tracks real-time drilling activities in the Permian Basin. The center processes over a terabyte of data daily. This allows engineers to quickly adjust drilling strategies using live insights. Moreover, Chevron’s DigitalField platform uses IoT sensors and AI analytics to improve drilling efficiency, enhance asset performance, and cut operational costs.
Asia Pacific Emerges as the Fastest-Growing Market for Data-Driven Energy Operations
Asia Pacific is the fastest-growing area in the big data in oil and gas market. This growth is driven by rising energy demand, significant investments in digital transformation, and government-backed initiatives that promote smart energy infrastructure. Countries like China, India, Japan, and Australia are leading the way in using advanced analytics, AI, and IoT solutions to optimize exploration, production, and downstream operations. Both national and independent oil companies in this region increasingly use predictive and real-time analytics to improve drilling efficiency, minimize downtime, and lessen environmental impact. For example, PetroChina and ONGC are expanding their use of big data platforms to enhance reservoir management, increase production efficiency, and support long-term sustainability goals.
Europe Strengthens Its Position in Data-Driven Energy Operations
Europe remains an important growth hub in the big data in oil and gas market. This is driven by strict environmental regulations, a strong focus on sustainability, and increased investments in digital energy infrastructure. Oil majors and service providers in the region are speeding up the adoption of AI-driven analytics and IoT monitoring solutions to reduce carbon emissions and improve operational efficiency. For instance, BP has introduced advanced data analytics platforms to optimize offshore production in the North Sea. This allows for smarter resource allocation while reducing environmental risks.
Country-level Analysis
Leading in Technological Adoption in the United States
The United States leads the big data in oil and gas market. This is due to a high number of major oil producers, a strong digital ecosystem, and the widespread use of AI, IoT, and predictive analytics. Big data-driven exploration and production is especially beneficial for the shale gas industry. It allows for quicker and more cost-effective resource development. For example, ExxonMobil uses advanced seismic data analytics to find high-potential drilling areas more quickly and at much lower costs.
Advancing Offshore Digital Transformation in the United Kingdom
The United Kingdom is an important player in Europe, with significant offshore oil and gas operations in the North Sea. There is also a strong regulatory push for efficiency and safety. UK companies are increasingly using big data solutions to monitor assets, improve predictive maintenance, and reduce downtime. BP, for example, uses real-time analytics on its North Sea platforms. This approach allows for prompt responses to equipment issues and improves overall operational reliability.
Accelerating Digital Oilfield Adoption in China
China is quickly increasing its use of big data analytics and IoT solutions in the oil and gas sector. This aims to improve production efficiency and safety. Industry leaders like Sinopec and CNPC are implementing predictive maintenance systems and real-time monitoring in both onshore and offshore operations. For instance, Sinopec has teamed up with Huawei to create smart factories and a digital manufacturing platform. This platform uses AI to optimize chemical reactions in refining processes. This effort boosts productivity, cuts energy use, and enhances sustainability without affecting oil quality.
Segmental Analysis
By Operation: Upstream Segment Dominates with 42-50% of Revenue Share
The upstream segment leads the global big data in the oil and gas market, accounting for an estimated 42-50% of total revenue. Its dominance comes from the crucial role of exploration and production (E&P) in the industry, where big data analytics has the greatest operational and financial impact. For instance, in Q4 2024, ExxonMobil reported production of 610,000 barrels of oil equivalent per day (boe/d) in the Permian Basin, slightly above its 2023 guidance. Meanwhile, Chevron reached 1.646 million barrels per day, largely driven by operations in the same basin. Both companies use analytics, artificial intelligence (AI), and machine learning to improve drilling efficiency, enhance reservoir management, and maximize recovery rates. Predictive analytics also supports upstream operations by reducing downtime, optimizing resource allocation, and lowering operating costs. Additionally, environmental monitoring technologies, such as satellite and aerial imaging, allow for real-time detection of methane leaks, connecting upstream activities to sustainability goals. Together, these advancements show why the upstream segment is the leading revenue generator and the most innovative area in the oil and gas sector.
By Application, Seismic Data Analysis Segment Leads the Market with 20-30% of Market Share
Seismic data analysis is the largest application area in the big data in oil and gas market, with an estimated market share of 20-30%. This leadership comes from the enormous amount of seismic data generated, where a single 3D seismic survey can produce 5-10 terabytes of raw data, and ultra-deepwater or 4D seismic surveys may exceed 1 petabyte. Converting this large volume of data into usable geological models requires high-performance computing, advanced analytics, and machine learning. Modern seismic analytics have cut data processing times by 70-80%, speeding up exploration workflows from months to weeks. The use of advanced seismic analytics directly boosts business outcomes: drilling success rates can rise by 15-20%, the cost of dry wells (typically USD 20-25 million per well) can decrease, and overall hydrocarbon recovery efficiency can improve by 5-10%. For example, ExxonMobil uses elastic Full Wavefield Inversion (eFWI) with supercomputing capabilities to achieve 4D seismic imaging more than 60% faster, allowing for more accurate identification of hydrocarbon-rich zones. The increasing integration of seismic analytics with AI-based interpretation tools further enhances subsurface anomaly detection, reaching up to 90% accuracy, which reduces human error and operational risk. This combination positions seismic data analysis as the most essential application segment for both cost efficiency and risk reduction in upstream exploration.
|
Report Attribute |
Details |
|
Market size (2025) |
USD 2.5 billion |
|
Revenue forecast in 2035 |
USD 7.1 billion |
|
CAGR (2025-2035) |
10.8% |
|
Base Year |
2024 |
|
Forecast period |
2025 – 2035 |
|
Report coverage |
Market size and forecast, competitive landscape and benchmarking, country/regional level analysis, key trends, growth drivers and restraints |
|
Segments covered |
Offering (Service and Platform), Operation (Downstream, Upstream, and Midstream), Analytics, Application, End-Use, Geography |
|
Regional scope |
North America, Europe, Asia-Pacific, Latin America, and Middle East & Africa |
|
Key companies profiled |
Cognizant, Aramco, Emerson Electric, IBM, Honeywell, Palantir Technologies, Yokogawa, Schneider Electric, Schlumberger, ScienceSoft, and Other Key Players. |
|
Customization |
Comprehensive report customization with purchase. Addition or modification to country, regional & segment scope available |
|
Pricing Details |
Access customized purchase options to meet your specific research requirements. Explore flexible pricing models |
Market Segmentation
The big data in oil & gas market size is estimated to be USD 2.5 billion in 2025 and grow at a CAGR of 10.8% to reach USD 7.1 billion by 2035.
In 2024, the big data in oil & gas market size was estimated at USD 2.3 billion, with projections to reach USD 2.5 billion in 2025.
Cognizant, Aramco, Emerson Electric, IBM, Honeywell, and Palantir Technologies are the major companies operating in the big data in oil & gas market.
The Asia Pacific region is projected to grow at the highest CAGR over the forecast period (2025-2035).
In 2025, Predictive Analytics is estimated to account for the largest market share in the big data in oil & gas market.
1. Market Definition & Scope
1.1. Market Definition
1.2. Market Ecosystem
1.3. Currency
1.4. Key Stakeholders
2. Research Methodology
2.1. Research Approach
2.2. Process of Data Collection and Validation
2.2.1. Secondary Research
2.2.2. Primary Research / Interviews with Key Opinion Leaders from the Industry
2.3. Market Sizing and Forecast
2.3.1. Market Size Estimation Approach
2.3.1.1. Bottom-up Approach
2.3.1.2. Top-down Approach
2.3.2. Growth Forecast Approach
2.3.3. Assumptions for the Study
3. Executive Summary
3.1. Overview
3.2. Segmental Analysis
3.2.1. Big Data in Oil & Gas Market, by Offering
3.2.2. Big Data in Oil & Gas Market, by Operation
3.2.3. Big Data in Oil & Gas Market, by Analytics
3.2.4. Big Data in Oil & Gas Market, by Application
3.2.5. Big Data in Oil & Gas Market, by End-Use
3.2.6. Big Data in Oil & Gas Market, by Region
3.3. Competitive Landscape
3.4. Strategic Recommendations
4. Market Insights
4.1. Overview
4.2. Factors Affecting Market Growth
4.2.1. Drivers
4.2.1.1. Growing adoption of predictive analytics for equipment health monitoring
4.2.1.2. Rising need for real-time operational insights through IoT integration
4.2.1.3. Increasing focus on optimizing exploration and production efficiency
4.2.1.4. Regulatory push for improved safety and environmental compliance through data monitoring
4.2.2. Restraints
4.2.2.1. High initial investment and uncertain short-term ROI
4.2.2.2. Data security and cyberattack vulnerabilities
4.2.2.3. Shortage of skilled professionals for big data analytics in oil & gas
4.2.3. Opportunities
4.2.3.1. Expansion of AI and machine learning applications for reservoir and production optimization
4.2.3.2. Growing demand for cloud-based analytics platforms to enhance scalability and accessibility
4.2.4. Trends
4.2.4.1. Integration of digital twins for real-time simulation and asset performance monitoring
4.2.4.2. Increased collaboration between oil companies and tech firms for customized big data solutions
4.2.5. Challenges
4.2.5.1. Managing and processing the massive volume and variety of oil & gas operational data
4.2.5.2. Ensuring interoperability between legacy systems and modern analytics platforms
4.3. Porter's Five Forces Analysis
4.3.1. Bargaining Power of Suppliers
4.3.2. Bargaining Power of Buyers
4.3.3. Threat of Substitutes
4.3.4. Threat of New Entrants
4.3.5. Degree of Competition
4.4. Technological Impact on Big Data in Oil & Gas Market
4.4.1. Artificial Intelligence (AI) and Machine Learning Integration
4.4.1.1. Predictive algorithms for equipment failure detection and maintenance scheduling
4.4.1.2. AI-driven seismic data interpretation for faster and more accurate exploration decisions
4.4.2. Internet of Things (IoT) and Sensor-Based Monitoring
4.4.2.1. Deployment of smart sensors in pipelines and rigs for real-time operational data
4.4.2.2. Remote monitoring of offshore platforms to reduce on-site personnel needs
4.4.3. Cloud Computing and Advanced Analytics Platforms
4.4.3.1. Scalable storage and processing of vast operational datasets
4.4.3.2. Integration of cross-functional data sources for unified decision-making dashboards
5. Impact of Sustainability on Big Data in Oil & Gas Market
5.1. Reducing carbon footprint through optimized operations
5.2. Meeting stricter global environmental compliance standards
5.3. Driving efficiency with sustainable resource management
5.4. Attracting ESG-focused investment and financing opportunities
5.5. Integrating renewables into traditional energy portfolios
5.6. Building trust through sustainability and transparency
5.7. Accelerating innovation with green digital technologies
6. Competitive Landscape
6.1. Overview
6.2. Key Growth Strategies
6.3. Competitive Benchmarking
6.4. Competitive Dashboard
6.4.1. Industry Leaders
6.4.2. Market Differentiators
6.4.3. Vanguards
6.4.4. Contemporary Stalwarts
6.5. Market Share/Ranking Analysis, by Key Players, 2024
7. Big Data in Oil & Gas Market Assessment—By Offering
7.1. Overview
7.2. Service
7.3. Platform
8. Big Data in Oil & Gas Market Assessment—By Operation
8.1. Overview
8.2. Downstream
8.3. Upstream
8.4. Midstream
9. Big Data in Oil & Gas Market Assessment—By Analytics
9.1. Overview
9.2. Diagnostic analytics
9.3. Descriptive analytics
9.4. Prescriptive analytics
9.5. Predictive analytics
9.6. Real-time analytics
10. Big Data in Oil & Gas Market Assessment—By Application
10.1. Overview
10.2. Reservoir optimization
10.3. Seismic data analysis
10.4. Exploration risk analysis
10.5. Production forecasting
10.6. Drilling optimization
10.7. Supply chain optimization
10.8. Other Applications
11. Big Data in Oil & Gas Market Assessment—By End-Use
11.1. Overview
11.2. Independent Oil Companies (IOCs)
11.3. National Oil Companies (NOCs)
12. Big Data in Oil & Gas Market Assessment—By Geography
12.1. Overview
12.2. North America
12.2.1. U.S.
12.2.2. Canada
12.3. Europe
12.3.1. Germany
12.3.2. U.K.
12.3.3. France
12.3.4. Netherlands
12.3.5. Switzerland
12.3.6. Rest of Europe
12.4. Asia-Pacific
12.4.1. China
12.4.2. Japan
12.4.3. South Korea
12.4.4. Taiwan
12.4.5. India
12.4.6. Singapore
12.4.7. Australia
12.4.8. Rest of Asia-Pacific
12.5. Latin America
12.5.1. Brazil
12.5.2. Mexico
12.5.3. Argentina
12.5.4. Rest of Latin America
12.6. Middle East & Africa
12.6.1. UAE
12.6.2. Saudi Arabia
12.6.3. Israel
12.6.4. South Africa
12.6.5. Rest of Middle East & Africa
13. Company Profiles (Business Overview, Financial Overview, Product Portfolio, Strategic Developments, and SWOT Analysis)
13.1. Cognizant
13.2. Aramco
13.3. Emerson Electric
13.4. IBM
13.5. Honeywell
13.6. Palantir Technologies
13.7. Yokogawa
13.8. Schneider Electric
13.9. Schlumberger
13.10. ScienceSoft
13.11. Other Key Players
14. Appendix
14.1. Available Customization
14.2. Related Reports


Published Date: Apr-2024
Published Date: Oct-2023
Published Date: Jan-2023
Published Date: Jun-2024
Subscribe to get the latest industry updates