Resources
About Us
Prebiotics Market by Ingredient (Inulin, Fructo-oligosaccharides, Galacto-oligosaccharides, Mannan-oligosaccharides, Pectin, Resistant Starch); Application (Food & Beverages, Dietary Supplements, Animal Feed & Pet Food, Cosmetics & Personal Care); Form; Source; Functionality, and Geography — Global Forecast to 2036
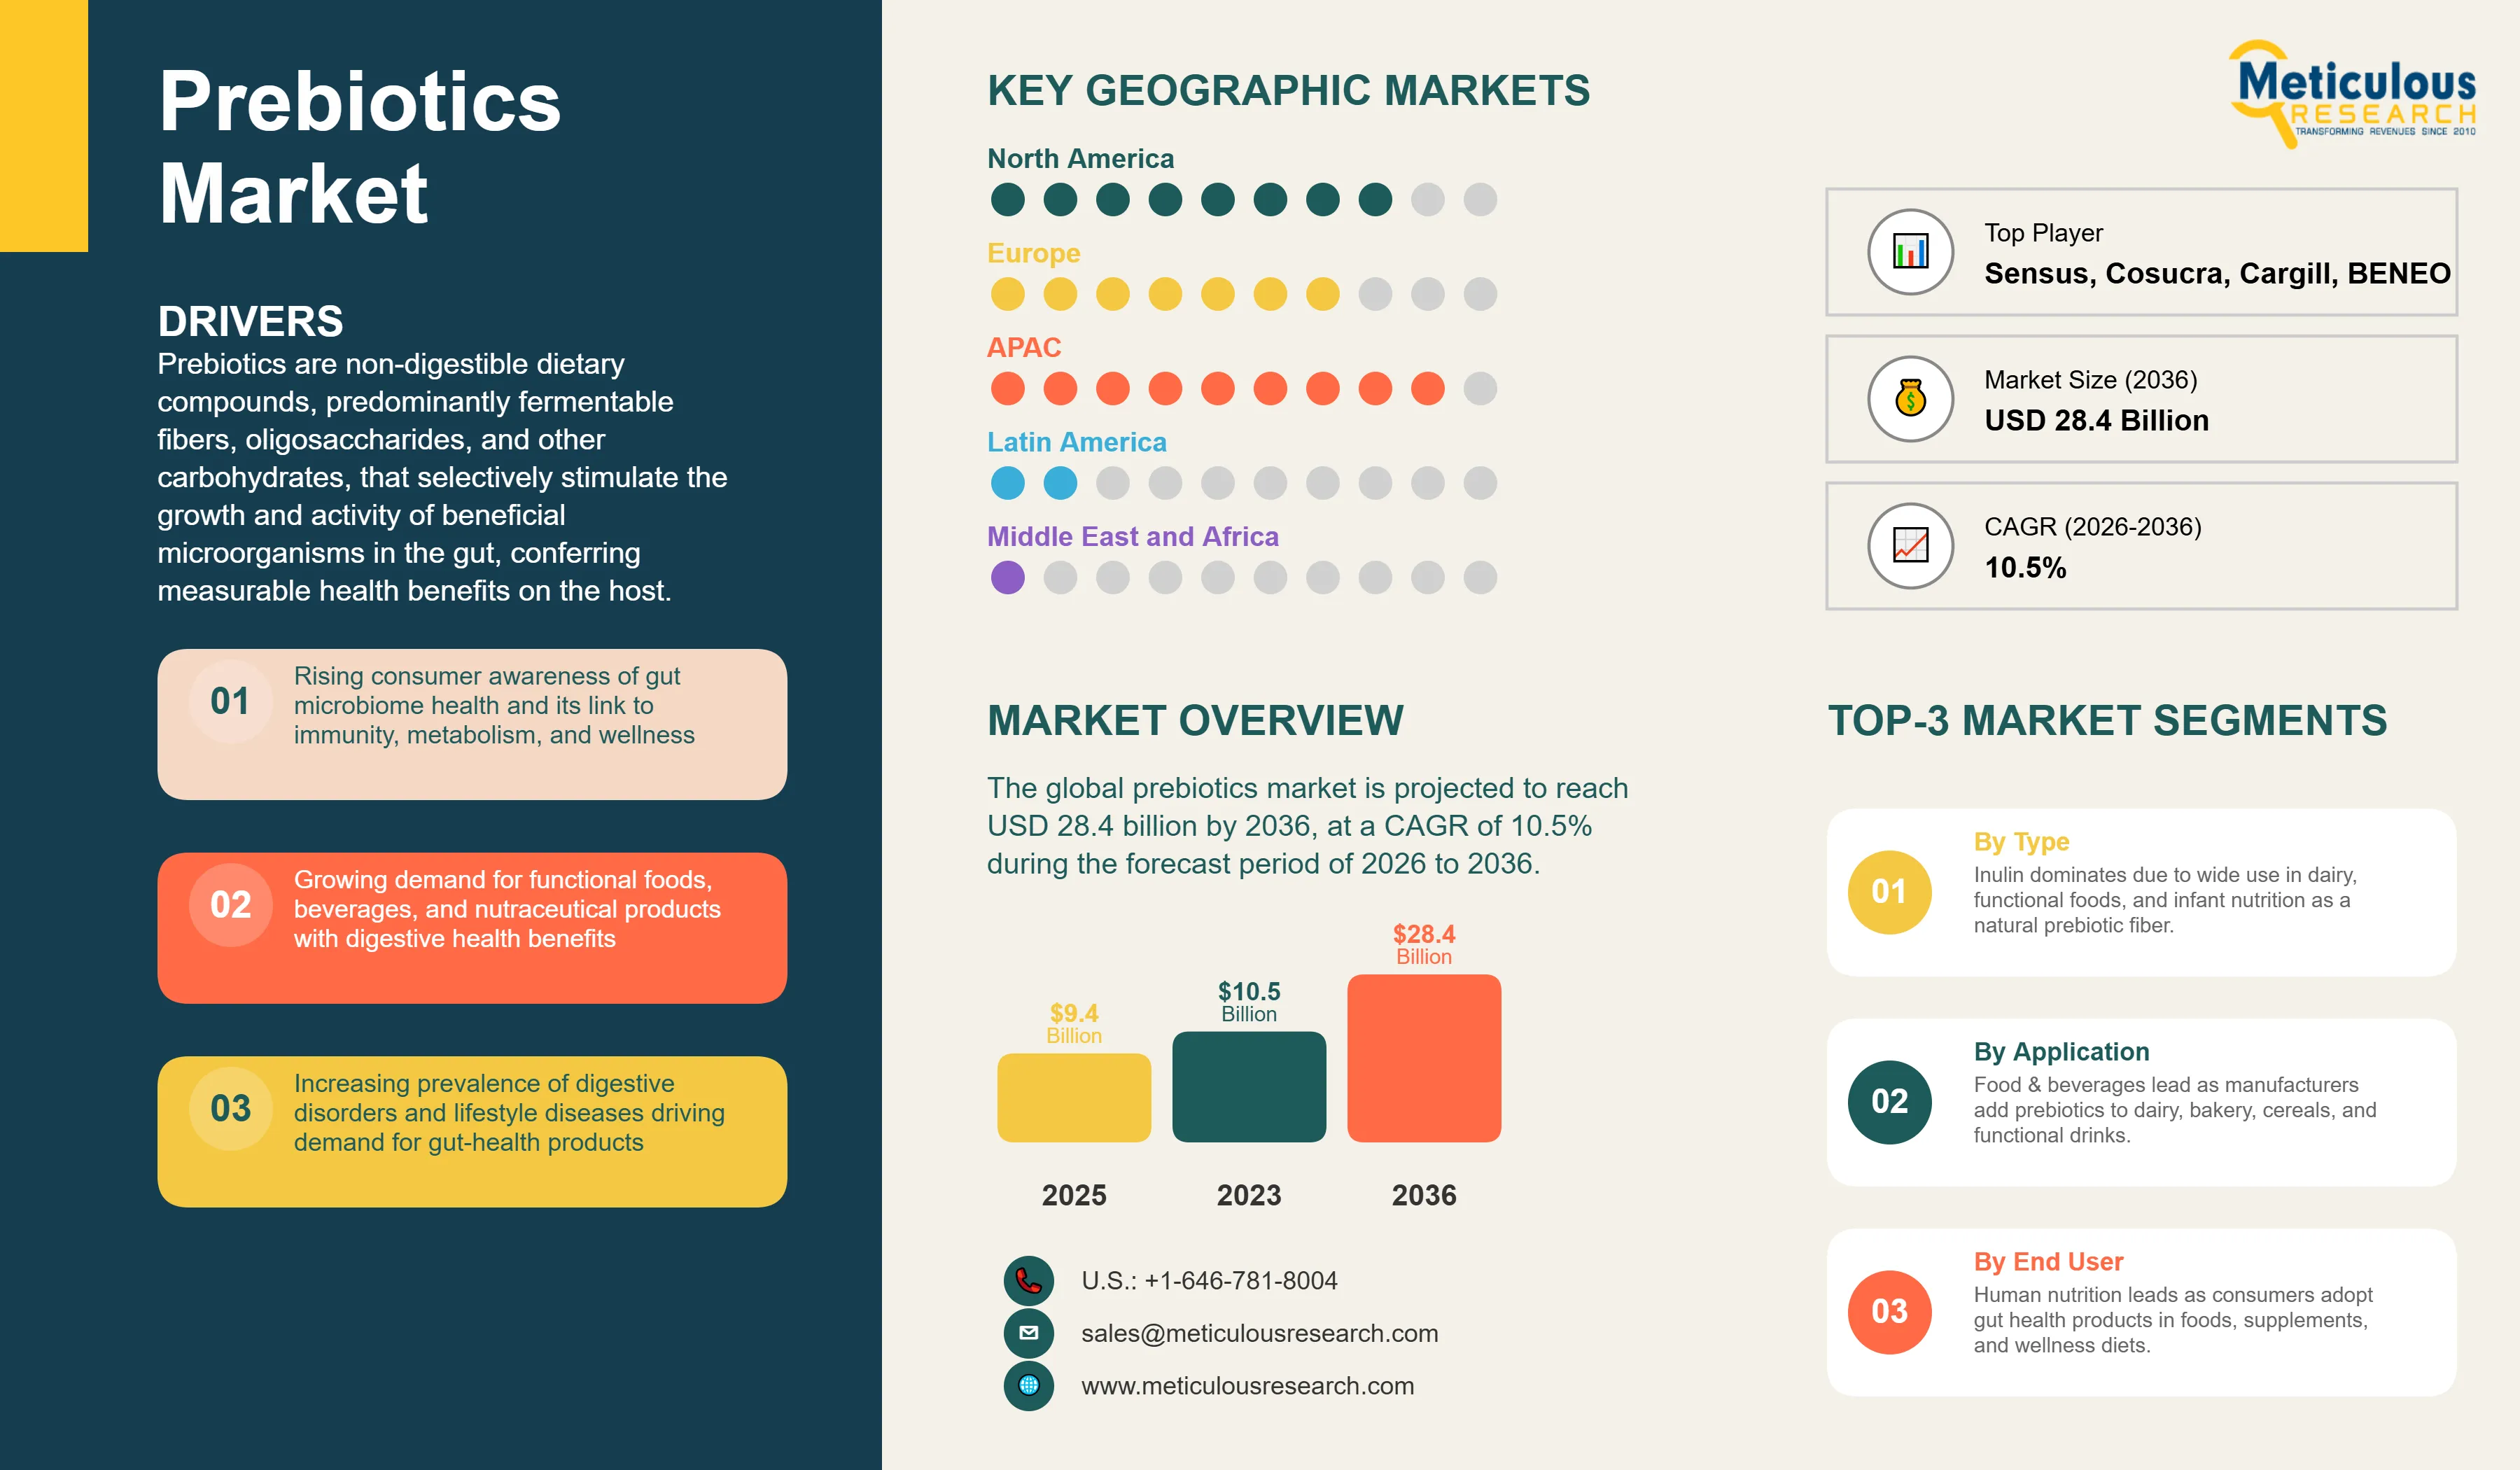
Report ID: MRFB - 104684 Pages: 172 Mar-2026 Formats*: PDF Category: Food and Beverages Delivery: 24 to 48 Hours Download Free Sample ReportThe global prebiotics market was valued at USD 9.4 billion in 2025 and is projected to reach USD 28.4 billion by 2036 from USD 10.5 billion in 2026, at a CAGR of 10.5% during the forecast period of 2026 to 2036.
Prebiotics are non-digestible dietary compounds, predominantly fermentable fibers, oligosaccharides, and other carbohydrates, that selectively stimulate the growth and activity of beneficial microorganisms in the gut, conferring measurable health benefits on the host. Unlike probiotics, which introduce live microbial cultures, prebiotics serve as metabolic substrates that nourish the existing beneficial gut microbiota, supporting the production of short-chain fatty acids (SCFAs) such as butyrate, propionate, and acetate, key mediators of gut barrier integrity, immune regulation, metabolic function, and systemic wellness. The key commercially established prebiotic ingredients include inulin and its hydrolysis derivative oligofructose (derived predominantly from chicory root), fructo-oligosaccharides (FOS), galacto-oligosaccharides (GOS), mannan-oligosaccharides (MOS), pectin, and resistant starch, with a growing pipeline of novel ingredients including human milk oligosaccharides (HMOs), lactulose, xylooligosaccharides (XOS), cellooligosaccharides (COS), and isomalto-oligosaccharides (IMOs).
The global prebiotics market is driven by various factors such as an rapid increase in scientific understanding of the gut microbiome’s central role in overall health; growing consumer shift toward functional, digestive health-supporting foods and beverages; the rising prevalence of gastrointestinal disorders, metabolic diseases, and immune dysfunction globally; and rapidly growing institutional recognition of the gut-brain axis, gut-immune axis, and gut-metabolic axis as foundational determinants of systemic health outcomes. Recent surveys indicate 76–82% of consumers recognize the role of gut health in immunity and overall physical well-being, reflecting growing microbiome awareness.
Click here to: Get Free Sample Pages of this Report
Growing Consumer Awareness of Gut Microbiome and Systemic Health Connections
One of the key drivers of the prebiotics market is the increasing recognition of the role of the gut microbiome in overall health. Scientific studies have demonstrated that the human gastrointestinal tract hosts more than 100 trillion microorganisms, collectively forming the gut microbiota that influences digestive health, immune function, metabolism, and neurological signaling. Research published by the National Institutes of Health (NIH) Human Microbiome Project highlights the key role of gut microbiota in maintaining physiological homeostasis and preventing disease.
In addition, scientific evidence continues to expand regarding the gut–brain axis, which describes the bidirectional communication between the gastrointestinal tract and the central nervous system. Studies published in journals such as Nature Reviews Gastroenterology & Hepatology indicate that gut microbiota composition can influence mental health, immune responses, and metabolic processes. These findings have significantly increased consumer interest in microbiome-supporting products, including prebiotics, probiotics, and synbiotics.
Growing awareness of these health connections is encouraging food manufacturers and dietary supplement companies to incorporate prebiotic fibers into consumer products designed to support gut microbiome balance.
Rising Demand for Nutraceuticals and Functional Food & Beverages
The growing demand for functional foods, beverages, and nutraceutical products is another major driver of the prebiotics market. Consumers are increasingly seeking food products that provide health benefits beyond basic nutrition, particularly those supporting digestive health, immunity, and overall wellness.
Prebiotic ingredients are widely used in functional foods and beverages due to their ability to selectively stimulate beneficial gut microbiota and support digestive health. Applications include dairy products, functional beverages, bakery products, breakfast cereals, infant nutrition products, and nutritional bars.
The expansion of the functional food and beverage industry is therefore directly increasing demand for prebiotic ingredients. According to the Functional Food and Beverages Market report by Meticulous Research, the global functional food and beverages market was valued at USD 332.56 billion in 2025 and is expected to reach USD 725.25 billion by 2036, growing at a CAGR of 7.3% during the forecast period (2026–2036).
As food and beverage manufacturers increasingly incorporate health-promoting ingredients into product formulations, prebiotics are gaining traction as functional ingredients in dairy products, plant-based beverages, fiber-enriched snacks, and ready-to-drink wellness beverages. The continued growth of the functional food and beverage sector is therefore expected to significantly drive demand for prebiotic ingredients during the forecast period.
Increasing Development of Synbiotic and Multi-Biotic Formulations
One of the key trends in the prebiotics market is the growing development of synbiotic and multi-biotic formulations, which combine prebiotics with probiotics and other microbiome-support ingredients. Synbiotic products are designed to enhance the growth and activity of beneficial microorganisms by pairing specific prebiotic substrates with compatible probiotic strains.
Scientific research indicates that combining prebiotics with probiotics can improve microbial survival, fermentation activity, and metabolic outputs compared to single-ingredient formulations. As a result, manufacturers are increasingly developing multi-fiber prebiotic blends and synbiotic products targeting digestive health, immunity, metabolic health, and overall microbiome balance.
In addition, postbiotics, bioactive compounds produced during microbial fermentation, are gaining attention as complementary ingredients in microbiome formulations. These compounds include metabolites such as short-chain fatty acids (SCFAs), peptides, and microbial cell components that may provide health benefits. Their greater stability compared with live probiotic organisms also makes them suitable for a wider range of product formats, including powders, capsules, and functional foods.
The increasing integration of prebiotics, probiotics, and postbiotics into comprehensive microbiome-support formulations is therefore expected to drive demand for specialized prebiotic ingredients optimized for synbiotic applications.
Expanding Research on the Gut–Brain Axis and Psychobiotics
Another key trend driving the prebiotics market is the growing scientific interest in the gut–brain axis, which refers to the bidirectional communication between the gastrointestinal tract and the central nervous system.
Research has demonstrated that gut microbiota can influence neurological and psychological processes through mechanisms involving microbial metabolites, immune signaling, and neurochemical pathways. As a result, certain prebiotic fibers such as galacto-oligosaccharides (GOS), fructo-oligosaccharides (FOS), and partially hydrolyzed guar gum (PHGG) are being investigated for their potential role in supporting mental well-being, stress resilience, and cognitive function.
This expanding body of research has contributed to the emergence of psychobiotics, a category of microbiome-targeted ingredients intended to influence mental health through modulation of gut microbiota. Although this field is still evolving, increasing clinical research activity and growing consumer interest in mental wellness are encouraging manufacturers to explore prebiotic ingredients in formulations designed to support both digestive health and cognitive well-being.
|
Market Size by 2036 |
USD 28.4 Billion |
|
Market Size in 2025 (Base Year) |
USD 9.4 Billion |
|
Market Size in 2026 |
USD 10.5 Billion |
|
Market Growth Rate (2026–2036) |
CAGR of 10.5% |
|
Dominating Region (2026) |
Asia-Pacific |
|
Fastest Growing Region |
Asia-Pacific |
|
Base Year |
2025 |
|
Forecast Period |
2026 to 2036 |
|
Segments Covered |
By Ingredient: Inulin, Fructo-oligosaccharides (FOS), Galacto-oligosaccharides (GOS), Mannan-oligosaccharides (MOS), Pectin, Resistant Starch, Other Prebiotic Ingredients By Application: Food & Beverages (Dairy Products, Beverages, Bakery & Confectionery, Cereals-Based Products, Infant Food Products, Other F&B Applications); Dietary Supplements; Animal Feed & Pet Food; Cosmetics & Personal Care By Form: Powder, Liquid By Source: Roots, Grains, Fruits & Vegetables, Other Sources By Functionality: Gut Health, Immunity, Bone Health, Heart Health, Weight Management, Other Functions By Geography: North America, Europe, Asia-Pacific, Latin America, Middle East & Africa |
|
Regions Covered |
North America, Europe, Asia-Pacific, Latin America, Middle East & Africa |
Why Does the Inulin Segment Dominate the Prebiotics Market?
Based on ingredient, inulin is expected to account for the largest share of the global prebiotics market in 2026. Inulin is one of the most widely used and commercially established prebiotic ingredients and is primarily extracted from chicory root (Cichorium intybus) through industrial extraction processes that allow large-scale production.
Inulin is widely used in food formulations due to its dual functionality as a dietary fiber and functional food ingredient. In addition to its prebiotic activity, it is frequently used as a fat replacer, sugar-reduction ingredient, texture modifier, and moisture-retention agent in food products such as dairy products, bakery products, cereals, nutritional bars, and infant nutrition products. The increasing demand for plant-derived dietary fibers and clean-label ingredients, therefore, continues to support the widespread adoption of inulin in functional food formulations.
Galacto-oligosaccharides (GOS): High-Growth Ingredient Driven by Infant Nutrition
Galacto-oligosaccharides (GOS) are expected to grow at the fastest CAGR during the forecast period due to their expanding use in infant nutrition and dietary supplements. GOS are produced enzymatically from lactose through transgalactosylation and structurally resemble certain oligosaccharides naturally present in human milk.
According to research published in Nutrients and the Journal of Pediatric Gastroenterology and Nutrition, infant formulas supplemented with GOS or GOS/FOS mixtures promote gut microbiota profiles similar to those observed in breastfed infants, particularly by increasing bifidobacteria levels.
Human milk naturally contains 5–15 grams per liter of human milk oligosaccharides (HMOs), which function as natural prebiotics for infants. Because GOS mimic some structural features of these oligosaccharides, they are widely incorporated into infant formula to help support gut microbiome development and immune function. In addition to infant nutrition, GOS are increasingly incorporated into functional foods, beverages, and dietary supplements targeting digestive health and immune support due to their high solubility, neutral taste, and stability in food systems.
Isomalto-oligosaccharides (IMOs): Emerging Ingredient with Functional Sweetener Properties
Isomalto-oligosaccharides (IMOs) are gaining increasing attention in the prebiotics market due to their dual functionality as prebiotic fibers and low-calorie sweeteners. IMOs are produced through enzymatic conversion of starch and are widely used in nutrition bars, baked goods, beverages, and dietary supplements. IMOs exhibit excellent heat and acid stability, making them suitable for incorporation into processed foods and beverages. Their mild sweetness and ability to partially replace sugar also support their use in reduced-sugar and low-glycemic formulations, which are increasingly demanded by health-conscious consumers.
Why Does the Food & Beverages Segment Dominate the Prebiotics Market?
Based on application, food & beverages is expected to account for the largest share of the global prebiotics market in 2026, due to the widespread incorporation of prebiotic ingredients across dairy products, cereals, bakery products, functional beverages, and infant nutrition products.
Prebiotic ingredients function as fermentable substrates for beneficial gut microorganisms, leading to the production of short-chain fatty acids (SCFAs) such as acetate, propionate, and butyrate. According to scientific reviews published in Nature Reviews Gastroenterology & Hepatology and the Journal of Nutrition, these metabolites play a key role in maintaining intestinal barrier integrity, supporting immune function, and regulating metabolic processes.
Among food applications, dairy products are one of the largest end-use categories, as prebiotic fibers are frequently combined with probiotic cultures in synbiotic fermented dairy products such as yogurt and cultured milk beverages.
Dietary Supplements: Fastest-Growing Application Segment
The dietary supplements segment is projected to grow at the fastest CAGR during the forecast period, driven by increasing consumer demand for products supporting digestive health, immunity, and microbiome balance.
Prebiotic ingredients are increasingly incorporated into capsules, powders, chewable tablets, and gummy supplements, often combined with probiotic strains to develop synbiotic formulations. The growing consumer interest in microbiome health is therefore driving the development of gut-health supplements and personalized nutrition products.
Animal Feed & Pet Food: Growing Application Driven by Antibiotic Reduction
The animal feed and pet food is a growing application area for prebiotic ingredients. Regulatory initiatives aimed at reducing antibiotic use in livestock production are driving the adoption of functional feed additives that support gut health. For example, according to the European Medicines Agency (EMA), veterinary antimicrobial sales in the European Union declined by approximately 53% between 2011 and 2022 following regulatory actions to reduce antibiotic use in livestock production. These policies are encouraging producers to adopt alternatives such as prebiotics, probiotics, and other gut-health feed additives.
Prebiotic ingredients are therefore increasingly incorporated into poultry, swine, aquaculture, and companion animal nutrition to support digestive health and improve feed efficiency.
Asia-Pacific: Largest Regional Market
Asia-Pacific is expected to account for the largest share of the global prebiotics market in 2026, driven by its large population base, growing health awareness, and expanding functional food industry. Countries such as China, Japan, and South Korea have well-established functional food markets and strong consumer demand for digestive health products. Japan, in particular, has a long history of functional food commercialization through the Foods for Specified Health Uses (FOSHU) regulatory framework established by Japan’s Ministry of Health, Labour and Welfare.
China has also emerged as a major production hub for oligosaccharide prebiotic ingredients such as fructo-oligosaccharides (FOS), galacto-oligosaccharides (GOS), and isomalto-oligosaccharides (IMOs) used in functional foods and nutraceutical products. Rapid urbanization, rising incomes, and growing nutraceutical markets are therefore expected to continue driving strong demand for prebiotic ingredients across the Asia-Pacific region.
The report includes a competitive landscape based on an assessment of product portfolios, geographic presence, and key strategic developments adopted by leading companies in the prebiotics market. Key companies operating in this market include Archer-Daniels-Midland Company, BENEO GmbH, Cargill, Incorporated, Cosucra Groupe Warcoing SA, Kerry Group plc, Roquette Frères, Ingredion Incorporated, Tereos Group, Sensus B.V., International Flavors & Fragrances Inc., Tate & Lyle plc, Nexira, DSM-Firmenich, Hayashibara Co., Ltd., Quantum Hi-Tech Biological Co., Ltd., Longlive Bio-Technology Co., Ltd., and Baolingbao Biology Co., Ltd., among others.
Prebiotics Market, by Ingredient
Prebiotics Market, by Application
Prebiotics Market, by Form
Prebiotics Market, by Source
Prebiotics Market, by Functionality
Prebiotics Market, by Geography
Prebiotics are non-digestible food ingredients that selectively stimulate the growth and activity of beneficial gut microorganisms. Common prebiotic ingredients include inulin, fructo-oligosaccharides (FOS), galacto-oligosaccharides (GOS), mannooligosaccharides (MOS), resistant starch, and emerging ingredients such as human milk oligosaccharides (HMOs), isomalto-oligosaccharides (IMOs), and xylo-oligosaccharides (XOS).
The global prebiotics market is projected to reach USD 28.4 billion by 2036, growing from USD 10.5 billion in 2026, at a CAGR of 10.5% during the forecast period (2026–2036).
The isomalto-oligosaccharides (IMOs) segment is expected to register the highest CAGR during the forecast period, driven by their dual functionality as prebiotic fibers and low-calorie sugar replacers.
The dietary supplements segment is projected to register the highest CAGR during the forecast period, driven by growing demand for gut health supplements and synbiotic formulations.
Key drivers include increasing consumer awareness of gut microbiome health, rising demand for functional foods and nutraceuticals, expanding use of prebiotics in infant nutrition, and growing adoption of synbiotic and microbiome-support formulations.
Major restraints include high production costs for certain prebiotic ingredients, digestive tolerance concerns associated with high-dose prebiotic consumption, and regulatory differences across global markets.
Key players operating in the global prebiotics market include Archer-Daniels-Midland Company, BENEO GmbH, Cargill, Incorporated, Cosucra Groupe Warcoing SA, Kerry Group plc, Roquette Frères, Ingredion Incorporated, Tereos Group, Sensus B.V., International Flavors & Fragrances Inc., Nexira, Meiji Holdings Co., Ltd., Hayashibara Co., Ltd., Quantum Hi-Tech Biological Co., Ltd., Longlive Bio-Technology Co., Ltd., and Baolingbao Biology Co., Ltd.
Asia-Pacific is expected to account for the largest share of the global prebiotics market during the forecast period, while North America and Europe remain key markets for functional food and nutraceutical applications.


Published Date: May-2024
Published Date: Jun-2022
Published Date: Jun-2023
Published Date: Jan-2025
Published Date: Aug-2024
Please enter your corporate email id here to view sample report.
Subscribe to get the latest industry updates