Resources
About Us
Plant-based Protein Market by Type (Soy Proteins, Wheat Proteins, Pea Proteins, Potato Proteins), Form (Solid, Liquid), Source Process (Conventional, Organic), and Application (Food and Beverages, Animal Feed, Nutritional Supplements) - Global Forecast to 2036
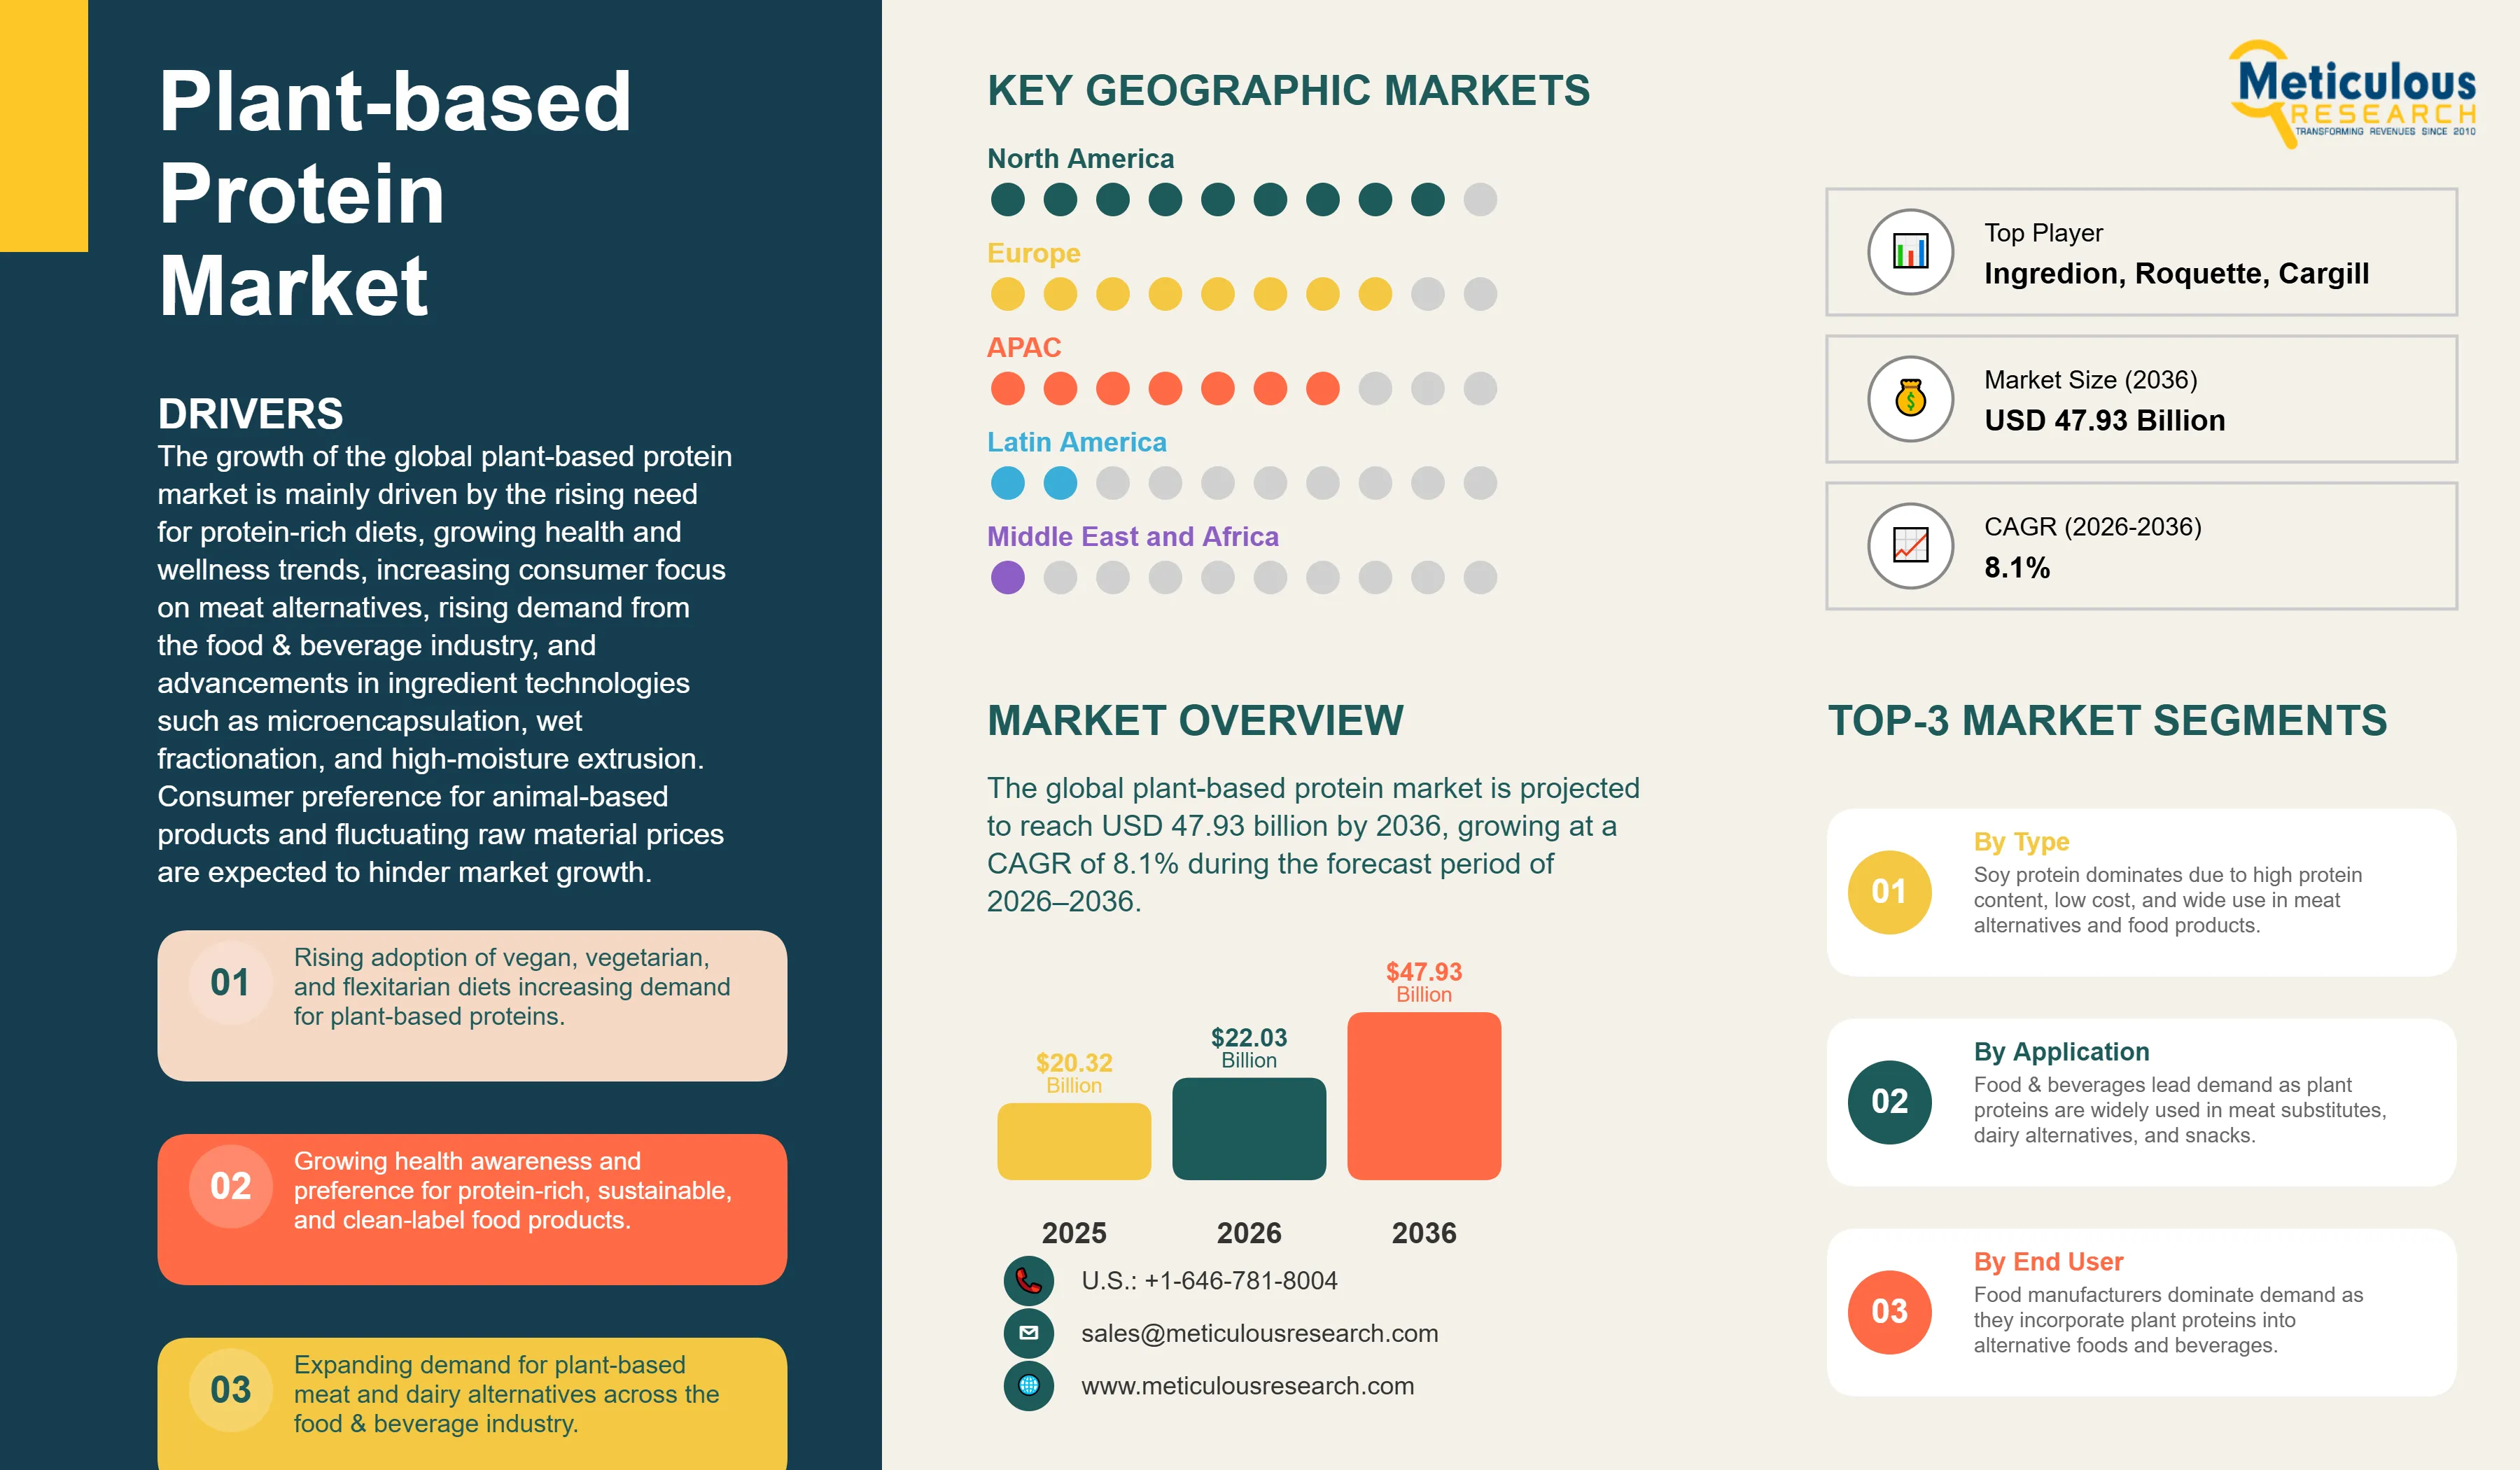
Report ID: MRFB - 104331 Pages: 588 Mar-2026 Formats*: PDF Category: Food and Beverages Delivery: 24 to 48 Hours Download Free Sample ReportThe global plant-based protein market was valued at USD 20.32 billion in 2025 and is estimated to reach USD 22.03 billion in 2026. The market is projected to reach USD 47.93 billion by 2036, growing at a CAGR of 8.1% during the forecast period of 2026–2036. On a volume basis, the market is expected to grow from approximately 5.7 million tons in 2026 to around 12.5 million tons by 2036.
The growth of the global plant-based protein market is mainly driven by the rising need for protein-rich diets, growing health and wellness trends, increasing consumer focus on meat alternatives, rising demand from the food & beverage industry, and advancements in ingredient technologies such as microencapsulation, wet fractionation, and high-moisture extrusion. Consumer preference for animal-based products and fluctuating raw material prices are expected to hinder market growth. Key growth opportunities include consumers' increasing inclination toward plant-based meats, expanding emerging economy markets, and rising prevalence of intolerance to animal proteins.
Click here to: Get Free Sample Pages of this Report
|
Report Coverage |
Details |
|
Market Size (Value) by 2036 |
USD 47.93 Billion |
|
Market Size (Volume) by 2036 |
~12.5 Million Tons |
|
Market Size (Value) in 2025 (Estimated) |
USD 20.32 Billion |
|
Market Size (Value) in 2026 |
USD 22.03 Billion |
|
Market Growth Rate (Value, 2026–2036) |
CAGR of 8.1% |
|
Base Year |
2025 |
|
Forecast Period |
2026 to 2036 |
|
Dominating Region |
North America (largest share in 2026) |
|
Fastest Growing Region |
Asia-Pacific (highest CAGR during forecast period) |
|
Dominating Type Segment |
Soy Proteins (largest share in 2026) |
|
Fastest Growing Type Segment |
Pea Proteins (highest CAGR during forecast period) |
|
Dominating Form Segment |
Solid (Dry) (largest share and highest CAGR in 2026) |
|
Fastest Growing Source Process Segment |
Organic Plant-Based Protein Ingredients (highest CAGR during forecast period) |
|
Dominating Application Segment |
Food & Beverage (largest share in 2026) |
|
Fastest Growing Application Segment |
Nutrition & Health Supplements (highest CAGR during forecast period) |
|
Segments Covered |
By Type: Soy Proteins (Soy Protein Concentrate; Soy Protein Isolate; Textured Soy Protein; Other Soy Proteins); Wheat Proteins (Vital Wheat Gluten; Wheat Protein Isolate; Hydrolyzed Wheat Protein; Textured Wheat Protein); Pea Proteins (Yellow Pea Proteins [Isolates, Concentrates, Textured, Hydrolysate, Flour, Other]; Green Pea Proteins [Isolates, Concentrates, Textured, Hydrolysate, Flour, Other]); Canola Proteins (Canola Protein Isolate; Canola Protein Concentrate; Other Canola Proteins); Potato Proteins (Concentrate; Isolate); Rice Proteins (Isolate; Concentrate; Hydrolysate); Corn Proteins (Isolate; Concentrate; Hydrolysate); Other Plant-Based Proteins | By Form: Solid (Dry); Liquid | By Source Process: Conventional Plant-Based Protein Ingredients; Organic Plant-Based Protein Ingredients | By Application: Food & Beverage; Animal Feed; Nutrition & Health Supplements; Pharmaceuticals; Other Plant Protein-based Applications |
|
Countries Covered |
North America (U.S. and Canada); Europe (Germany, France, U.K., Italy, Spain, and Rest of Europe); Asia-Pacific (China, India, Japan, Australia, and Rest of Asia-Pacific); Latin America (Brazil, Mexico, Argentina, and Rest of Latin America); Middle East & Africa |
Increasing Adoption of Vegan, Vegetarian, and Flexitarian Diets
The growing adoption of vegan, vegetarian, and flexitarian dietary patterns is one of the most important trends supporting the plant-based protein market. Consumers across major global markets are increasingly reducing their consumption of animal-derived foods due to health, environmental, and ethical considerations. While strict vegan and vegetarian diets remain relatively small segments in many regions, flexitarian consumers, those who reduce but do not eliminate animal products, represent a large and growing consumer base driving demand for plant-based protein ingredients.
Several global initiatives and consumer movements illustrate this dietary shift. The Veganuary campaign reported participation from approximately 25.8 million people worldwide in 2025, highlighting the growing interest in plant-based diets. In addition, the Plant Based Foods Association (PBFA) reports that 70% of U.S. consumers consume plant-based foods and 62% of U.S. households purchase plant-based food products, demonstrating the mainstream adoption of plant-based foods in developed markets.
Government dietary policies are also driving increased consumption of plant-derived proteins. For example, China’s Dietary Guidelines (2022 revision) encourage increased consumption of soybeans and other legumes as part of balanced diets to improve nutrition and reduce diet-related chronic diseases. In Europe, the EU Farm to Fork Strategy promotes the transition toward more sustainable food systems, including increased production and consumption of plant-based foods. These dietary shifts, combined with strong consumer interest in sustainable food choices, are creating strong demand for plant-derived protein ingredients across food, beverage, and nutrition applications.
Growing Health and Wellness Awareness
Rising health consciousness is another major trend driving the growth of plant-based proteins. Consumers are increasingly seeking foods that support long-term health, disease prevention, and overall well-being. Plant-based proteins are often perceived as healthier alternatives to animal proteins due to their lower saturated fat content and the presence of beneficial nutrients such as fiber and phytonutrients.
The growing focus on preventive health is reflected in global public health data. According to the World Health Organization (WHO), non-communicable diseases, such as cardiovascular diseases, diabetes, and obesity, account for approximately 74% of all deaths globally, increasing awareness of the relationship between diet and long-term health outcomes. As a result, consumers are increasingly adopting dietary patterns that emphasize plant-derived foods and reduce consumption of animal fats.
Plant-based proteins are also widely used in functional foods and nutritional supplements. Protein isolates derived from sources such as soy and peas can contain 80–90% protein, making them suitable for high-protein food formulations, sports nutrition products, and specialized dietary products. Research published in the Journal of the International Society of Sports Nutrition has shown that pea protein supplementation can support muscle thickness and strength gains comparable to whey protein during resistance training, further supporting its use in sports nutrition.
In addition, plant-based protein products are increasingly fortified with micronutrients such as vitamin B12, vitamin D, calcium, and iron to enhance their nutritional value and address potential nutrient gaps associated with plant-based diets. These developments, combined with rising consumer interest in functional foods and protein-rich diets, are reinforcing the role of plant-derived proteins in modern health-focused dietary patterns.
Soy Proteins: Dominant Type Segment
Based on type, the global plant-based protein market is segmented into soy proteins, wheat proteins, pea proteins, canola proteins, potato proteins, rice proteins, corn proteins, and other plant-based proteins. In 2026, the soy proteins segment is expected to account for the largest share of the global plant-based protein market. The dominance of soy proteins is primarily attributed to the large-scale global production of soybeans, well-established processing infrastructure, and the high nutritional quality of soy protein.
According to the USDA's World Agricultural Supply and Demand Estimates (WASDE) November 2025 report, global soybean production for the 2025/26 marketing year is forecast to reach around 428 million metric tons, making soybean as one of the most extensively cultivated protein crops globally. Soybeans typically contain 36–40% protein by dry weight, significantly higher than most cereal grains, making them an efficient raw material for plant protein extraction. Soy protein also contains all nine essential amino acids, providing a complete amino acid profile comparable to animal proteins, which has supported its extensive use in food and nutrition applications.
Soy proteins are commercially available in several forms, including soy protein concentrates (typically ~70% protein), soy protein isolates (above 90% protein), and textured soy protein, which is widely used as a structural base in meat alternatives and high-protein food formulations. In addition to nutritional advantages, soy protein benefits from long-established global supply chains and large-scale processing infrastructure, particularly in major soybean-producing countries such as the U.S., Brazil, and Argentina. These factors collectively support the dominant share of soybean across plant-based meat alternatives, dairy alternatives, bakery products, beverages, and nutritional supplements.
Pea Proteins: Fastest-growing Type Segment
The pea proteins market is expected to grow at the fastest CAGR during the forecast period. The growth of the pea protein market is largely driven by its allergen-friendly profile and strong consumer acceptance as a non-soy plant protein alternative. Pea protein is naturally free from major allergens such as dairy, soy, and gluten, making it suitable for a wide range of dietary preferences and food sensitivities.
Yellow peas typically contain 20–25% protein by dry weight, and their protein isolates can reach protein concentrations exceeding 80–85% after fractionation and purification processes. Pea protein also has a relatively high lysine content compared with many cereal proteins, which improves its nutritional value in plant-based food formulations.
Pea proteins are increasingly used in plant-based meat alternatives, dairy alternatives, and sports nutrition products due to their neutral flavor profile and functional properties such as emulsification, water-binding, and gel formation. Improvements in wet fractionation and enzymatic processing technologies have also enhanced the taste and texture performance of pea protein ingredients in recent years, driving their adoption across a broader range of food applications.
Food & Beverage: Dominant Application Segment
Based on application, the global plant-based protein market is segmented into food & beverage, animal feed, nutrition & health supplements, pharmaceuticals, and other applications. In 2026, the food & beverage segment is expected to account for the largest share of the global plant-based protein market. This is primarily driven by the increasing incorporation of plant-based proteins into mainstream food products, including meat alternatives, dairy alternatives, beverages, bakery products, and convenience foods.
Consumer adoption of plant-based foods has increased significantly in recent years. According to the Plant Based Foods Association (PBFA), approximately 70% of U.S. consumers consume plant-based foods, while 62% of U.S. households purchase plant-based food products, indicating the mainstream penetration of plant-based diets. The expanding availability of plant-based foods across retail and foodservice channels has also accelerated demand for plant-derived protein ingredients used in product formulation.
Major food and beverage applications include plant-based meat analogs, plant-based dairy alternatives such as milk, yogurt, and cheese, protein-enriched beverages including ready-to-drink protein shakes, high-protein bakery products, and convenience foods. The growing clean-label movement and increasing consumer interest in sustainable food production are further driving food manufacturers to incorporate plant-based proteins into new product launches.
Nutrition & Health Supplements: Fastest-growing Application Segment
The nutrition & health supplements segment is poised to grow at the fastest CAGR through 2036. This growth is driven by increasing consumer demand for high-protein nutritional products supporting active lifestyles, sports performance, and general health.
Plant-based protein powders and nutritional supplements have gained popularity among athletes and fitness enthusiasts seeking alternatives to traditional whey protein. Research published in the Journal of the International Society of Sports Nutrition has shown that pea protein supplementation can support muscle thickness and strength gains comparable to whey protein during resistance training, thereby driving its adoption in sports nutrition products.
In addition to sports nutrition, plant-based proteins are increasingly used in clinical nutrition and healthy aging applications. Adequate protein intake is considered important for maintaining muscle mass and preventing age-related muscle loss (sarcopenia) among older adults. The expanding availability of plant-based protein powders, ready-to-mix beverages, capsules, and functional foods is further driving the growth of plant-derived protein ingredients in the nutrition and health supplements sector.
North America: Largest Regional Market for Plant-based Protein
North America is expected to account for the largest share of the global plant-based protein market in 2026. This is mainly attributed to its well-established food and beverage industry, strong product innovation capabilities, and growing consumer adoption of plant-based foods. According to the Plant Based Foods Association (PBFA), approximately 70% of U.S. consumers consume plant-based foods, while 62% of U.S. households purchase plant-based food products, reflecting significant penetration of plant-based diets across the region.
In addition, plant-based foods have rapidly expanded across the foodservice sector, with 48% of U.S. restaurants offering plant-based menu options, further driving consumer adoption and product visibility. Strong consumer interest in health, sustainability, and alternative protein sources has encouraged food manufacturers and ingredient suppliers to expand their plant-based product portfolios. The region also hosts several leading plant-protein ingredient manufacturers, such as Archer-Daniels-Midland Company, Cargill, Ingredion Incorporated, CHS Inc., Axiom Foods Inc., and AMCO Protein, which continue to invest in innovation and production capacity to meet growing demand.
Asia-Pacific: Fastest-growing Regional Market for Plant-based Protein Market
The Asia-Pacific plant-based protein market is expected to grow at the fastest CAGR during the forecast period. The growth of this market in the region is driven by rising health awareness, growing food processing industries, and increasing demand for protein-rich diets among rapidly urbanizing populations. The region also benefits from a large base of consumers already following plant-forward diets. India, for example, has one of the lowest meat consumption rates globally and a significant vegetarian population, which naturally supports demand for plant-derived protein ingredients.
China and Southeast Asia are also emerging as key markets for plant-based protein due to the rapid expansion of packaged food manufacturing and increasing consumer awareness of nutrition and sustainability. Government dietary recommendations encouraging greater consumption of plant-derived foods and legumes are further driving the adoption of plant-protein. Additionally, the rapid growth of functional foods, plant-based beverages, and nutritional supplements across Japan, South Korea, Australia, and Southeast Asian economies is creating strong demand for plant-based protein ingredients across the region.
Europe: Sustainability-Driven Market Growth
Europe is the second-largest market for plant-based proteins, driven by strong consumer awareness of sustainability, environmental concerns, and growing adoption of plant-based diets. According to global dietary surveys, approximately 1.5 billion people worldwide avoid meat or significantly reduce meat consumption, with Europe representing one of the most active regions in the transition toward plant-forward diets.
The growing popularity of vegan diets is also contributing to the growth of this market. Participation in the global Veganuary campaign reached approximately 25.8 million people in 2025, highlighting the increasing consumer interest in plant-based diets across Europe and other regions. European consumers are also highly responsive to sustainability messaging; surveys indicate that 77% of consumers consider sustainability an important factor when choosing food products, which strongly drives the adoption of plant-based ingredients.
Europe also hosts several major plant-protein ingredient suppliers, including Roquette Frères, Cosucra Groupe Warcoing SA, Crespel & Deiters GmbH & Co. KG, and BENEO GmbH, which contribute to the region’s leadership in plant protein innovation, ingredient processing technologies, and product development for plant-based foods.
The global plant-based protein market is characterized by strong competition among large agricultural processors, ingredient manufacturers, and specialized plant-protein innovators. The companies are focusing on expansions, strategic partnerships, product innovation, and investments in advanced protein extraction technologies to strengthen their market positions. Increasing demand for plant-based foods and meat alternatives has intensified competition, driving companies to expand their portfolios across soy, pea, wheat, and emerging plant protein sources.
Archer-Daniels-Midland Company and Cargill, Incorporated are among the largest suppliers of plant-based protein ingredients globally, with their diversified protein portfolios and large-scale production capabilities. Roquette Frères is widely recognized as a leading innovator in pea protein ingredients through its NUTRALYS product portfolio and significant investments in pea protein production capacity. Ingredion Incorporated continues to expand its plant-based ingredient capabilities through investments in protein processing and strategic collaborations to strengthen supply networks.
Companies such as Kerry Group plc, International Flavors & Fragrances, Inc., and Tate & Lyle Plc focus on delivering integrated ingredient solutions that combine plant proteins with functional ingredients, flavors, and texture systems to support plant-based food formulation. BENEO GmbH, Cosucra Groupe Warcoing SA, and Sotexpro specialize in plant-based protein ingredients derived from pulses and cereals, including pea, wheat, and fava bean proteins.
Other important companies include Axiom Foods Inc., AMCO Protein, Burcon NutraScience Corporation, Farbest-Tallman Foods Corporation, Crespel & Deiters GmbH & Co. KG, Wilmar International, CHS Inc., Glico Nutrition Co., Ltd, Glanbia Plc, and Now Health Group, Inc., among others.
Plant-based Protein Market Assessment by Type
Plant-based Protein Market Assessment - by Form
Plant-based Protein Market Assessment - by Source Process
Plant-based Protein Market Assessment - by Application
Plant-based Protein Market Assessment - by Geography
The global plant-based protein market was valued at USD 20.32 billion in 2025 and is projected to reach USD 22.03 billion in 2026. The market is expected to reach USD 47.93 billion by 2036, growing at a CAGR of 8.1% during the forecast period 2026–2036.
The pea protein segment is expected to register the highest CAGR during the forecast period, driven by its allergen-free nature, non-GMO positioning, improved taste and texture through advanced processing technologies, and increasing consumer preference for non-soy protein alternatives.
The nutrition & health supplements segment is expected to register the highest CAGR during the forecast period, driven by rising adoption of plant proteins in sports nutrition, functional foods, and dietary supplements.
The food & beverage segment is expected to account for the largest share of the global plant-based protein market in 2026, driven by increasing use of plant proteins in meat alternatives, dairy alternatives, bakery products, beverages, and ready-to-eat foods.
The key drivers include rising demand for protein-rich diets, increasing consumer interest in plant-based foods, growing health and wellness awareness, expanding demand for meat alternatives, and rising adoption of plant proteins in food and beverage formulations.
Major restraints include consumer preference for animal-based proteins in certain markets and fluctuating raw material prices for crops such as soybeans, peas, and wheat, which can affect production costs and supply stability.
Key opportunities include growing demand in emerging economies, rising adoption of plant-based diets, increasing demand for allergen-free protein ingredients, and expanding innovation in alternative plant protein sources.
Asia-Pacific is expected to register the highest CAGR during the forecast period, driven by growing health awareness, expanding food processing industries, rising disposable incomes, and increasing adoption of plant-based diets. North America is expected to remain the largest regional market.
Key companies operating in the market include Archer-Daniels-Midland Company, Cargill Incorporated, Roquette Frères, Ingredion Incorporated, Kerry Group plc, International Flavors & Fragrances Inc., Tate & Lyle Plc, Axiom Foods Inc., AMCO Protein, Burcon NutraScience Corporation, BENEO GmbH, Glico Nutrition Co., Ltd., Glanbia Plc, Cosucra Groupe Warcoing SA, Sotexpro, Farbest-Tallman Foods Corporation, Crespel & Deiters GmbH & Co. KG, Wilmar International, and CHS Inc.
Key trends include increasing adoption of vegan, vegetarian, and flexitarian diets; expansion of private label plant-based products; development of novel plant protein sources; and advancements in plant protein processing technologies.


Published Date: Mar-2026
Published Date: Jan-2025
Published Date: Jan-2025
Published Date: Jan-2025
Please enter your corporate email id here to view sample report.
Subscribe to get the latest industry updates