Resources
About Us
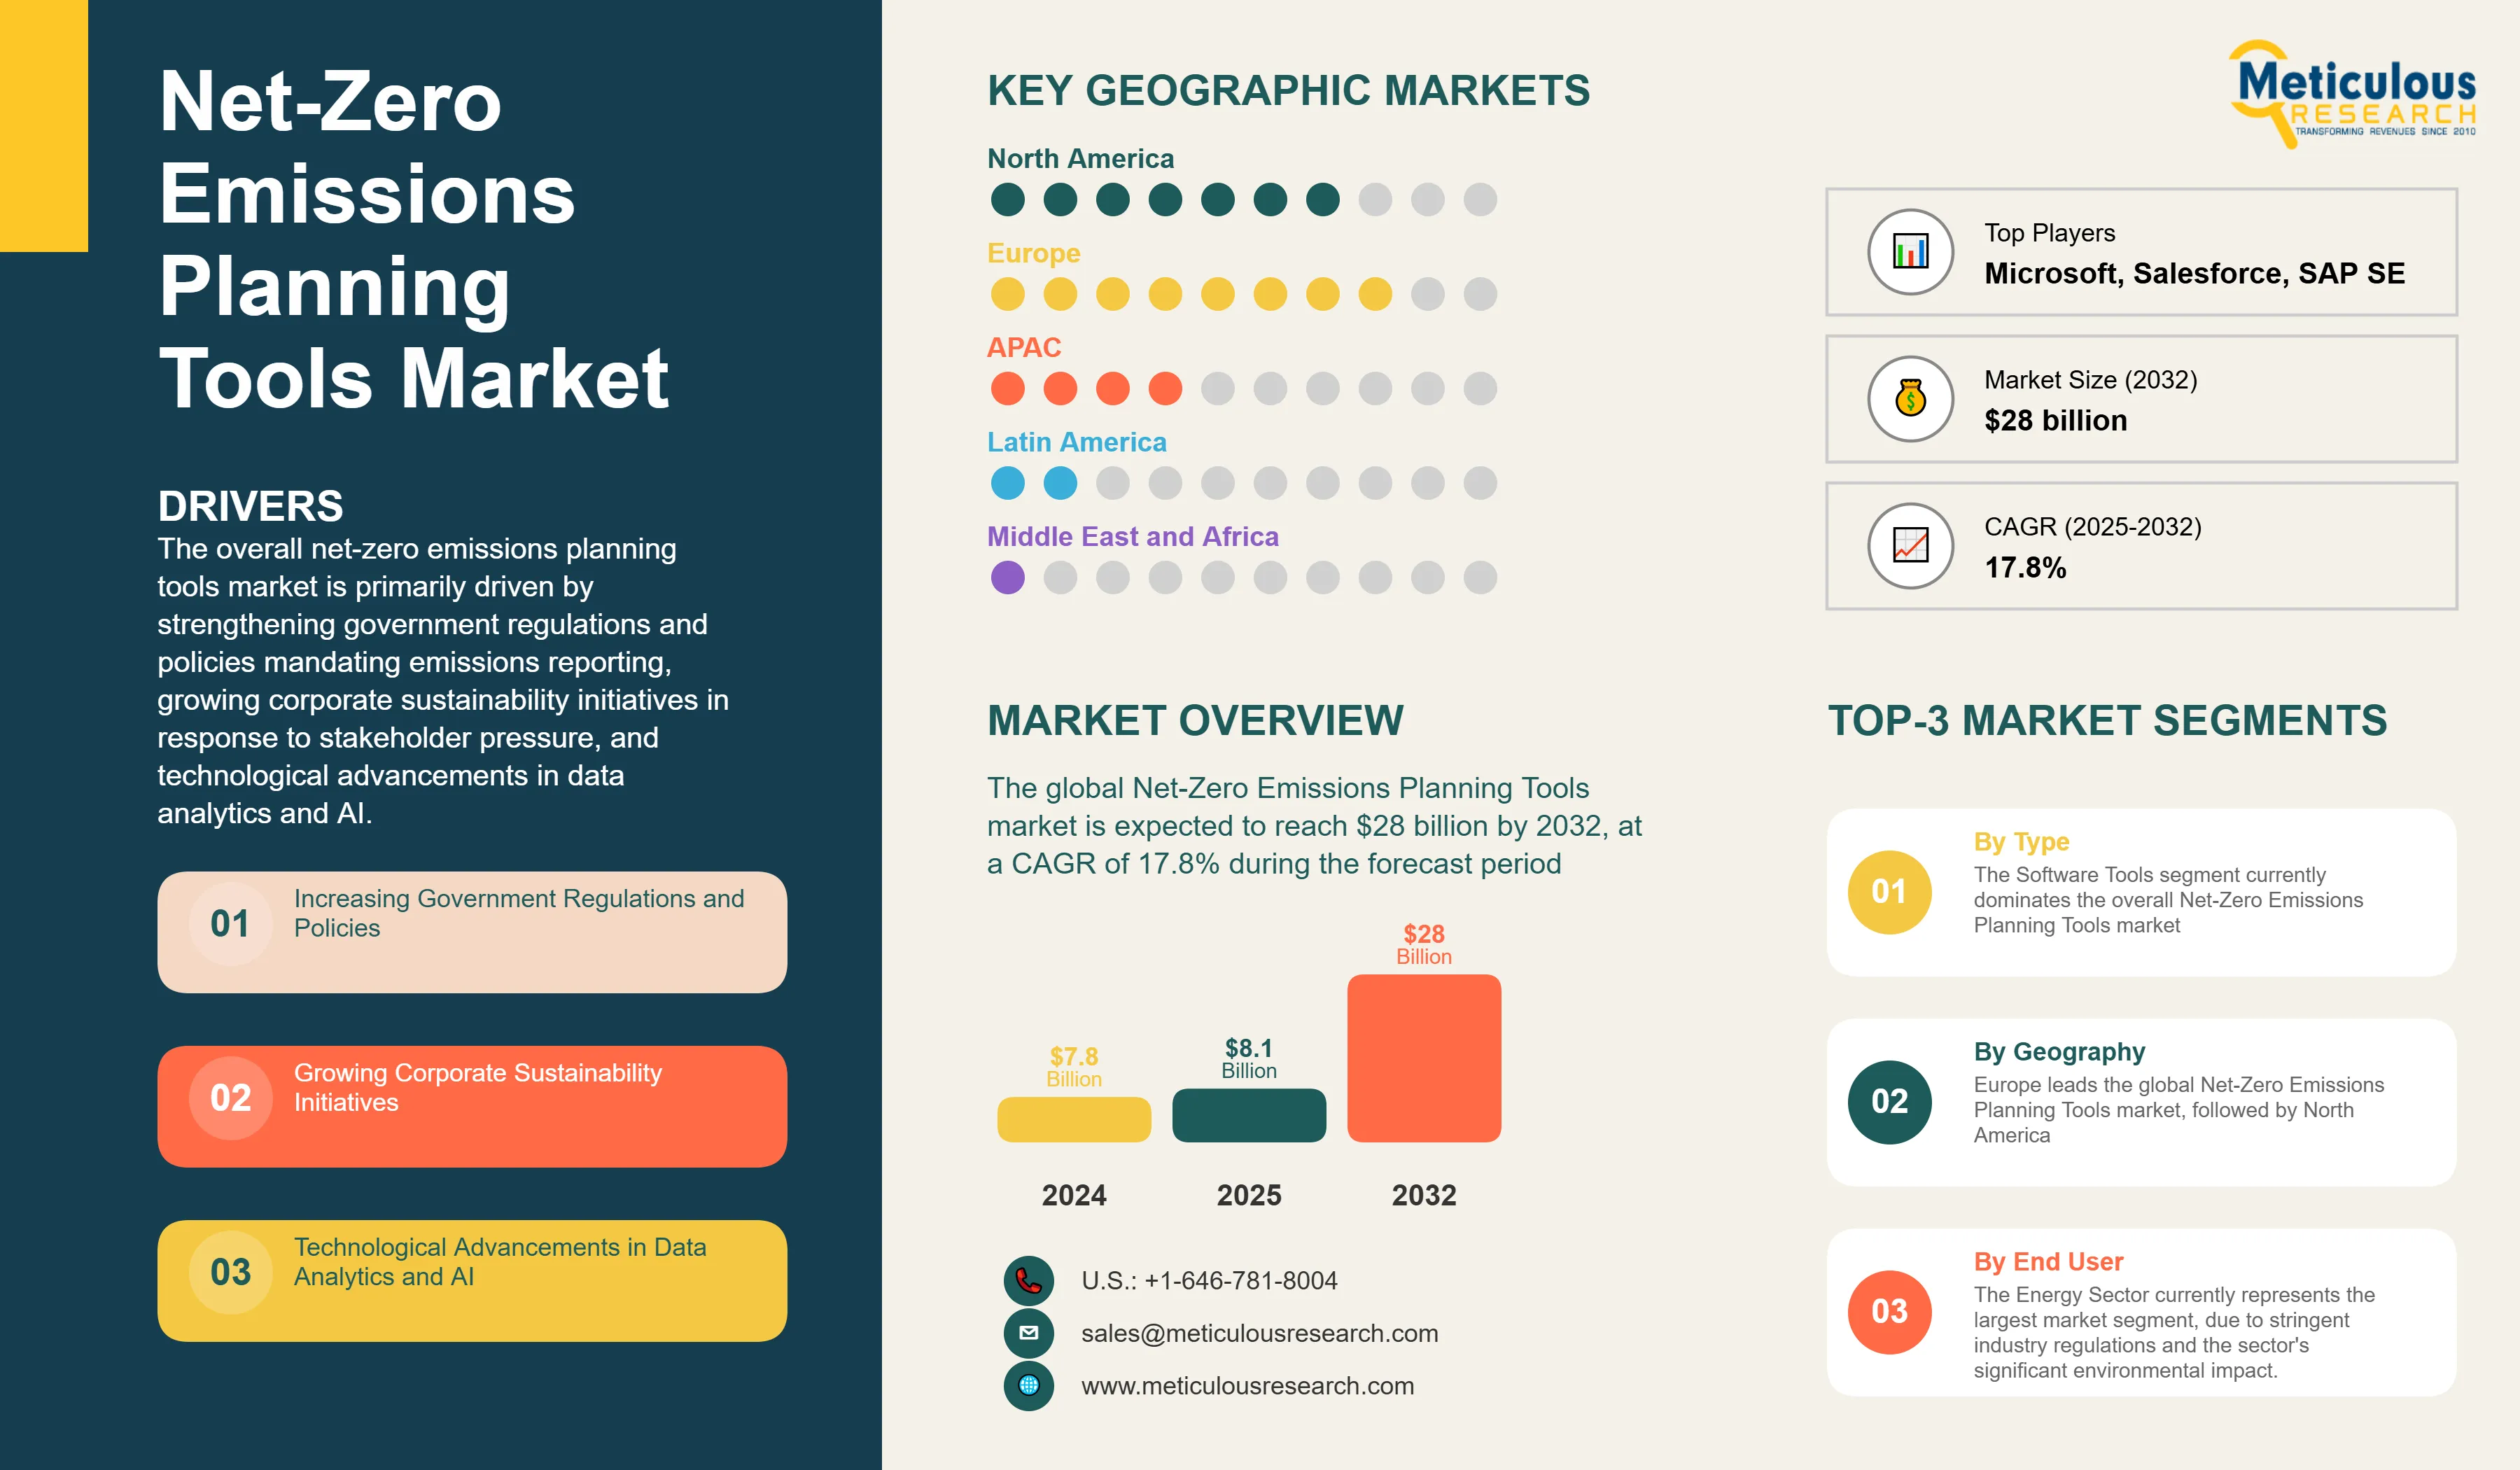
The global Net-Zero Emissions Planning Tools market was valued at $7.8 billion in 2024. This market is expected to reach $28 billion by 2032, growing from $8.1 billion in 2025, at a CAGR of 17.8% during the forecast period of 2025–2032. The growth of the market is driven by increasing regulatory pressures, growing corporate sustainability initiatives, technological advancements in data analytics and AI, and rising awareness of climate change risks among organizations worldwide.
This comprehensive market research report analyzes the rapidly evolving Net-Zero Emissions Planning Tools market, evaluating how software solutions and services are enabling organizations to plan, track, and achieve their carbon reduction goals. The report provides a strategic analysis of market dynamics, growth projections till 2032, and competitive positioning across global and regional markets.
Market Dynamics Overview
Key Market Drivers & Trends and Insights
Click here to: Get Free Sample Pages of this Report
The overall net-zero emissions planning tools market is primarily driven by strengthening government regulations and policies mandating emissions reporting, growing corporate sustainability initiatives in response to stakeholder pressure, and technological advancements in data analytics and AI. The increasing use of AI and machine learning is transforming the landscape by enabling more accurate emissions forecasting and scenario planning. Cloud-based solutions are gaining significant traction due to their scalability and accessibility, while there is growing focus on Scope 3 emissions accounting as organizations recognize the importance of addressing their entire value chain impact. The integration of these tools with existing enterprise systems is becoming increasingly important for seamless operations.
Key Challenges
Despite growth prospects, the overall net-zero emissions planning tools market faces challenges including high implementation costs creating barriers particularly for small and medium enterprises, complexity of data collection and modeling across diverse operations, lack of standardized methodologies hampering comparability of results, data availability and accuracy issues especially for Scope 3 emissions, and an evolving regulatory landscape requiring continuous updates to maintain compliance.
Growth Opportunities
The Net-Zero Emissions Planning Tools market offers several high-growth opportunities. Development of more user-friendly platforms will expand the potential user base beyond sustainability experts. Integration capabilities with existing energy and enterprise management systems represent a significant opportunity to add value and improve user adoption. The expansion of services to small and medium enterprises through more accessible pricing models and simplified solutions can tap into a largely underserved market segment. Additionally, enhanced focus on industry-specific solutions tailored to the unique challenges of sectors like manufacturing, transportation, or construction offers substantial growth potential. Lastly, the development of predictive analytics capabilities that can forecast future emissions based on business growth scenarios will provide a significant competitive advantage to solution providers.
Market Segmentation Highlights
By Type
The Software Tools segment currently dominates the overall Net-Zero Emissions Planning Tools market, with Carbon Footprint Calculation Software representing the largest subsegment due to its foundational role in emissions management. Energy Management Software is also widely adopted for its direct operational benefits in cost reduction. However, Scenario Planning and Modeling Tools are projected to grow at the highest CAGR through 2032 as organizations move beyond measurement to strategic planning for emissions reduction. The Services segment, particularly Implementation and Integration Services, is witnessing robust growth as organizations seek expertise to effectively deploy and utilize complex emissions management tools.
By End User
The Energy Sector currently represents the largest market segment, due to stringent industry regulations and the sector's significant environmental impact. The Manufacturing Sector follows closely as the second-largest segment, driven by complex supply chains and energy-intensive operations requiring sophisticated emissions management. However, the Transportation and Logistics segment is anticipated to show the highest growth rate during the forecast period, primarily due to increasing pressure to decarbonize fleets and operations amidst tightening emissions regulations globally. The Government and Public Sector segment is also experiencing significant growth as public institutions face increasing pressure to lead by example in climate initiatives and meet national reduction targets.
By Geography
Europe leads the global Net-Zero Emissions Planning Tools market, followed by North America. The largest share of this region is mainly due to stringent EU regulations on emissions reporting, ambitious climate targets, and high corporate sustainability awareness. Germany represents the largest market in Europe, while the U.S. leads adoption in North America. However, the Asia-Pacific region, particularly China and Japan, is projected to witness the highest CAGR during the forecast period 2025-2032, driven by strengthening environmental regulations, large-scale industrial decarbonization initiatives, and increasing corporate sustainability commitments from multinational and domestic companies. The Middle East & Africa region shows promising growth potential as countries diversify from fossil fuel dependencies and embrace sustainable development goals.
Competitive Landscape
The global Net-Zero Emissions Planning Tools market features a diverse competitive landscape with established enterprise software providers competing alongside specialized sustainability solution providers and emerging startups.
The market is characterized by increasing consolidation through strategic acquisitions as larger enterprise software providers seek to enhance their sustainability offerings. Major players are developing industry-specific solutions to address unique sectoral challenges and expanding AI capabilities to provide predictive insights. As the market evolves, key companies will need to address data integration challenges, enhance user experience for non-technical users, and provide more sophisticated scenario modeling capabilities to maintain competitive advantage.
|
Particulars |
Details |
|
Number of Pages |
187 |
|
Format |
PDF & Excel |
|
Forecast Period |
2025–2032 |
|
Base Year |
2024 |
|
CAGR (Value) |
17.8% |
|
Market Size (Value)in 2025 |
USD 8.1 Billion |
|
Market Size (Value) in 2032 |
USD 28 Billion |
|
Segments Covered |
Market Assessment, by Type
Market Assessment, by End User
|
|
Countries Covered |
|
|
Key Companies |
Enterprise Software Providers: Microsoft, Salesforce, SAP SE, IBM, Oracle Specialized Solution Providers: Schneider Electric, Siemens, Sphera, Persefoni AI Inc., Watershed Technologies, Inc., ENGIE Impact, Carbon Accounting Tools, Inc., Enablon (Wolters Kluwer), FigBytes |
The Net-Zero Emissions Planning Tools market is estimated to be valued at $8.1 billion in 2025 and is projected to reach USD 28 billion by 2032, at a CAGR of 17.8%.
The Net-Zero Emissions Planning Tools market is projected to reach $28 billion by 2032, at a CAGR of 17.8% from 2025.
The Net-Zero Emissions Planning Tools market analysis indicates substantial growth, with projections indicating that the market will reach $28 billion by 2032, at a CAGR of 17.8% from 2025 to 2032.
The key companies operating in this market include Microsoft, Salesforce, SAP SE, IBM, Oracle, Schneider Electric, Siemens, Sphera, Persefoni AI Inc., Watershed Technologies, Inc., ENGIE Impact, Carbon Accounting Tools, Inc., Enablon (Wolters Kluwer), and FigBytes among others.
Major trends shaping the market include increasing use of AI and machine learning for emissions forecasting, growing demand for cloud-based solutions, focus on Scope 3 emissions accounting, and integration with existing enterprise management systems.
• In 2025, the Energy Sector end user segment is expected to account for the largest share of the Net-Zero Emissions Planning Tools market.
• On the basis of type, Software Tools hold the largest share of the overall Net-Zero Emissions Planning Tools market in 2025, with Carbon Footprint Calculation Software being the dominant subsegment.
• The Transportation and Logistics segment is projected to grow at the highest CAGR from 2025 to 2032.
• Scenario Planning and Modeling Tools within the Software Tools segment are expected to grow at the highest CAGR during the forecast period.
Europe leads the global Net-Zero Emissions Planning Tools market, followed by North America, due to stringent regulations, ambitious climate targets, and high corporate sustainability awareness. However, the Asia-Pacific region is projected to grow at the highest CAGR during the forecast period.
The growth of this market is driven by increasing government regulations and policies mandating emissions reporting, growing corporate sustainability initiatives, technological advancements in data analytics and AI, and rising awareness of climate change risks among organizations worldwide
1. Market Definition & Scope
1.1. Market Definition
1.2. Market Ecosystem
1.3. Currency
1.4. Key Stakeholders
2. Research Methodology
2.1. Research Approach
2.2. Process of Data Collection and Validation
2.2.1. Secondary Research
2.2.2. Primary Research/Interviews with Key Opinion Leaders from the Industry
2.3. Market Sizing and Forecast
2.3.1. Market Size Estimation Approach
2.3.1.1. Bottom-up Approach
2.3.1.2. Top-down Approach
2.3.2. Growth Forecast Approach
2.4. Assumptions for the Study
3. Executive Summary
3.1. Overview
3.2. Segmental Analysis
3.2.1. Net-Zero Emissions Planning Tools Market, by Type
3.2.2. Net-Zero Emissions Planning Tools Market, by End-User
3.2.3. Net-Zero Emissions Planning Tools Market, by Region
3.3. Competitive Landscape
4. Market Insights
4.1. Overview
4.2. Factors Affecting Market Growth
4.2.1. Drivers
4.2.1.1. Increasing Government Regulations and Policies
4.2.1.2. Growing Corporate Sustainability Initiatives
4.2.1.3. Technological Advancements in Data Analytics and AI
4.2.1.4. Rising Awareness of Climate Change Risks
4.2.2. Restraints
4.2.2.1. High Implementation Costs
4.2.2.2. Complexity of Data and Modeling
4.2.2.3. Lack of Standardized Methodologies
4.2.3. Opportunities
4.2.3.1. Development of User-Friendly Platforms
4.2.3.2. Integration with Existing Energy Management Systems
4.2.3.3. Expansion of Services to SMEs
4.2.4. Trends
4.2.4.1. Increasing Use of AI and Machine Learning
4.2.4.2. Growing Demand for Cloud-Based Solutions
4.2.4.3. Focus on Scope 3 Emissions Accounting
4.2.5. Challenges
4.2.5.1. Data Availability and Accuracy
4.2.5.2. Maintaining Software Compatibility
4.2.5.3. Evolving Regulatory Landscape
4.3. Porter’s Five Forces Analysis
4.3.1. Bargaining Power of Suppliers
4.3.2. Bargaining Power of Buyers
4.3.3. Threat of Substitutes
4.3.4. Threat of New Entrants
4.3.5. Degree of Competition
4.4. Impact of Sustainability on the Net-Zero Emissions Planning Tools Market
4.4.1. Consumer Behavior and Market Demand
4.4.2. Product Development and Innovation
4.4.3. Circular Economy Business Models
4.4.4. Regulatory Landscape and Compliance
4.4.5. Manufacturing and Supply Chain Transformation
4.5. Technological Challenges and Solutions
4.6. Future Outlook and Strategic Implications
5. Net-Zero Emissions Planning Tools Market Assessment—by Type
5.1. Overview
5.2. Software Tools
5.2.1. Carbon Footprint Calculation Software
5.2.2. Energy Management Software
5.2.3. GHG Emissions Tracking Software
5.2.4. Scenario Planning and Modeling Tools
5.2.5. Life Cycle Assessment (LCA) Software
5.3. Services
5.3.1. Consulting Services
5.3.2. Implementation and Integration Services
5.3.3. Training and Support Services
5.3.4. Verification and Auditing Services
6. Net-Zero Emissions Planning Tools Market Assessment—by End User
6.1. Overview
6.1.1. Energy Sector
6.1.2. Manufacturing Sector
6.1.3. Transportation and Logistics
6.1.4. Buildings and Construction
6.1.5. IT and Telecommunications
6.1.6 Government and Public Sector
6.1.7. National Governments
6.1.8. Regional and Local Governments
6.1.9. Public Utilities
6.1.10 Others
7. Net-Zero Emissions Planning Tools Market Assessment—by Geography
7.1. Overview
7.2. North America
7.2.1. U.S.
7.2.2. Canada
7.3. Europe
7.3.1. Germany
7.3.2. France
7.3.3. U.K.
7.3.4. Rest of Europe (RoE)
7.4. Asia-Pacific
7.4.1. China
7.4.2. Japan
7.4.3. India
7.4.4. Rest of Asia-Pacific (RoAPAC)
7.5. Latin America
7.5.1. Brazil
7.5.2. Mexico
7.5.3. Rest of Latin America (RoLATAM)
7.6. Middle East & Africa
7.6.1. Saudi Arabia
7.6.2. South Africa
7.6.3. Rest of Middle East & Africa (RoMEA)
8. Competitive Landscape
8.1. Overview
8.2. Key Growth Strategies
8.3. Competitive Benchmarking
8.4. Competitive Dashboard
8.5. Industry Leaders
8.6. Market Differentiators
8.7. Vanguards
8.8. Contemporary Stalwarts
8.9. Market Share/Ranking Analysis, by the Key Players
9. Company Profiles (Business Overview, Financial Overview, Product Portfolio, Strategic Developments, and SWOT Analysis)
9.1. ENGIE Impact
9.2. Schneider Electric
9.3. Siemens
9.4. Sphera
9.5. Carbon Accounting Tools, Inc.
9.6. Salesforce
9.7. Microsoft
9.8. SAP SE
9.9. IBM
9.10. Oracle
9.11. Enablon (Wolters Kluwer)
9.12. FigBytes
9.13. Persefoni AI Inc.
9.14. Watershed Technologies, Inc.
10. Appendix
10.1. Available Customization
10.2. Related Reports
List of Tables
Global Market Overview
Table 1: Global Net-Zero Emissions Planning Tools Market, 2023-2032 (USD Million)
Table 2: Global Net-Zero Emissions Planning Tools Market, by Type, 2023-2032 (USD Million)
Table 3: Global Net-Zero Emissions Planning Tools Market, by End-User, 2023-2032 (USD Million)
Table 4: Global Net-Zero Emissions Planning Tools Market, by Region/Country, 2023-2032 (USD Million)
Type Segment
Table 5: Global Software Tools Market, by Region/Country, 2023-2032 (USD Million)
Table 6: Global Carbon Footprint Calculation Software Market, by Region/Country, 2023-2032 (USD Million)
Table 7: Global Energy Management Software Market, by Region/Country, 2023-2032 (USD Million)
Table 8: Global GHG Emissions Tracking Software Market, by Region/Country, 2023-2032 (USD Million)
Table 9: Global Scenario Planning and Modeling Tools Market, by Region/Country, 2023-2032 (USD Million)
Table 10: Global Life Cycle Assessment (LCA) Software Market, by Region/Country, 2023-2032 (USD Million)
Table 11: Global Services Market, by Region/Country, 2023-2032 (USD Million)
Table 12: Global Consulting Services Market, by Region/Country, 2023-2032 (USD Million)
Table 13: Global Implementation and Integration Services Market, by Region/Country, 2023-2032 (USD Million)
Table 14: Global Training and Support Services Market, by Region/Country, 2023-2032 (USD Million)
Table 15: Global Verification and Auditing Services Market, by Region/Country, 2023-2032 (USD Million)
End-User Segment
Table 16: Global Net-Zero Emissions Planning Tools Market for Energy Sector, by Region/Country, 2023-2032 (USD Million)
Table 17: Global Net-Zero Emissions Planning Tools Market for Manufacturing Sector, by Region/Country, 2023-2032 (USD Million)
Table 18: Global Net-Zero Emissions Planning Tools Market for Transportation and Logistics, by Region/Country, 2023-2032 (USD Million)
Table 19: Global Net-Zero Emissions Planning Tools Market for Buildings and Construction, by Region/Country, 2023-2032 (USD Million)
Table 20: Global Net-Zero Emissions Planning Tools Market for IT and Telecommunications, by Region/Country, 2023-2032 (USD Million)
Table 21: Global Net-Zero Emissions Planning Tools Market for Government and Public Sector, by Region/Country, 2023-2032 (USD Million)
Table 22: Global Net-Zero Emissions Planning Tools Market for National Governments, by Region/Country, 2023-2032 (USD Million)
Table 23: Global Net-Zero Emissions Planning Tools Market for Regional and Local Governments, by Region/Country, 2023-2032 (USD Million)
Table 24: Global Net-Zero Emissions Planning Tools Market for Public Utilities, by Region/Country, 2023-2032 (USD Million)
Table 25: Global Net-Zero Emissions Planning Tools Market for Others, by Region/Country, 2023-2032 (USD Million)
North America Market
Table 26: North America Net-Zero Emissions Planning Tools Market, 2023-2032 (USD Million)
Table 27: North America Net-Zero Emissions Planning Tools Market, by Type, 2023-2032 (USD Million)
Table 28: North America Net-Zero Emissions Planning Tools Market, by End-User, 2023-2032 (USD Million)
Table 29: North America Net-Zero Emissions Planning Tools Market, by Country, 2023-2032 (USD Million)
U.S. Market
Table 30: U.S. Net-Zero Emissions Planning Tools Market, 2023-2032 (USD Million)
Table 31: U.S. Net-Zero Emissions Planning Tools Market, by Type, 2023-2032 (USD Million)
Table 32: U.S. Net-Zero Emissions Planning Tools Market, by End-User, 2023-2032 (USD Million)
Canada Market
Table 33: Canada Net-Zero Emissions Planning Tools Market, 2023-2032 (USD Million)
Table 34: Canada Net-Zero Emissions Planning Tools Market, by Type, 2023-2032 (USD Million)
Table 35: Canada Net-Zero Emissions Planning Tools Market, by End-User, 2023-2032 (USD Million)
Europe Market
Table 36: Europe Net-Zero Emissions Planning Tools Market, 2023-2032 (USD Million)
Table 37: Europe Net-Zero Emissions Planning Tools Market, by Type, 2023-2032 (USD Million)
Table 38: Europe Net-Zero Emissions Planning Tools Market, by End-User, 2023-2032 (USD Million)
Table 39: Europe Net-Zero Emissions Planning Tools Market, by Country, 2023-2032 (USD Million)
Germany Market
Table 40: Germany Net-Zero Emissions Planning Tools Market, 2023-2032 (USD Million)
Table 41: Germany Net-Zero Emissions Planning Tools Market, by Type, 2023-2032 (USD Million)
Table 42: Germany Net-Zero Emissions Planning Tools Market, by End-User, 2023-2032 (USD Million)
France Market
Table 43: France Net-Zero Emissions Planning Tools Market, 2023-2032 (USD Million)
Table 44: France Net-Zero Emissions Planning Tools Market, by Type, 2023-2032 (USD Million)
Table 45: France Net-Zero Emissions Planning Tools Market, by End-User, 2023-2032 (USD Million)
U.K. Market
Table 46: U.K. Net-Zero Emissions Planning Tools Market, 2023-2032 (USD Million)
Table 47: U.K. Net-Zero Emissions Planning Tools Market, by Type, 2023-2032 (USD Million)
Table 48: U.K. Net-Zero Emissions Planning Tools Market, by End-User, 2023-2032 (USD Million)
Rest of Europe Market
Table 49: Rest of Europe Net-Zero Emissions Planning Tools Market, 2023-2032 (USD Million)
Table 50: Rest of Europe Net-Zero Emissions Planning Tools Market, by Type, 2023-2032 (USD Million)
Table 51: Rest of Europe Net-Zero Emissions Planning Tools Market, by End-User, 2023-2032 (USD Million)
Asia-Pacific Market
Table 52: Asia-Pacific Net-Zero Emissions Planning Tools Market, 2023-2032 (USD Million)
Table 53: Asia-Pacific Net-Zero Emissions Planning Tools Market, by Type, 2023-2032 (USD Million)
Table 54: Asia-Pacific Net-Zero Emissions Planning Tools Market, by End-User, 2023-2032 (USD Million)
Table 55: Asia-Pacific Net-Zero Emissions Planning Tools Market, by Country, 2023-2032 (USD Million)
China Market
Table 56: China Net-Zero Emissions Planning Tools Market, 2023-2032 (USD Million)
Table 57: China Net-Zero Emissions Planning Tools Market, by Type, 2023-2032 (USD Million)
Table 58: China Net-Zero Emissions Planning Tools Market, by End-User, 2023-2032 (USD Million)
Japan Market
Table 59: Japan Net-Zero Emissions Planning Tools Market, 2023-2032 (USD Million)
Table 60: Japan Net-Zero Emissions Planning Tools Market, by Type, 2023-2032 (USD Million)
Table 61: Japan Net-Zero Emissions Planning Tools Market, by End-User, 2023-2032 (USD Million)
India Market
Table 62: India Net-Zero Emissions Planning Tools Market, 2023-2032 (USD Million)
Table 63: India Net-Zero Emissions Planning Tools Market, by Type, 2023-2032 (USD Million)
Table 64: India Net-Zero Emissions Planning Tools Market, by End-User, 2023-2032 (USD Million)
Rest of Asia-Pacific Market
Table 65: Rest of Asia-Pacific Net-Zero Emissions Planning Tools Market, 2023-2032 (USD Million)
Table 66: Rest of Asia-Pacific Net-Zero Emissions Planning Tools Market, by Type, 2023-2032 (USD Million)
Table 67: Rest of Asia-Pacific Net-Zero Emissions Planning Tools Market, by End-User, 2023-2032 (USD Million)
Latin America Market
Table 68: Latin America Net-Zero Emissions Planning Tools Market, 2023-2032 (USD Million)
Table 69: Latin America Net-Zero Emissions Planning Tools Market, by Type, 2023-2032 (USD Million)
Table 70: Latin America Net-Zero Emissions Planning Tools Market, by End-User, 2023-2032 (USD Million)
Table 71: Latin America Net-Zero Emissions Planning Tools Market, by Country, 2023-2032 (USD Million)
Brazil Market
Table 72: Brazil Net-Zero Emissions Planning Tools Market, 2023-2032 (USD Million)
Table 73: Brazil Net-Zero Emissions Planning Tools Market, by Type, 2023-2032 (USD Million)
Table 74: Brazil Net-Zero Emissions Planning Tools Market, by End-User, 2023-2032 (USD Million)
Mexico Market
Table 75: Mexico Net-Zero Emissions Planning Tools Market, 2023-2032 (USD Million)
Table 76: Mexico Net-Zero Emissions Planning Tools Market, by Type, 2023-2032 (USD Million)
Table 77: Mexico Net-Zero Emissions Planning Tools Market, by End-User, 2023-2032 (USD Million)
Rest of Latin America Market
Table 78: Rest of Latin America Net-Zero Emissions Planning Tools Market, 2023-2032 (USD Million)
Table 79: Rest of Latin America Net-Zero Emissions Planning Tools Market, by Type, 2023-2032 (USD Million)
Table 80: Rest of Latin America Net-Zero Emissions Planning Tools Market, by End-User, 2023-2032 (USD Million)
Middle East & Africa Market
Table 81: Middle East & Africa Net-Zero Emissions Planning Tools Market, 2023-2032 (USD Million)
Table 82: Middle East & Africa Net-Zero Emissions Planning Tools Market, by Type, 2023-2032 (USD Million)
Table 83: Middle East & Africa Net-Zero Emissions Planning Tools Market, by End-User, 2023-2032 (USD Million)
Table 84: Middle East & Africa Net-Zero Emissions Planning Tools Market, by Country, 2023-2032 (USD Million)
Saudi Arabia Market
Table 85: Saudi Arabia Net-Zero Emissions Planning Tools Market, 2023-2032 (USD Million)
Table 86: Saudi Arabia Net-Zero Emissions Planning Tools Market, by Type, 2023-2032 (USD Million)
Table 87: Saudi Arabia Net-Zero Emissions Planning Tools Market, by End-User, 2023-2032 (USD Million)
South Africa Market
Table 88: South Africa Net-Zero Emissions Planning Tools Market, 2023-2032 (USD Million)
Table 89: South Africa Net-Zero Emissions Planning Tools Market, by Type, 2023-2032 (USD Million)
Table 90: South Africa Net-Zero Emissions Planning Tools Market, by End-User, 2023-2032 (USD Million)
Rest of Middle East & Africa Market
Table 91: Rest of Middle East & Africa Net-Zero Emissions Planning Tools Market, 2023-2032 (USD Million)
Table 92: Rest of Middle East & Africa Net-Zero Emissions Planning Tools Market, by Type, 2023-2032 (USD Million)
Table 93: Rest of Middle East & Africa Net-Zero Emissions Planning Tools Market, by End-User, 2023-2032 (USD Million)
List of Figures
Figure 1: Global Net-Zero Emissions Planning Tools Market Size, 2023-2032 (USD Million)
Figure 2: Global Net-Zero Emissions Planning Tools Market Growth, Y-o-Y % Growth, 2025-2032
Figure 3: Global Net-Zero Emissions Planning Tools Market, by Type, 2025 vs. 2032 (%)
Figure 4: Global Net-Zero Emissions Planning Tools Market, by End-User, 2025 vs. 2032 (%)
Figure 5: Global Net-Zero Emissions Planning Tools Market, by Region/Country, 2025 vs. 2032 (%)
Figure 6: Impact Assessment of Market Drivers on Global Net-Zero Emissions Planning Tools Market (2025-2032)
Figure 7: Impact Assessment of Market Restraints on Global Net-Zero Emissions Planning Tools Market (2025-2032)
Figure 8: Impact Assessment of Market Opportunities on Global Net-Zero Emissions Planning Tools Market (2025-2032)
Figure 9: Porter's Five Forces Analysis: Global Net-Zero Emissions Planning Tools Market
Figure 10: Carbon Emissions Reduction Targets by Geography, 2024
Figure 11: Key Regulatory Frameworks for Net-Zero Emissions by Region
Figure 12: ESG Investment Trends Related to Net-Zero Commitments, 2022-2025
Figure 13: Technology Adoption Framework for Net-Zero Implementation
Figure 14: Carbon Pricing Mechanisms and Their Impact on Corporate Strategies
Figure 15: North America Net-Zero Emissions Planning Tools Market Snapshot, 2025-2032 (USD Million)
Figure 16: North America Net-Zero Emissions Planning Tools Market Share, by Country, 2025 vs. 2032 (%)
Figure 17: Europe Net-Zero Emissions Planning Tools Market Snapshot, 2025-2032 (USD Million)
Figure 18: Europe Net-Zero Emissions Planning Tools Market Share, by Country, 2025 vs. 2032 (%)
Figure 19: Asia-Pacific Net-Zero Emissions Planning Tools Market Snapshot, 2025-2032 (USD Million)
Figure 20: Asia-Pacific Net-Zero Emissions Planning Tools Market Share, by Country, 2025 vs. 2032 (%)
Figure 21: Latin America Net-Zero Emissions Planning Tools Market Snapshot, 2025-2032 (USD Million)
Figure 22: Latin America Net-Zero Emissions Planning Tools Market Share, by Country, 2025 vs. 2032 (%)
Figure 23: Middle East & Africa Net-Zero Emissions Planning Tools Market Snapshot, 2025-2032 (USD Million)
Figure 24: Middle East & Africa Net-Zero Emissions Planning Tools Market Share, by Country, 2025 vs. 2032 (%)
Figure 25: Carbon Intensity by Industry Vertical, 2023
Figure 26: Adoption Rate of Net-Zero Emissions Planning Tools by Industry Vertical, 2023
Figure 27: Key Growth Strategies Adopted by Leading Players in the Global Net-Zero Emissions Planning Tools Market, 2021-2025
Figure 28: Global Net-Zero Emissions Planning Tools Market Share Analysis, by Key Player (2024)
Figure 29: Competitive Benchmarking of Key Players in the Global Net-Zero Emissions Planning Tools Market
Figure 30: Competitive Dashboard of the Global Net-Zero Emissions Planning Tools Market
Figure 31: AI and Machine Learning Implementation in Net-Zero Emissions Planning, 2022-2025
Figure 32: Cloud vs. On-premise Solutions Adoption Trends, 2023-2028


Published Date: May-2025
Subscribe to get the latest industry updates