Resources
About Us
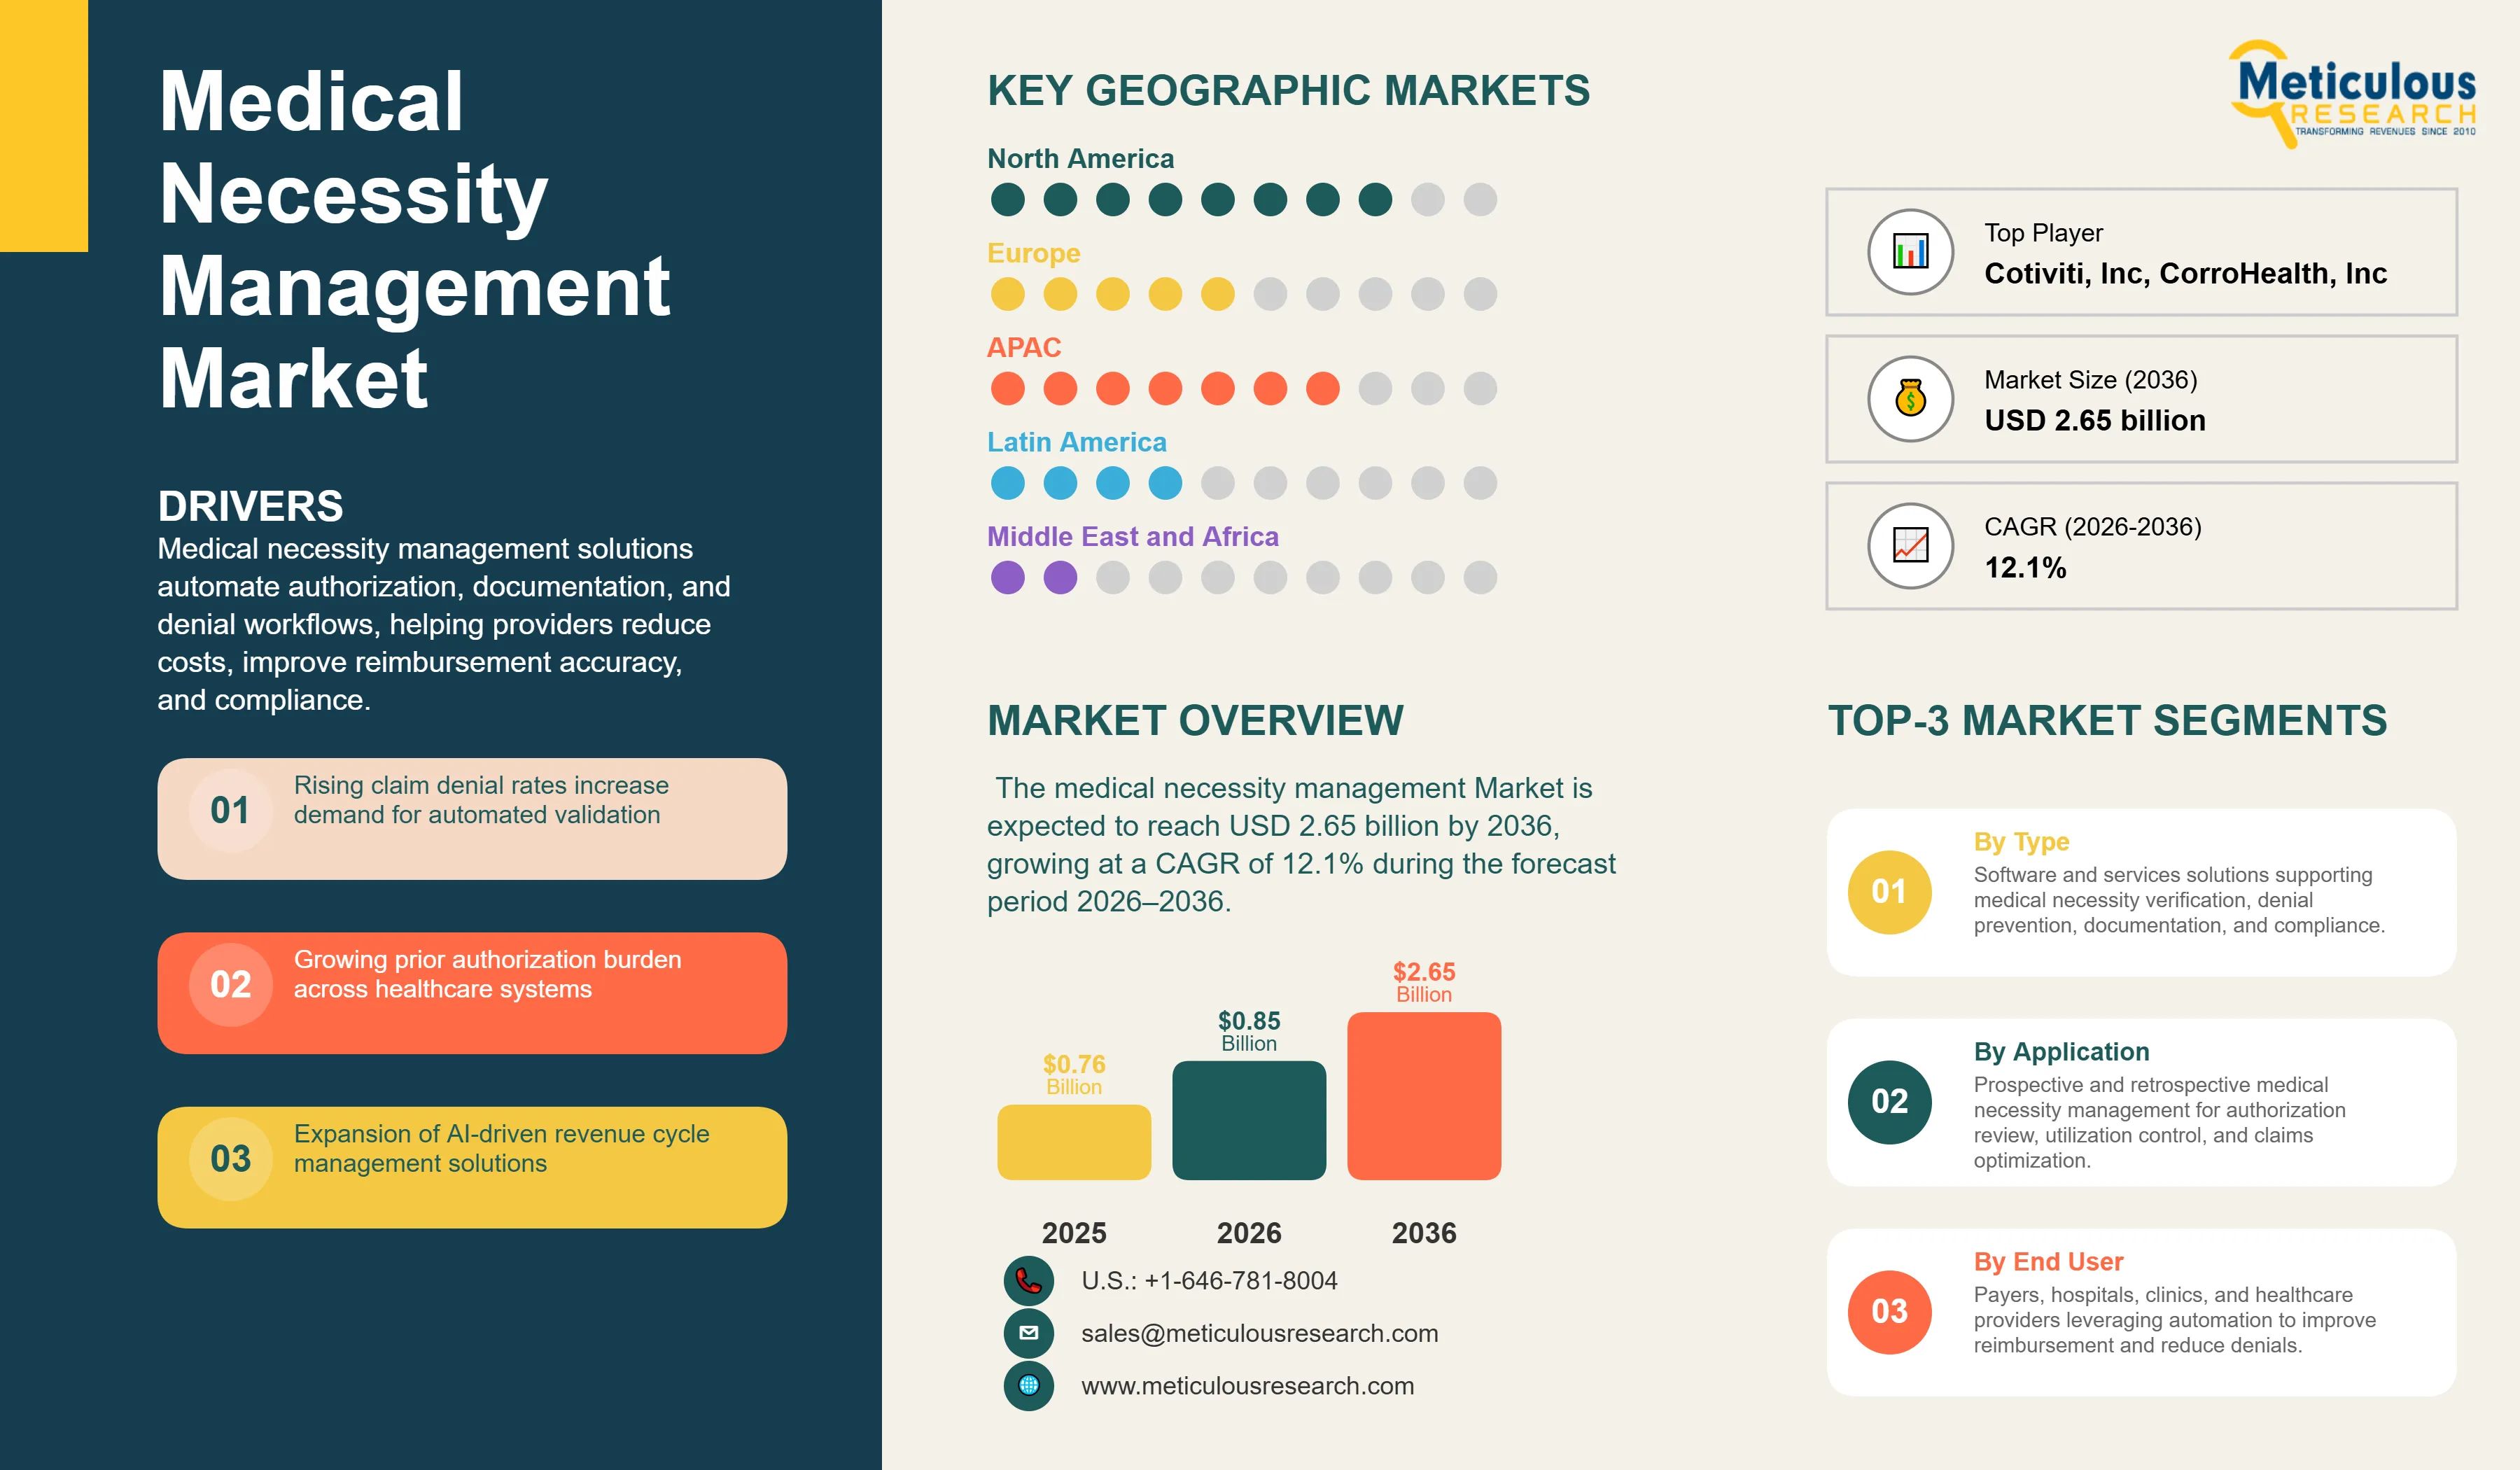
The global medical necessity management market is estimated to be USD 0.85 billion in 2026. This market is expected to reach USD 2.65 billion by 2036, growing at a CAGR of 12.1% during the forecast period 2026–2036.
 Click here to: Get Free Sample Pages of this Report
The global medical necessity management market represents a critical segment within healthcare revenue cycle management, focusing on ensuring that healthcare services are clinically appropriate and comply with payer-specific coverage policies to secure reimbursement. These solutions integrate with electronic health records (EHRs) and practice management systems to automate prior authorization, clinical documentation improvement, and denial management workflows. According to the American Hospital Association (AHA), U.S. hospitals spent approximately USD 43 billion in 2025 pursuing reimbursement for care already delivered, with prior authorization requirements, claims denials, repeated documentation requests, and evolving coverage rules contributing significantly to administrative costs. In parallel, nearly 53 million prior authorization determinations were processed by Medicare Advantage insurers in 2024, with about 4.1 million requests partially or fully denied, highlighting the growing complexity of utilization management processes. The Centers for Medicare & Medicaid Services (CMS) estimates that prior authorization activities consume an average of 13 hours per physician each week and cost providers roughly USD 34,000 annually, accelerating the shift from manual reviews toward automated and AI-enabled medical necessity management platforms that support real-time clinical and reimbursement decision-making.
Drivers: Mitigating Revenue Leakage through Automated Medical Necessity Verification
The growth of the market is being driven by the need to reduce claim denials and the administrative burden associated with manual prior authorization processes. According to Kodiak Solutions, average initial claim denial rates increased to 11.81% in 2024, contributing to substantial revenue leakage for healthcare providers. In addition, the American Medical Association (AMA) reports that physicians and their staff spend nearly 13 hours per week completing prior authorizations, while CMS estimates that these activities impose approximately USD 34,000 in annual administrative costs per physician. These challenges are accelerating the adoption of automated medical necessity management solutions that improve documentation accuracy, enhance clean claim submission rates, and help address the approximately USD 43 billion spent annually by U.S. hospitals on reimbursement-related administrative activities (Source: Kodiak Solutions, AMA, CMS, AHA).
Restraints: Integration Complexities and Data Interoperability Barriers
Despite the clear financial benefits, market growth is constrained by integration complexities and the organizational change required for enterprise-wide deployment. Although approximately 96% of U.S. non-federal acute care hospitals have adopted certified EHR systems (Source: ONC), interoperability and data fragmentation remain persistent challenges, limiting the effectiveness of automated medical necessity workflows. In addition, stringent regulatory frameworks such as HIPAA and GDPR require significant investments in cybersecurity and data governance. The high upfront costs associated with implementing integrated platforms, combined with potential workflow disruption during transition, continue to present barriers for smaller practices and resource-constrained healthcare systems.
Opportunities: AI-Powered Predictive Analytics and Clinical Documentation Improvement
Emerging opportunities in AI-powered predictive analytics and advanced clinical documentation improvement (CDI) are creating new growth avenues for the medical necessity management market. Rapid adoption of AI technologies across healthcare is accelerating the shift toward intelligent automation and data-driven decision-making. AI-enabled solutions can analyze historical claims and utilization patterns to proactively identify denial risks before claim submission, helping providers strengthen revenue integrity. In parallel, enhanced CDI capabilities improve the accuracy and completeness of medical records, supporting appropriate reimbursement and reducing documentation-related denials. The continued expansion of value-based care models and quality-based reimbursement programs is further encouraging providers and payers to invest in solutions that ensure clinically appropriate care and comprehensive documentation.
Shift Towards Proactive Denial Prevention
A defining trend in 2026 is the shift from reactive denial management to proactive prevention through real-time medical necessity verification and documentation review. This transition is being driven by rising claim denials, with average initial denial rates reaching 11.81% in 2024 (Source: Kodiak Solutions). At the same time, the American Hospital Association estimates that hospitals incurred approximately USD 43 billion in administrative costs related to reimbursement activities in 2025, underscoring the need to prevent denials before claims are submitted. Consequently, providers are increasingly deploying AI-enabled platforms that validate payer policies at the point of care, improving clean claim rates and reducing administrative burden.
Integration of AI and Machine Learning for Enhanced Accuracy
The market is witnessing growing integration of artificial intelligence and machine learning into medical necessity management workflows. AI-powered platforms analyze clinical documentation, payer policies, and historical claims data to support more accurate utilization and reimbursement decisions. This trend is reinforced by the heavy burden of prior authorization, as physicians and staff spend nearly 13 hours per week completing authorization requirements (Source: AMA), while Medicare Advantage plans processed approximately 53 million prior authorization requests in 2023, according to KFF. In response, CMS finalized interoperability and prior authorization reforms aimed at accelerating electronic prior authorization and reducing provider burden, further supporting the adoption of AI-driven medical necessity management solutions.
Analysis by Component
Based on component, the software segment is expected to hold the largest share in 2026. This dominance is driven by the increasing demand for automated solutions that can handle the complexities of medical policy and clinical documentation. The services segment is projected to register the highest CAGR during the forecast period, reflecting the growing need for implementation, integration, and ongoing consulting support as healthcare organizations navigate evolving regulatory landscapes and payer requirements.
Analysis by Type
By type, prospective medical necessity management is expected to dominate the market in 2026. This is driven by the imperative to prevent denials before claims submission, thereby reducing the significant administrative burden and revenue loss associated with appeals. Retrospective medical necessity management is projected to exhibit strong growth, as providers seek to recover a portion of the 54.3% of denied claims that are potentially recoverable through robust appeal processes and clinical documentation improvement.
Based on deployment mode, the cloud-based segment is expected to account for the largest share in 2026, representing approximately 75% of new installations. Cloud platforms offer superior scalability, accessibility, and ease of updates, which are crucial for managing constantly evolving payer policies and regulatory changes. The cloud-based segment is also projected to register the highest CAGR, as health systems increasingly adopt subscription-based models that reduce upfront capital expenditure and support remote access for revenue cycle teams.
Analysis by End User
By end user, the payers segment is expected to hold the largest share in 2026. Payers utilize medical necessity management solutions to control costs, ensure appropriate utilization of healthcare services, and comply with regulatory mandates. The providers segment (hospitals, clinics) is projected to witness the fastest growth, as they increasingly invest in these solutions to mitigate revenue leakage from denials and streamline prior authorization processes, which can cost up to $50 per hour per provider.
North America
North America is expected to dominate the global medical necessity management market in 2026, accounting for approximately 45–50% of total revenue. The region benefits from a complex payer-provider ecosystem, stringent reimbursement requirements, and the high cost of administrative activities. According to the American Hospital Association (AHA), U.S. hospitals incurred approximately USD 43 billion in reimbursement-related administrative costs in 2025, accelerating investment in prior authorization, denial management, and medical necessity solutions. The presence of leading vendors and widespread EHR adoption further strengthens the region's market leadership.
Europe
Europe is projected to account for approximately 25–30% of the global market in 2026. Growing emphasis on healthcare efficiency, increasing digitalization, and regulatory frameworks such as GDPR are driving the adoption of secure and integrated medical necessity management solutions. Initiatives under the European Health Data Space (EHDS) and continued investments in health information exchange are supporting the modernization of reimbursement and utilization management processes.
Asia Pacific
Asia Pacific is expected to register the fastest growth during the forecast period, driven by expanding healthcare infrastructure, rising healthcare expenditure, and accelerating digital health initiatives. Programs such as India's Ayushman Bharat Digital Mission and ongoing healthcare informatization efforts in China are promoting electronic health record adoption and workflow automation. Coupled with growing insurance penetration and a large patient population, these developments create significant opportunities for scalable medical necessity management solutions.
The competitive landscape of the global medical necessity management market is characterized by intense innovation and strategic acquisitions as vendors seek to provide end-to-end revenue cycle optimization platforms. Leading players are differentiating themselves through the sophistication of their AI engines and their ability to provide demonstrated ROI in terms of denial reduction and improved clean claim rates. Strategic moves, such as the integration of clinical documentation improvement (CDI) and prior authorization modules into unified ecosystems, are redefining vendor positioning in the June 2026 landscape.
Optum, Inc., Change Healthcare, Inc., MCG Health, LLC, Oracle Health, Epic Systems Corporation, 3M Health Information Systems, Waystar Holding Corp., R1 RCM Inc., Experian Health, Conifer Health Solutions, LLC, Craneware plc, Health Catalyst, Inc., Wolters Kluwer N.V., Cotiviti, Inc., Inovalon Holdings, Inc., Evolent Health, Inc., Carelon Medical Benefits Management, MHK, Inc., Zyter|TruCare, CorroHealth, Inc.
The market is projected to reach USD 2.65 billion by 2036, growing at a CAGR of 12.1% from 2026 to 2036.
Healthcare providers benefit from lower denial-related revenue leakage, improved clean claim submission rates, and reduced administrative burden. Growing claim denial rates, which reached 11.81% for initial claims in 2024.
The services segment is projected to exhibit the fastest growth, driven by increasing demand for implementation and integration consulting
Cloud-based solutions are estimated to account for a majority of new medical necessity management deployments in 2026, driven by the growing need for scalable, interoperable, and AI-enabled revenue cycle platforms.
North America holds the largest share, estimated at approximately 45-50% in 2026, driven by a complex payer-provider landscape.
AI-powered predictive analytics forecast denial risks with high accuracy, allowing providers to proactively address issues before claims submission.
Automated solutions significantly reduce the administrative burden and cost of prior authorization, which can be up to $50 per hour per provider.
Payers are the primary adopters, driven by their imperative to control costs and ensure appropriate utilization of healthcare services.
These systems improve clinical documentation quality and coding accuracy, helping reduce documentation-related denials and supporting faster, more accurate reimbursement.
The top 5 players are Optum, Inc., McKesson Corporation, Change Healthcare, 3M Health Information Systems, and Oracle Health (Cerner).
1. Market Definition & Scope
1.1. Market Definition
1.2. Market Ecosystem
1.3. Currency Considered
1.4. Key Stakeholders
2. Research Methodology
2.1. Research Approach
2.2. Data Collection and Validation
2.2.1. Secondary Research
2.2.2. Primary Research/KOL Interviews
2.3. Market Sizing and Forecast
2.3.1. Market Size Estimation Approach
2.3.1.1. Bottom-Up Approach
2.3.1.2. Top-Down Approach
2.3.2. Growth Forecast Approach
2.3.3. Assumptions for the Study
3. Executive Summary
3.1. Overview
3.2. Segmental Analysis
3.2.1. Market Analysis, by Component
3.2.2. Market Analysis, by Type
3.2.3. Market Analysis, by Deployment Mode
3.2.4. Market Analysis, by End User
3.2.5. Market Analysis, by Geography
3.3. Competitive Analysis
4. Market Insights
4.1. Overview
4.2. Factors Affecting Market Growth
4.2.1. Drivers
4.2.1.1. Mitigating Revenue Leakage through Automated Medical Necessity Verification
4.2.1.2. Increasing Regulatory Scrutiny and Compliance Mandates
4.2.1.3. Rising Cost of Manual Prior Authorization Processes
4.2.2. Restraints
4.2.2.1. Integration Complexities with Legacy IT Systems
4.2.2.2. Data Interoperability Challenges Across Fragmented Payer Systems
4.2.3. Opportunities
4.2.3.1. AI-Powered Predictive Analytics for Denial Prevention
4.2.3.2. Expansion of Clinical Documentation Improvement (CDI) Programs
4.2.3.3. Shift Towards Value-Based Care Models
4.2.4. Challenges
4.2.4.1. Managing User Adoption and Change Management in Revenue Cycle Teams
4.2.4.2. Cybersecurity Vulnerabilities in Centralized Claims Processing Hubs
4.2.4.3. Keeping Pace with Evolving Payer Policies and Medical Guidelines
4.2.5. Trends
4.2.5.1. Shift Towards Proactive Denial Prevention and Real-time Verification
4.2.5.2. Integration of AI and Machine Learning for Enhanced Accuracy
4.3. Porter’s Five Forces Analysis
4.4. Regulatory Landscape
4.5. Value Chain Analysis
5. Global Medical Necessity Management Market, by Component
5.1. Overview
5.2. Software
5.2.1. Medical Policy & Guideline Management
5.2.2. Prior Authorization Management
5.2.3. Clinical Documentation Improvement (CDI)
5.2.4. Denial Management & Appeals
5.3. Services
5.3.1. Strategic Consulting & Implementation
5.3.2. Training & Support
5.3.3. Outsourced Medical Necessity Review
6. Global Medical Necessity Management Market, by Type
6.1. Overview
6.2. Prospective Medical Necessity Management
6.3. Retrospective Medical Necessity Management
7. Global Medical Necessity Management Market, by Deployment Mode
7.1. Overview
7.2. On-premise
7.3. Cloud-based
8. Global Medical Necessity Management Market, by End User
8.1. Overview
8.2. Payers
8.3. Providers (Hospitals, Clinics, ACOs)
8.4. Other End Users
9. Global Medical Necessity Management Market, by Geography
9.1. Overview
9.2. North America
9.2.1. U.S.
9.2.2. Canada
9.3. Europe
9.3.1. Germany
9.3.2. U.K.
9.3.3. France
9.3.4. Italy
9.3.5. Spain
9.3.6. Rest of Europe
9.4. Asia Pacific
9.4.1. China
9.4.2. Japan
9.4.3. India
9.4.4. Rest of Asia Pacific
9.5. Latin America
9.5.1. Brazil
9.5.2. Mexico
9.5.3. Rest of Latin America
9.6. Middle East & Africa
9.6.1. UAE
9.6.2. Saudi Arabia
9.6.3. Rest of Middle East & Africa
10. Competitive Landscape
10.1. Introduction
10.2. Key Strategic Developments
10.3. Market Share Analysis
11. Company Profiles
11.1. Optum, Inc. (U.S.)
11.2. Change Healthcare, Inc. (U.S.) (subsidiary of Optum)
11.3. MCG Health, LLC (U.S.)
11.4. Oracle Health (Cerner) (U.S.)
11.5. Epic Systems Corporation (U.S.)
11.6. 3M Health Information Systems (U.S.)
11.7. Waystar Holding Corp. (U.S.)
11.8. R1 RCM Inc. (U.S.)
11.9. Experian Health (U.S.)
11.10. Conifer Health Solutions, LLC (U.S.)
11.11. Craneware plc (U.K.)
11.12. Health Catalyst, Inc. (Vitalware) (U.S.)
11.13. Wolters Kluwer N.V. (Netherlands)
11.14. Cotiviti, Inc. (U.S.)
11.15. Inovalon Holdings, Inc. (U.S.)
11.16. Evolent Health, Inc. (U.S.)
11.17. Carelon Medical Benefits Management (U.S.)
11.18. MHK, Inc. (U.S.) (Hearst Health company)
11.19. CorroHealth, Inc. (U.S.)
11.20. Infinx Healthcare, Inc. (U.S.)
12. Appendix
12.1. References
12.2. Disclaimer


Published Date: Jan-2026
Published Date: Jun-2024
Subscribe to get the latest industry updates