Resources
About Us
Report Overview
This comprehensive market research report analyzes the rapidly expanding low-carbon cement alternatives market, evaluating how emerging sustainable materials are addressing carbon emission challenges across the construction industry. The report provides a strategic analysis of market dynamics, market size and forecast till 2032, and competitive positioning across global and regional/country-level markets.
Key Market Drivers & Trends
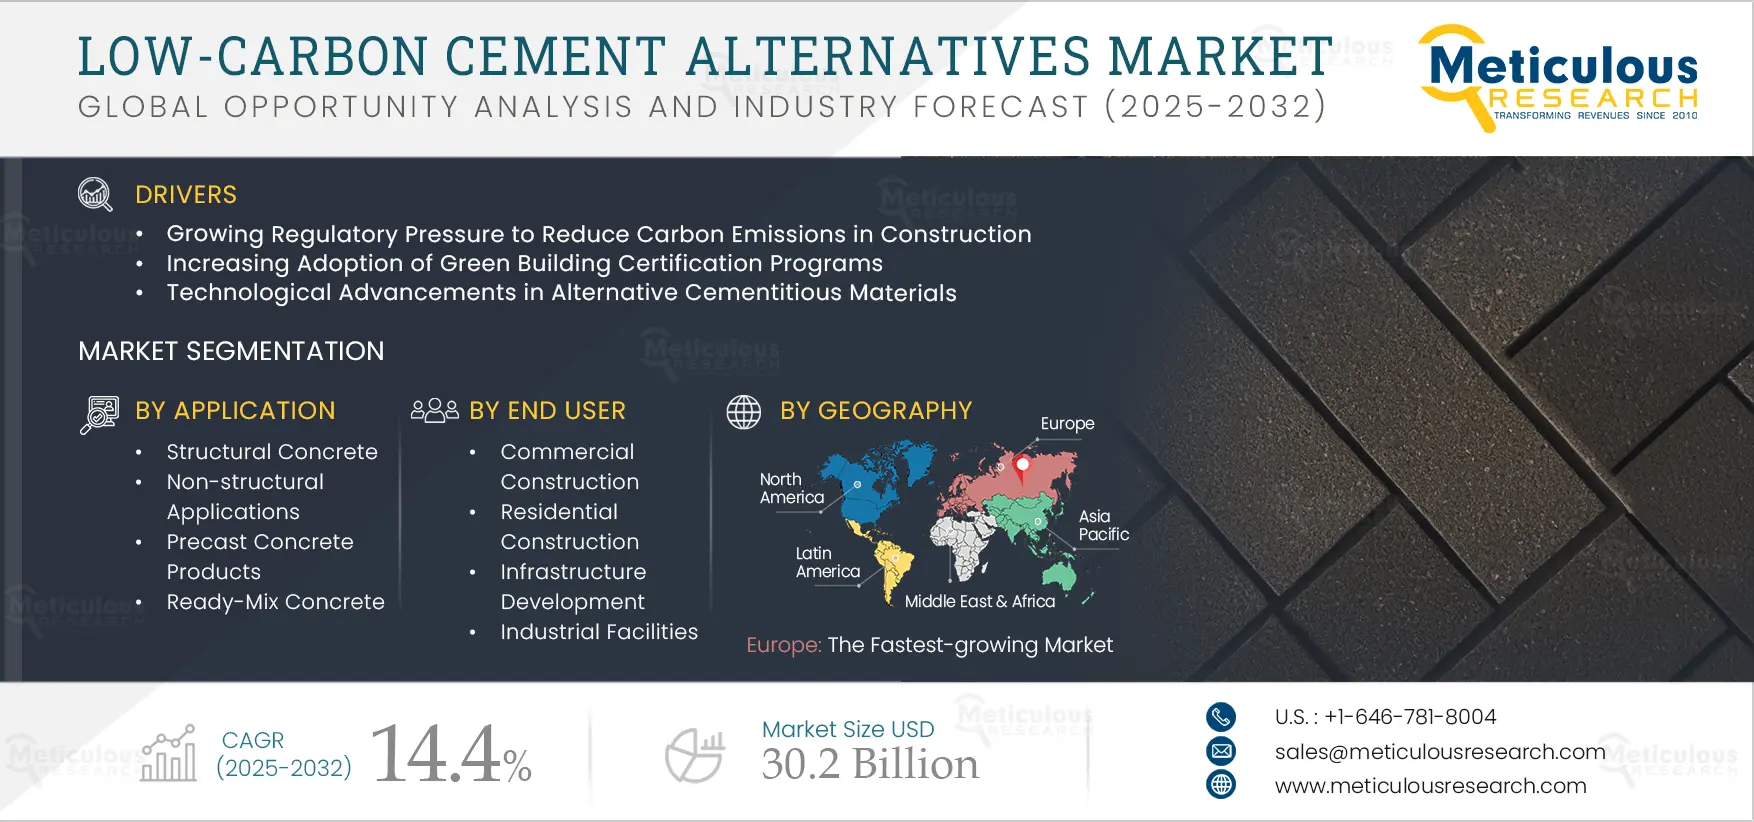
The low-carbon cement alternatives market is primarily driven by growing regulatory pressure to reduce carbon emissions in construction, increasing adoption of green building certification programs, rising corporate sustainability commitments in the construction sector, technological advancements in alternative cementitious materials, and growing awareness of embodied carbon in building materials. The shift toward blended cements with reduced clinker content is reshaping the industry, while increasing research in alkali-activated materials and geopolymers is gaining significant traction. Additionally, integration of digital technologies for optimized mix designs, emergence of carbon curing technologies, and rise of bio-based additives and alternative activators are further driving market growth, especially in Europe and North America.
Click here to: Get Free Sample Pages of this Report
Key Challenges
The overall low-carbon cement alternatives market faces some challenges including higher production costs compared to traditional Portland cement, limited availability of alternative raw materials in some regions, slower setting and strength development of some alternatives, conservative industry standards and building codes, and limited large-scale production capacity for novel alternatives. Additionally, ensuring long-term durability and performance, overcoming industry resistance to new materials, scaling production while maintaining carbon reduction benefits, standardization and certification of novel cement types, and educating stakeholders on proper use and specifications present significant barriers, potentially slowing down market penetration in different countries across the globe.
Growth Opportunities
The low-carbon cement alternatives market offers several high-growth opportunities. Carbon pricing and taxation mechanisms favoring low-carbon materials are creating economic incentives for wider adoption. Another major opportunity lies in public infrastructure projects specifying low-carbon concrete. Additionally, valorization of industrial by-products in cement production is creating circular economy benefits while reducing costs. The development of carbon capture and utilization technologies and growing market for carbon-negative construction materials further expand the growth landscape for both established manufacturers and innovative startups.
Market Segmentation Highlights
By Product Type
The Supplementary Cementitious Materials (SCM) Blends segment is expected to dominate the overall low-carbon cement alternatives market in 2025, primarily due to their established performance record, relative ease of implementation within existing production systems, and familiarity among construction professionals. These materials offer a practical balance between carbon reduction and technical performance, with widespread regulatory acceptance. The Geopolymer Cement segment follows closely, particularly in regions with abundant industrial by-products suitable for alkali activation. However, the Calcium Sulfoaluminate Cement (CSA) segment is expected to grow at the fastest CAGR through 2032, driven by its superior early strength development, reduced energy requirements during manufacturing, and increasing commercial availability.
By Raw Material
The Industrial By-products segment (including fly ash, slag, and silica fume) is expected to hold the largest share of the overall low-carbon cement alternatives market in 2025, due to their widespread availability as waste streams from power generation and metal production, established supply chains, and proven performance as supplementary cementitious materials. The Calcined Clays segment follows closely, driven by abundant natural reserves and growing interest in limestone calcined clay cement (LC3) technology. However, the Alternative Calcium Sources segment is expected to grow at the fastest rate during the forecast period, propelled by innovations in carbon-negative materials that sequester CO2 during production and the development of novel binding agents derived from waste streams.
By Application
The Ready-Mix Concrete segment is expected to hold the largest share of the overall low-carbon cement alternatives market in 2025, primarily due to its widespread use in construction projects of all sizes, the ability to precisely control mixture proportions in centralized facilities, and the sector's strong emphasis on sustainability certifications. The Precast Concrete Products segment follows closely, benefiting from controlled manufacturing environments that can accommodate variations in setting times and curing requirements. However, the Structural Concrete segment is expected to experience the fastest growth rate during the forecast period, driven by increasing performance validation of alternative cements for load-bearing applications and the high visibility of green building projects employing sustainable structural materials.
By End User
The Commercial Construction segment is expected to hold the largest share of the overall low-carbon cement alternatives market in 2025, primarily due to corporate sustainability initiatives, green building certification requirements, and the high visibility of sustainable corporate headquarters and facilities. The Infrastructure Development segment follows closely, bolstered by government procurement policies increasingly specifying low-carbon materials for public works. However, the Industrial Facilities segment is expected to grow at the fastest rate during the forecast period, driven by heavy industries seeking to reduce scope 3 emissions in their physical assets, requirements for specialized performance characteristics, and the symbolism of using sustainable materials in manufacturing settings.
By Geography
Europe is expected to hold the largest share of the global low-carbon cement alternatives market in 2025, driven by stringent carbon regulations, well-established carbon pricing mechanisms, and ambitious climate targets across the region. Additionally, strong green building certification programs and consumer awareness contribute significantly to market dominance. North America follows as the second-largest market, bolstered by corporate sustainability initiatives and growing state-level procurement policies requiring low-carbon materials. However, the Asia-Pacific region is witnessing the fastest growth rate during the forecast period, primarily driven by rapid urbanization, massive infrastructure development, and increasingly stringent environmental regulations in countries like China and India.
Competitive Landscape
The global low-carbon cement alternatives market features a diverse competitive landscape with established cement manufacturers pivoting toward sustainable solutions, specialized green material startups, technology providers focused on carbon capture and utilization, and research institutions commercializing novel binding technologies.
The broader manufacturing landscape is categorized into industry leaders, market differentiators, vanguards, and contemporary stalwarts, with each group employing distinctive strategies to advance sustainable construction materials. Leading manufacturers are balancing incremental improvements to existing cement formulations with investments in breakthrough technologies that promise deeper decarbonization.
The key players operating in the global low-carbon cement alternatives market are Holcim Group, HeidelbergCement AG, CEMEX S.A.B. de C.V., CRH plc, Solidia Technologies, Carbicrete, CarbonCure Technologies Inc., Ecocem Materials Ltd., Calix Limited, Ceratech Inc., BioMason Inc., Terra CO2 Technologies, CarbiCrete, Zeobond Pty Ltd, and LC3 Technology among others
|
Particulars |
Details |
|
Number of Pages |
225 |
|
Format |
PDF & Excel |
|
Forecast Period |
2025–2032 |
|
Base Year |
2024 |
|
CAGR (Value) |
14.4% |
|
Market Size (Value) in 2025 |
USD 10.3 billion |
|
Market Size (Value) in 2032 |
USD 30.2 Billion |
|
Segments Covered |
|
|
Countries Covered |
North America (U.S., Canada), Europe (Germany, France, U.K., Italy, Spain, Rest of Europe), Asia-Pacific (China, Japan, India, Australia, South Korea, Rest of Asia-Pacific), Latin America (Brazil, Mexico, Rest of Latin America), Middle East & Africa (Saudi Arabia, United Arab Emirates, Rest of Middle East & Africa) |
|
Key Companies |
Holcim Group, HeidelbergCement AG, CEMEX S.A.B. de C.V., CRH plc, Solidia Technologies, Carbicrete, CarbonCure Technologies Inc., Ecocem Materials Ltd., Calix Limited, Ceratech Inc., BioMason Inc., Terra CO2 Technologies, CarbiCrete, Zeobond Pty Ltd, and LC3 Technology |
The global low-carbon cement alternatives market was valued at $8.4 billion in 2024. This market is expected to reach $30.2 billion by 2032 from an estimated $10.3 billion in 2025, at a CAGR of 14.4% during the forecast period of 2025–2032.
The global low-carbon cement alternatives market is expected to grow at a CAGR of 14.4% during the forecast period of 2025–2032.
The global low-carbon cement alternatives market is expected to reach $30.2 billion by 2032 from an estimated $10.3 billion in 2025, at a CAGR of 14.4% during the forecast period of 2025–2032.
The key companies operating in this market include Holcim Group, HeidelbergCement AG, CEMEX S.A.B. de C.V., CRH plc, Solidia Technologies, Carbicrete, CarbonCure Technologies Inc., Ecocem Materials Ltd., Calix Limited, Ceratech Inc., BioMason Inc., Terra CO2 Technologies, CarbiCrete, Zeobond Pty Ltd, and LC3 Technology.
Major trends shaping the market include shift toward blended cements with reduced clinker content, increasing research in alkali-activated materials and geopolymers, integration of digital technologies for optimized mix designs, emergence of carbon curing technologies, and rise of bio-based additives and alternative activators.
• In 2025, the Supplementary Cementitious Materials (SCM) Blends segment is expected to dominate the overall low-carbon cement alternatives market by product type
• Based on raw material, the Industrial by-products segment is expected to hold the largest share of the overall low-carbon cement alternatives market in 2025
• Based on application, the Ready-Mix Concrete segment is expected to hold the largest share of the global low-carbon cement alternatives market in 2025
• Based on end user, the Commercial Construction segment is expected to hold the largest share of the market in 2025
Europe is expected to hold the largest share of the global low-carbon cement alternatives market in 2025, driven by stringent carbon regulations, well-established carbon pricing mechanisms, and ambitious climate targets across the region.
The growth of this market is driven by growing regulatory pressure to reduce carbon emissions in construction, increasing adoption of green building certification programs, rising corporate sustainability commitments in the construction sector, technological advancements in alternative cementitious materials, and growing awareness of embodied carbon in building materials.
1. Market Definition & Scope
1.1. Market Definition
1.2. Market Ecosystem
1.3. Currency
1.4. Key Stakeholders
2. Research Methodology
2.1. Research Approach
2.2. Process of Data Collection and Validation
2.2.1. Secondary Research
2.2.2. Primary Research/Interviews with Key Opinion Leaders from the Industry
2.3. Market Sizing and Forecast
2.3.1. Market Size Estimation Approach
2.3.2. Bottom-up Approach
2.3.3. Top-down Approach
2.3.4. Growth Forecast Approach
2.3.5. Assumptions for the Study
3. Executive Summary
3.1. Overview
3.2. Segmental Analysis
3.2.1. Low-Carbon Cement Alternatives Market, by Product Type
3.2.2. Low-Carbon Cement Alternatives Market, by Raw Material
3.2.3. Low-Carbon Cement Alternatives Market, by Application
3.2.4. Low-Carbon Cement Alternatives Market, by End User
3.2.5. Low-Carbon Cement Alternatives Market, by Geography
3.3. Competitive Landscape
4. Market Insights
4.1. Overview
4.2. Factors Affecting Market Growth
4.2.1. Drivers
4.2.1.1. Growing Regulatory Pressure to Reduce Carbon Emissions in Construction
4.2.1.2. Increasing Adoption of Green Building Certification Programs
4.2.1.3. Rising Corporate Sustainability Commitments in the Construction Sector
4.2.1.4. Technological Advancements in Alternative Cementitious Materials
4.2.1.5. Growing Awareness of Embodied Carbon in Building Materials
4.2.2. Restraints
4.2.2.1. Higher Production Costs Compared to Traditional Portland Cement
4.2.2.2. Limited Availability of Alternative Raw Materials in Some Regions
4.2.2.3. Slower Setting and Strength Development of Some Alternatives
4.2.2.4. Conservative Industry Standards and Building Codes
4.2.2.5. Limited Large-Scale Production Capacity for Novel Alternatives
4.2.3. Opportunities
4.2.3.1. Carbon Pricing and Taxation Mechanisms Favoring Low-Carbon Materials
4.2.3.2. Public Infrastructure Projects Specifying Low-Carbon Concrete
4.2.3.3. Valorization of Industrial By-products in Cement Production
4.2.3.4. Development of Carbon Capture and Utilization Technologies
4.2.3.5. Growing Market for Carbon-Negative Construction Materials
4.2.4. Trends
4.2.4.1. Shift Toward Blended Cements with Reduced Clinker Content
4.2.4.2. Increasing Research in Alkali-Activated Materials and Geopolymers
4.2.4.3. Integration of Digital Technologies for Optimized Mix Designs
4.2.4.4. Emergence of Carbon Curing Technologies
4.2.4.5. Rise of Bio-based Additives and Alternative Activators
4.2.5. Challenges
4.2.5.1. Ensuring Long-term Durability and Performance
4.2.5.2. Overcoming Industry Resistance to New Materials
4.2.5.3. Scaling Production While Maintaining Carbon Reduction Benefits
4.2.5.4. Standardization and Certification of Novel Cement Types
4.2.5.5. Educating Stakeholders on Proper Use and Specifications
4.3. Porter's Five Forces Analysis
4.3.1. Bargaining Power of Suppliers
4.3.2. Bargaining Power of Buyers
4.3.3. Threat of Substitutes
4.3.4. Threat of New Entrants
4.3.5. Degree of Competition
4.4. Sustainability Impact on Low-Carbon Cement Alternatives Market
4.4.1. Key Sustainability Dimensions Driving Industry Strategy
4.4.2. Material Sourcing and Circular Economy Principles
4.4.3. Energy Efficiency in Production Processes
4.4.4. Carbon Footprint Assessment and Reduction Strategies
4.4.5. Industry Adoption Strategies and Implementation Challenges
5. Low-Carbon Cement Alternatives Market Assessment—by Product Type
5.1. Supplementary Cementitious Materials (SCM) Blends
5.2. Geopolymer Cement
5.3. Calcium Sulfoaluminate Cement (CSA)
5.4. Alkali-Activated Materials
5.5. Magnesium-Based Cement
5.6. Others
6. Low-Carbon Cement Alternatives Market Assessment—by Raw Material
6.1. Industrial By-products (Fly Ash, Slag, Silica Fume)
6.2. Natural Pozzolans
6.3. Calcined Clays
6.4. Alternative Calcium Sources
6.5. Novel Binding Materials
6.6. Others
7. Low-Carbon Cement Alternatives Market Assessment—by Application
7.1. Structural Concrete
7.2. Non-structural Applications
7.3. Precast Concrete Products
7.4. Ready-Mix Concrete
7.5. Others
8. Low-Carbon Cement Alternatives Market Assessment—by End User
8.1. Commercial Construction
8.2. Residential Construction
8.3. Infrastructure Development
8.4. Industrial Facilities
8.5. Others
9. Low-Carbon Cement Alternatives Market Assessment—by Geography
9.1. Overview
9.2. North America
9.2.1. U.S.
9.2.2. Canada
9.3. Europe
9.3.1. Germany
9.3.2. France
9.3.3. U.K.
9.3.4. Italy
9.3.5. Spain
9.3.6. Rest of Europe (RoE)
9.4. Asia-Pacific
9.4.1. China
9.4.2. Japan
9.4.3. India
9.4.4. Australia
9.4.5. South Korea
9.4.6. Rest of Asia-Pacific (RoAPAC)
9.5. Latin America
9.5.1. Brazil
9.5.2. Mexico
9.5.3. Rest of Latin America (RoLATAM)
9.6. Middle East & Africa
9.6.1. Saudi Arabia
9.6.2. United Arab Emirates (UAE)
9.6.3. Rest of Middle East & Africa (RoMEA)
10. Competitive Landscape
10.1. Overview
10.2. Key Growth Strategies
10.3. Competitive Benchmarking
10.4. Competitive Dashboard
10.4.1. Industry Leaders
10.4.2. Market Differentiators
10.4.3. Vanguards
10.4.4. Contemporary Stalwarts
10.5. Market Share/Ranking Analysis, by Key Players, 2024
11. Company Profiles (Business Overview, Financial Overview, Product Portfolio, Strategic Developments, and SWOT Analysis)
11.1. Holcim Group
11.2. HeidelbergCement AG
11.3. CEMEX S.A.B. de C.V.
11.4. CRH plc
11.5. Solidia Technologies
11.6. Carbicrete
11.7. CarbonCure Technologies Inc.
11.8. Ecocem Materials Ltd.
11.9. Calix Limited
11.10. Ceratech Inc.
11.11. BioMason Inc.
11.12. Terra CO2 Technologies
11.13. CarbiCrete
11.14. Zeobond Pty Ltd
11.15. LC3 Technology
12. Appendix
12.1. Available Customization
12.2. Related Reports
List of Tables
Global Market Overview
Table 1: Global Low-Carbon Cement Alternatives Market, 2023-2032 (USD Million)
Table 2: Global Low-Carbon Cement Alternatives Market, 2023-2032 (Kilotons)
Table 3: Global Low-Carbon Cement Alternatives Market, by Product Type, 2023-2032 (USD Million)
Table 4: Global Low-Carbon Cement Alternatives Market, by Raw Material, 2023-2032 (USD Million)
Table 5: Global Low-Carbon Cement Alternatives Market, by Application, 2023-2032 (USD Million)
Table 6: Global Low-Carbon Cement Alternatives Market, by End User, 2023-2032 (USD Million)
Table 7: Global Low-Carbon Cement Alternatives Market, by Country/Region, 2023-2032 (USD Million)
Product Type Segment
Table 8: Global Supplementary Cementitious Materials (SCM) Blends Market, by Region/Country, 2023 -2032 (USD Million)
Table 9: Global Geopolymer Cement Market, by Region/Country, 2023 -2032 (USD Million)
Table 10: Global Calcium Sulfoaluminate Cement (CSA) Market, by Region/Country, 2023 -2032 (USD Million)
Table 11: Global Alkali-Activated Materials Market, by Region/Country, 2023 -2032 (USD Million)
Table 12: Global Magnesium-Based Cement Market, by Region/Country, 2023 -2032 (USD Million)
Table 13: Global Other Low-Carbon Cement Alternatives Market, by Region/Country, 2023 -2032 (USD Million)
Raw Material Segment
Table 14: Global Industrial By-products (Fly Ash, Slag, Silica Fume) Market, by Region/Country, 2023 -2032 (USD Million)
Table 15: Global Natural Pozzolans Market, by Region/Country, 2023 -2032 (USD Million)
Table 16: Global Calcined Clays Market, by Region/Country, 2023 -2032 (USD Million)
Table 17: Global Alternative Calcium Sources Market, by Region/Country, 2023 -2032 (USD Million)
Table 18: Global Novel Binding Materials Market, by Region/Country, 2023 -2032 (USD Million)
Table 19: Global Other Raw Materials Market, by Region/Country, 2023 -2032 (USD Million)
Application Segment
Table 20: Low-Carbon Cement Alternatives Market for Structural Concrete, by Region/Country, 2023 -2032 (USD Million)
Table 21: Low-Carbon Cement Alternatives Market for Non-structural Applications, by Region/Country, 2023 -2032 (USD Million)
Table 22: Low-Carbon Cement Alternatives Market for Precast Concrete Products, by Region/Country, 2023 -2032 (USD Million)
Table 23: Low-Carbon Cement Alternatives Market for Ready-Mix Concrete, by Region/Country, 2023 -2032 (USD Million)
Table 24: Low-Carbon Cement Alternatives Market for Other Applications, by Region/Country, 2023 -2032 (USD Million)
End User Segment
Table 25: Low-Carbon Cement Alternatives Market for Commercial Construction, by Region/Country, 2023 -2032 (USD Million)
Table 26: Low-Carbon Cement Alternatives Market for Residential Construction, by Region/Country, 2023 -2032 (USD Million)
Table 27: Low-Carbon Cement Alternatives Market for Infrastructure Development, by Region/Country, 2023 -2032 (USD Million)
Table 28: Low-Carbon Cement Alternatives Market for Industrial Facilities, by Region/Country, 2023 -2032 (USD Million)
Table 29: Low-Carbon Cement Alternatives Market for Other End Users, by Region/Country, 2023 -2032 (USD Million)
North America Market
Table 30: North America Low-Carbon Cement Alternatives Market, 2023-2032 (USD Million)
Table 31: North America Low-Carbon Cement Alternatives Market, by Product Type, 2023-2032 (USD Million)
Table 32: North America Low-Carbon Cement Alternatives Market, by Raw Material, 2023-2032 (USD Million)
Table 33: North America Low-Carbon Cement Alternatives Market, by Application, 2023-2032 (USD Million)
Table 34: North America Low-Carbon Cement Alternatives Market, by End User, 2023-2032 (USD Million)
Table 35: North America Low-Carbon Cement Alternatives Market, by Country, 2023-2032 (USD Million)
U.S. Market
Table 36: U.S. Low-Carbon Cement Alternatives Market, 2023-2032 (USD Million)
Table 37: U.S. Low-Carbon Cement Alternatives Market, by Product Type, 2023-2032 (USD Million)
Table 38: U.S. Low-Carbon Cement Alternatives Market, by Raw Material, 2023-2032 (USD Million)
Table 39: U.S. Low-Carbon Cement Alternatives Market, by Application, 2023-2032 (USD Million)
Table 40: U.S. Low-Carbon Cement Alternatives Market, by End User, 2023-2032 (USD Million)
Canada Market
Table 41: Canada Low-Carbon Cement Alternatives Market, 2023-2032 (USD Million)
Table 42: Canada Low-Carbon Cement Alternatives Market, by Product Type, 2023-2032 (USD Million)
Table 43: Canada Low-Carbon Cement Alternatives Market, by Raw Material, 2023-2032 (USD Million)
Table 44: Canada Low-Carbon Cement Alternatives Market, by Application, 2023-2032 (USD Million)
Table 45: Canada Low-Carbon Cement Alternatives Market, by End User, 2023-2032 (USD Million)
Europe Market
Table 46: Europe Low-Carbon Cement Alternatives Market, 2023-2032 (USD Million)
Table 47: Europe Low-Carbon Cement Alternatives Market, by Product Type, 2023-2032 (USD Million)
Table 48: Europe Low-Carbon Cement Alternatives Market, by Raw Material, 2023-2032 (USD Million)
Table 49: Europe Low-Carbon Cement Alternatives Market, by Application, 2023-2032 (USD Million)
Table 50: Europe Low-Carbon Cement Alternatives Market, by End User, 2023-2032 (USD Million)
Table 51: Europe Low-Carbon Cement Alternatives Market, by Country, 2023-2032 (USD Million)
Germany Market
Table 52: Germany Low-Carbon Cement Alternatives Market, 2023-2032 (USD Million)
Table 53: Germany Low-Carbon Cement Alternatives Market, by Product Type, 2023-2032 (USD Million)
Table 54: Germany Low-Carbon Cement Alternatives Market, by Raw Material, 2023-2032 (USD Million)
Table 55: Germany Low-Carbon Cement Alternatives Market, by Application, 2023-2032 (USD Million)
Table 56: Germany Low-Carbon Cement Alternatives Market, by End User, 2023-2032 (USD Million)
France Market
Table 57: France Low-Carbon Cement Alternatives Market, 2023-2032 (USD Million)
Table 58: France Low-Carbon Cement Alternatives Market, by Product Type, 2023-2032 (USD Million)
Table 59: France Low-Carbon Cement Alternatives Market, by Raw Material, 2023-2032 (USD Million)
Table 60: France Low-Carbon Cement Alternatives Market, by Application, 2023-2032 (USD Million)
Table 61: France Low-Carbon Cement Alternatives Market, by End User, 2023-2032 (USD Million)
U.K. Market
Table 62: U.K. Low-Carbon Cement Alternatives Market, 2023-2032 (USD Million)
Table 63: U.K. Low-Carbon Cement Alternatives Market, by Product Type, 2023-2032 (USD Million)
Table 64: U.K. Low-Carbon Cement Alternatives Market, by Raw Material, 2023-2032 (USD Million)
Table 65: U.K. Low-Carbon Cement Alternatives Market, by Application, 2023-2032 (USD Million)
Table 66: U.K. Low-Carbon Cement Alternatives Market, by End User, 2023-2032 (USD Million)
Italy Market
Table 67: Italy Low-Carbon Cement Alternatives Market, 2023-2032 (USD Million)
Table 68: Italy Low-Carbon Cement Alternatives Market, by Product Type, 2023-2032 (USD Million)
Table 69: Italy Low-Carbon Cement Alternatives Market, by Raw Material, 2023-2032 (USD Million)
Table 70: Italy Low-Carbon Cement Alternatives Market, by Application, 2023-2032 (USD Million)
Table 71: Italy Low-Carbon Cement Alternatives Market, by End User, 2023-2032 (USD Million)
Spain Market
Table 72: Spain Low-Carbon Cement Alternatives Market, 2023-2032 (USD Million)
Table 73: Spain Low-Carbon Cement Alternatives Market, by Product Type, 2023-2032 (USD Million)
Table 74: Spain Low-Carbon Cement Alternatives Market, by Raw Material, 2023-2032 (USD Million)
Table 75: Spain Low-Carbon Cement Alternatives Market, by Application, 2023-2032 (USD Million)
Table 76: Spain Low-Carbon Cement Alternatives Market, by End User, 2023-2032 (USD Million)
Rest of Europe Market
Table 77: Rest of Europe Low-Carbon Cement Alternatives Market, 2023-2032 (USD Million)
Table 78: Rest of Europe Low-Carbon Cement Alternatives Market, by Product Type, 2023-2032 (USD Million)
Table 79: Rest of Europe Low-Carbon Cement Alternatives Market, by Raw Material, 2023-2032 (USD Million)
Table 80: Rest of Europe Low-Carbon Cement Alternatives Market, by Application, 2023-2032 (USD Million)
Table 81: Rest of Europe Low-Carbon Cement Alternatives Market, by End User, 2023-2032 (USD Million)
Asia-Pacific Market
Table 82: Asia-Pacific Low-Carbon Cement Alternatives Market, 2023-2032 (USD Million)
Table 83: Asia-Pacific Low-Carbon Cement Alternatives Market, by Product Type, 2023-2032 (USD Million)
Table 84: Asia-Pacific Low-Carbon Cement Alternatives Market, by Raw Material, 2023-2032 (USD Million)
Table 85: Asia-Pacific Low-Carbon Cement Alternatives Market, by Application, 2023-2032 (USD Million)
Table 86: Asia-Pacific Low-Carbon Cement Alternatives Market, by End User, 2023-2032 (USD Million)
Table 87: Asia-Pacific Low-Carbon Cement Alternatives Market, by Country, 2023-2032 (USD Million)
China Market
Table 88: China Low-Carbon Cement Alternatives Market, 2023-2032 (USD Million)
Table 89: China Low-Carbon Cement Alternatives Market, by Product Type, 2023-2032 (USD Million)
Table 90: China Low-Carbon Cement Alternatives Market, by Raw Material, 2023-2032 (USD Million)
Table 91: China Low-Carbon Cement Alternatives Market, by Application, 2023-2032 (USD Million)
Table 92: China Low-Carbon Cement Alternatives Market, by End User, 2023-2032 (USD Million)
Japan Market
Table 93: Japan Low-Carbon Cement Alternatives Market, 2023-2032 (USD Million)
Table 94: Japan Low-Carbon Cement Alternatives Market, by Product Type, 2023-2032 (USD Million)
Table 95: Japan Low-Carbon Cement Alternatives Market, by Raw Material, 2023-2032 (USD Million)
Table 96: Japan Low-Carbon Cement Alternatives Market, by Application, 2023-2032 (USD Million)
Table 97: Japan Low-Carbon Cement Alternatives Market, by End User, 2023-2032 (USD Million)
India Market
Table 98: India Low-Carbon Cement Alternatives Market, 2023-2032 (USD Million)
Table 99: India Low-Carbon Cement Alternatives Market, by Product Type, 2023-2032 (USD Million)
Table 100: India Low-Carbon Cement Alternatives Market, by Raw Material, 2023-2032 (USD Million)
Table 101: India Low-Carbon Cement Alternatives Market, by Application, 2023-2032 (USD Million)
Table 102: India Low-Carbon Cement Alternatives Market, by End User, 2023-2032 (USD Million)
Australia Market
Table 103: Australia Low-Carbon Cement Alternatives Market, 2023-2032 (USD Million)
Table 104: Australia Low-Carbon Cement Alternatives Market, by Product Type, 2023-2032 (USD Million)
Table 105: Australia Low-Carbon Cement Alternatives Market, by Raw Material, 2023-2032 (USD Million)
Table 106: Australia Low-Carbon Cement Alternatives Market, by Application, 2023-2032 (USD Million)
Table 107: Australia Low-Carbon Cement Alternatives Market, by End User, 2023-2032 (USD Million)
South Korea Market
Table 108: South Korea Low-Carbon Cement Alternatives Market, 2023-2032 (USD Million)
Table 109: South Korea Low-Carbon Cement Alternatives Market, by Product Type, 2023-2032 (USD Million)
Table 110: South Korea Low-Carbon Cement Alternatives Market, by Raw Material, 2023-2032 (USD Million)
Table 111: South Korea Low-Carbon Cement Alternatives Market, by Application, 2023-2032 (USD Million)
Table 112: South Korea Low-Carbon Cement Alternatives Market, by End User, 2023-2032 (USD Million)
Rest of Asia-Pacific Market
Table 113: Rest of Asia-Pacific Low-Carbon Cement Alternatives Market, 2023-2032 (USD Million)
Table 114: Rest of Asia-Pacific Low-Carbon Cement Alternatives Market, by Product Type, 2023-2032 (USD Million)
Table 115: Rest of Asia-Pacific Low-Carbon Cement Alternatives Market, by Raw Material, 2023-2032 (USD Million)
Table 116: Rest of Asia-Pacific Low-Carbon Cement Alternatives Market, by Application, 2023-2032 (USD Million)
Table 117: Rest of Asia-Pacific Low-Carbon Cement Alternatives Market, by End User, 2023-2032 (USD Million)
Latin America Market
Table 118: Latin America Low-Carbon Cement Alternatives Market, 2023-2032 (USD Million)
Table 119: Latin America Low-Carbon Cement Alternatives Market, by Product Type, 2023-2032 (USD Million)
Table 120: Latin America Low-Carbon Cement Alternatives Market, by Raw Material, 2023-2032 (USD Million)
Table 121: Latin America Low-Carbon Cement Alternatives Market, by Application, 2023-2032 (USD Million)
Table 122: Latin America Low-Carbon Cement Alternatives Market, by End User, 2023-2032 (USD Million)
Table 123: Latin America Low-Carbon Cement Alternatives Market, by Country, 2023-2032 (USD Million)
Brazil Market
Table 124: Brazil Low-Carbon Cement Alternatives Market, 2023-2032 (USD Million)
Table 125: Brazil Low-Carbon Cement Alternatives Market, by Product Type, 2023-2032 (USD Million)
Table 126: Brazil Low-Carbon Cement Alternatives Market, by Raw Material, 2023-2032 (USD Million)
Table 127: Brazil Low-Carbon Cement Alternatives Market, by Application, 2023-2032 (USD Million)
Table 128: Brazil Low-Carbon Cement Alternatives Market, by End User, 2023-2032 (USD Million)
Mexico Market
Table 129: Mexico Low-Carbon Cement Alternatives Market, 2023-2032 (USD Million)
Table 130: Mexico Low-Carbon Cement Alternatives Market, by Product Type, 2023-2032 (USD Million)
Table 131: Mexico Low-Carbon Cement Alternatives Market, by Raw Material, 2023-2032 (USD Million)
Table 132: Mexico Low-Carbon Cement Alternatives Market, by Application, 2023-2032 (USD Million)
Table 133: Mexico Low-Carbon Cement Alternatives Market, by End User, 2023-2032 (USD Million)
Rest of Latin America Market
Table 134: Rest of Latin America Low-Carbon Cement Alternatives Market, 2023-2032 (USD Million)
Table 135: Rest of Latin America Low-Carbon Cement Alternatives Market, by Product Type, 2023-2032 (USD Million)
Table 136: Rest of Latin America Low-Carbon Cement Alternatives Market, by Raw Material, 2023-2032 (USD Million)
Table 137: Rest of Latin America Low-Carbon Cement Alternatives Market, by Application, 2023-2032 (USD Million)
Table 138: Rest of Latin America Low-Carbon Cement Alternatives Market, by End User, 2023-2032 (USD Million)
Middle East & Africa Market
Table 139: Middle East & Africa Low-Carbon Cement Alternatives Market, 2023-2032 (USD Million)
Table 140: Middle East & Africa Low-Carbon Cement Alternatives Market, by Product Type, 2023-2032 (USD Million)
Table 141: Middle East & Africa Low-Carbon Cement Alternatives Market, by Raw Material, 2023-2032 (USD Million)
Table 142: Middle East & Africa Low-Carbon Cement Alternatives Market, by Application, 2023-2032 (USD Million)
Table 143: Middle East & Africa Low-Carbon Cement Alternatives Market, by End User, 2023-2032 (USD Million)
Table 144: Middle East & Africa Low-Carbon Cement Alternatives Market, by Country, 2023-2032 (USD Million)
Saudi Arabia Market
Table 145: Saudi Arabia Low-Carbon Cement Alternatives Market, 2023-2032 (USD Million)
Table 146: Saudi Arabia Low-Carbon Cement Alternatives Market, by Product Type, 2023-2032 (USD Million)
Table 147: Saudi Arabia Low-Carbon Cement Alternatives Market, by Raw Material, 2023-2032 (USD Million)
Table 148: Saudi Arabia Low-Carbon Cement Alternatives Market, by Application, 2023-2032 (USD Million)
Table 149: Saudi Arabia Low-Carbon Cement Alternatives Market, by End User, 2023-2032 (USD Million)
UAE Market
Table 150: UAE Low-Carbon Cement Alternatives Market, 2023-2032 (USD Million)
Table 151: UAE Low-Carbon Cement Alternatives Market, by Product Type, 2023-2032 (USD Million)
Table 152: UAE Low-Carbon Cement Alternatives Market, by Raw Material, 2023-2032 (USD Million)
Table 153: UAE Low-Carbon Cement Alternatives Market, by Application, 2023-2032 (USD Million)
Table 154: UAE Low-Carbon Cement Alternatives Market, by End User, 2023-2032 (USD Million)
Rest of Middle East & Africa Market
Table 155: Rest of Middle East & Africa Low-Carbon Cement Alternatives Market, 2023-2032 (USD Million)
Table 156: Rest of Middle East & Africa Low-Carbon Cement Alternatives Market, by Product Type, 2023-2032 (USD Million)
Table 157: Rest of Middle East & Africa Low-Carbon Cement Alternatives Market, by Raw Material, 2023-2032 (USD Million)
Table 158: Rest of Middle East & Africa Low-Carbon Cement Alternatives Market, by Application, 2023-2032 (USD Million)
Table 159: Rest of Middle East & Africa Low-Carbon Cement Alternatives Market, by End User, 2023-2032 (USD Million)
List of Figures
Figure 1: Global Low-Carbon Cement Alternatives Market Size, 2023-2032 (USD Million)
Figure 2: Global Low-Carbon Cement Alternatives Market Volume, 2023-2032 (Kilotons)
Figure 3: Global Low-Carbon Cement Alternatives Market Growth, Y-o-Y % Growth, 2023-2032
Figure 4: Global Low-Carbon Cement Alternatives Market, by Product Type, 2023 vs. 2028 vs. 2032 (%)
Figure 5: Global Low-Carbon Cement Alternatives Market, by Raw Material, 2023 vs. 2028 vs. 2032 (%)
Figure 6: Global Low-Carbon Cement Alternatives Market, by Application, 2023 vs. 2028 vs. 2032 (%)
Figure 7: Global Low-Carbon Cement Alternatives Market, by End User, 2023 vs. 2028 vs. 2032 (%)
Figure 8: Global Low-Carbon Cement Alternatives Market, by Region/Country, 2023 vs. 2028 vs. 2032 (%)
Figure 9: Impact Assessment of Market Drivers on Global Low-Carbon Cement Alternatives Market (2023-2032)
Figure 10: Impact Assessment of Market Restraints on Global Low-Carbon Cement Alternatives Market (2023-2032)
Figure 11: Impact Assessment of Market Opportunities on Global Low-Carbon Cement Alternatives Market (2023-2032)
Figure 12: Porter's Five Forces Analysis: Global Low-Carbon Cement Alternatives Market
Figure 13: North America Low-Carbon Cement Alternatives Market Size, 2023-2032 (USD Million)
Figure 14: North America Low-Carbon Cement Alternatives Market Share, by Country, 2023 vs. 2028 vs. 2032 (%)
Figure 15: Europe Low-Carbon Cement Alternatives Market Snapshot, 2023-2032 (USD Million)
Figure 16: Europe Low-Carbon Cement Alternatives Market Share, by Country, 2023 vs. 2028 vs. 2032 (%)
Figure 17: Asia-Pacific Low-Carbon Cement Alternatives Market Snapshot, 2023-2032 (USD Million)
Figure 18: Asia-Pacific Low-Carbon Cement Alternatives Market Share, by Country, 2023 vs. 2028 vs. 2032 (%)
Figure 19: Latin America Low-Carbon Cement Alternatives Market Snapshot, 2023-2032 (USD Million)
Figure 20: Latin America Low-Carbon Cement Alternatives Market Share, by Country, 2023 vs. 2028 vs. 2032 (%)
Figure 21: Middle East & Africa Low-Carbon Cement Alternatives Market Snapshot, 2023-2032 (USD Million)
Figure 22: Middle East & Africa Low-Carbon Cement Alternatives Market Share, by Country, 2023 vs. 2028 vs. 2032 (%)
Figure 23: Key Growth Strategies Adopted by Leading Players in the Global Low-Carbon Cement Alternatives Market, 2021-2025
Figure 24: Global Low-Carbon Cement Alternatives Market Share Analysis, by Key Player (2023)
Figure 25: Competitive Benchmarking of Key Players in the Global Low-Carbon Cement Alternatives Market
Figure 26: Competitive Dashboard of the Global Low-Carbon Cement Alternatives Market


Published Date: Mar-2026
Published Date: Sep-2024
Published Date: May-2024
Published Date: May-2024
Published Date: Aug-2024
Subscribe to get the latest industry updates