Resources
About Us
This comprehensive market research report analyzes the rapidly evolving Green Ammonia market, evaluating how renewable energy integration and sustainable production technologies are revolutionizing the ammonia industry across various applications and regions. The report provides a strategic analysis of market dynamics, growth projections till 2035, and competitive positioning across global and regional/country-level markets.
Key Market Drivers & Trends and Insights
Click here to: Get Free Sample Pages of this Report
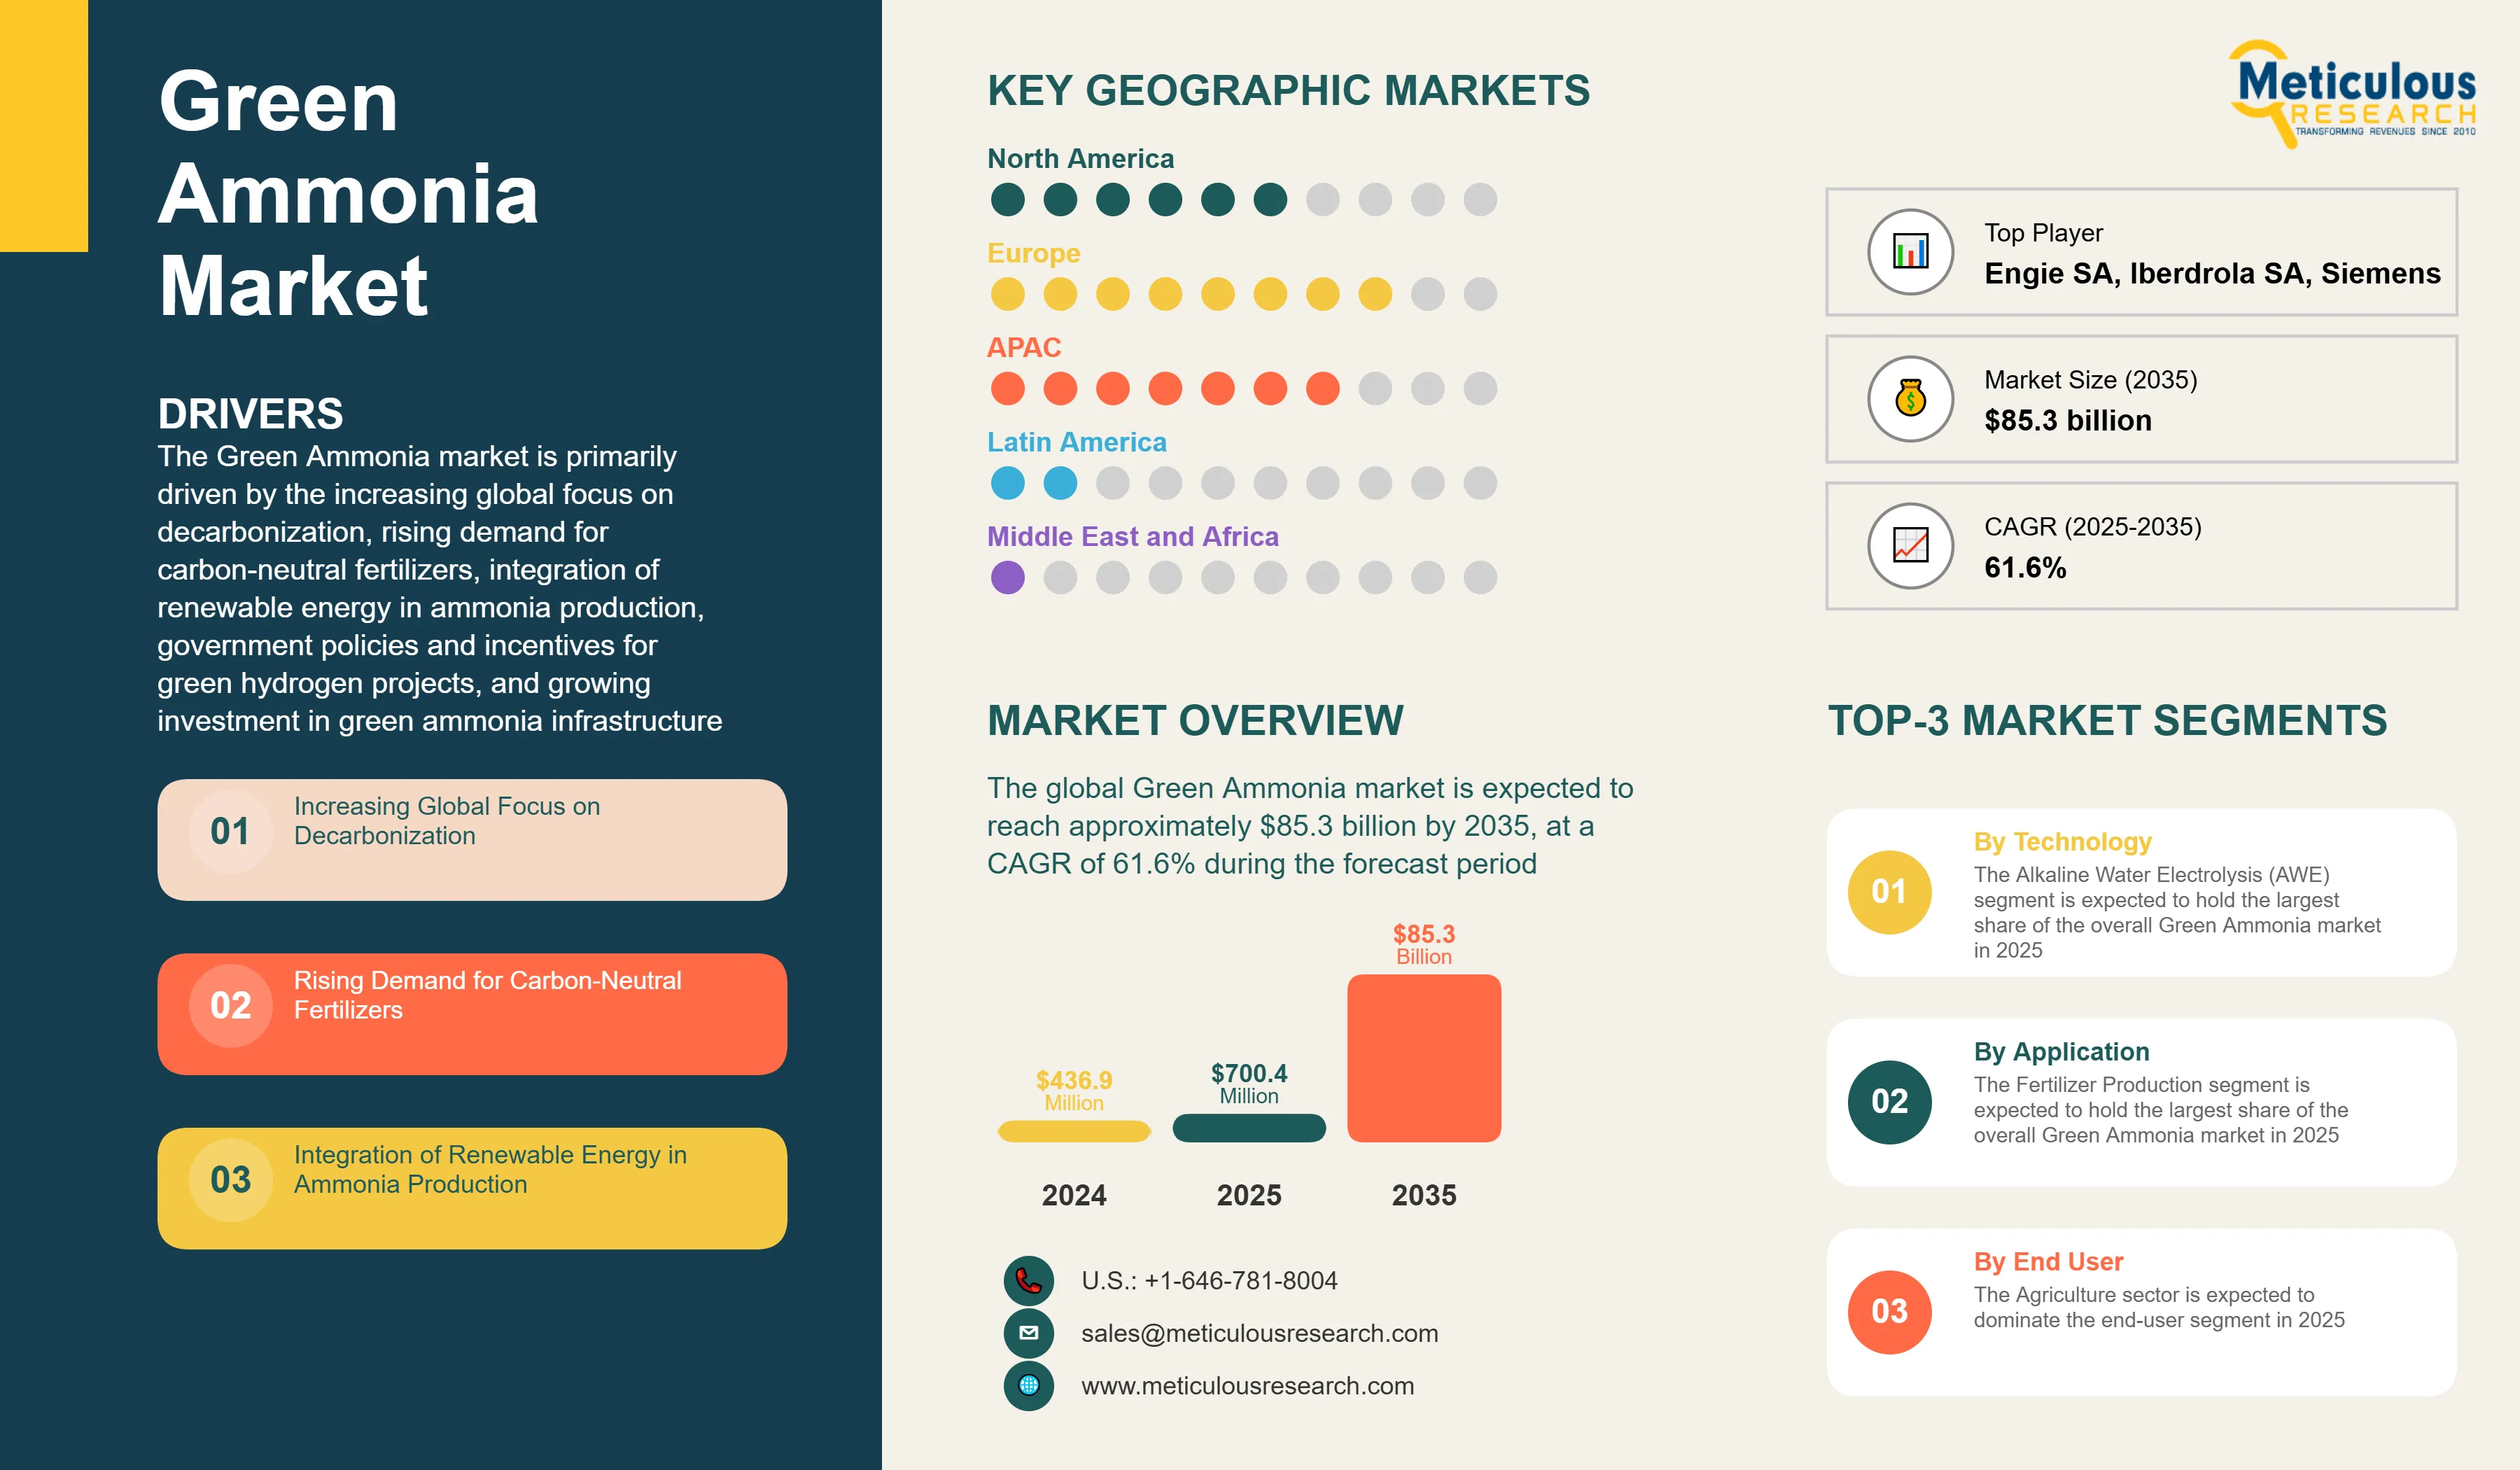
The Green Ammonia market is primarily driven by the increasing global focus on decarbonization, rising demand for carbon-neutral fertilizers, integration of renewable energy in ammonia production, government policies and incentives for green hydrogen projects, and growing investment in green ammonia infrastructure. The increasing strategic partnerships between energy and fertilizer companies are accelerating innovation, while the development of ammonia as a carbon-free marine fuel is creating new application opportunities. Additionally, the declining costs of renewable electricity, advancements in electrolysis technologies, development of ammonia-ready marine engines, and growth in carbon credit trading for green ammonia projects are further driving market growth, especially in Europe and Asia-Pacific regions.
Key Challenges
Despite significant growth potential, the overall Green Ammonia market faces challenges including high production costs compared to conventional ammonia, technical challenges in scaling production, limited infrastructure for green hydrogen supply, and the energy intensity of the ammonia synthesis process. Infrastructure development constraints, particularly renewable energy integration with ammonia plants, represent significant barriers to widespread adoption. The intermittency issues of renewable energy sources and safety concerns in handling and transportation must be addressed. Additionally, maintaining cost competitiveness with gray and blue ammonia production methods and ensuring the availability of specialized components present additional barriers, potentially slowing down market adoption in different regions across the globe.
Growth Opportunities
The Green Ammonia market offers several high-growth opportunities. Ammonia as a carbon-free marine fuel presents a significant opportunity to decarbonize the shipping industry, which is under pressure to reduce emissions. The use of ammonia as a hydrogen carrier for energy storage can solve intermittency issues in renewable energy systems. Declining costs of renewable electricity make green ammonia production increasingly economical, while advancements in electrolysis technologies improve efficiency and reduce capital expenditure. Additionally, the emergence of carbon credit trading for green ammonia projects and specialized applications in industrial decarbonization presents untapped market potential, as organizations increasingly seek innovative solutions to meet sustainability goals.
Market Segmentation Highlights
By Technology
The Alkaline Water Electrolysis (AWE) segment is expected to hold the largest share of the overall Green Ammonia market in 2025, due to its mature technology, lower costs, and established track record. Proton Exchange Membrane (PEM) Electrolysis represents the second-largest segment as it offers higher efficiency and dynamic operation capabilities suitable for integration with variable renewable energy sources. However, Solid Oxide Electrolysis (SOE) is projected to grow at the fastest CAGR through 2035 as this technology offers significantly higher electrical efficiency than other methods, making it increasingly attractive for large-scale green hydrogen production.
By Production Method
The Haber-Bosch Process with Green Hydrogen is expected to dominate the overall Green Ammonia market in 2025, driven by the maturity of the technology and compatibility with existing ammonia production infrastructure. Electrochemical Processes hold the second-largest share due to their potential for direct ammonia synthesis without separate hydrogen production. However, Photocatalytic Processes are expected to grow at the fastest CAGR during the forecast period as this technology offers the potential for direct solar-to-ammonia conversion with minimal electrical requirements. Biomass Gasification maintains a small but growing share in regions with abundant biomass resources.
By Application
The Fertilizer Production segment is expected to hold the largest share of the overall Green Ammonia market in 2025, driven by the agricultural sector's push for decarbonization and consumer demand for sustainable food products. Energy Storage follows as the second-largest segment, as ammonia provides a viable solution for long-duration energy storage. However, the Marine Fuel application is projected to grow at the highest CAGR during the forecast period as the international maritime industry seeks solutions to meet IMO emissions reduction targets. Power Generation also shows strong growth potential as ammonia is increasingly recognized as a viable carbon-free fuel for conventional and fuel cell power generation.
By End User
The Agriculture sector is expected to dominate the end-user segment in 2025, as it is the traditional and largest consumer of ammonia for fertilizer production. Transportation represents the second-largest segment due to the emerging use of ammonia as a marine fuel and potential applications in heavy transport. However, the Power Generation sector is expected to grow at the highest CAGR through 2035 as power producers increasingly look to ammonia as a viable solution for energy storage and carbon-free fuel. The Chemical Industry also shows strong growth potential as it integrates green ammonia as a sustainable feedstock for various chemical processes.
By Geography
Europe is expected to hold the largest share of the global Green Ammonia market in 2025, followed by Asia-Pacific. This leading position is driven by aggressive decarbonization policies, substantial government support for renewable hydrogen projects, and strong industrial commitment to emissions reduction. Germany represents the largest market in Europe, while the Netherlands leads in terms of project development due to its existing ammonia infrastructure and North Sea renewable energy potential. However, the Asia-Pacific region, particularly Australia, Japan, and China, is projected to witness the highest CAGR during the forecast period 2025-2035, driven by abundant renewable resources, export-oriented project development, and significant investments in green hydrogen infrastructure. The Middle East region shows promising growth potential as countries like Saudi Arabia and the UAE leverage their solar resources and existing ammonia production capabilities to position themselves as future green ammonia exporters.
Competitive Landscape
The global Green Ammonia market features a diverse competitive landscape with established fertilizer and chemical manufacturers competing alongside renewable energy developers and engineering firms.
The broader solution provider landscape is categorized into traditional ammonia producers pivoting to green production and renewable energy specialists entering the ammonia value chain, with each group employing distinctive strategies to maintain competitive advantage. Leading providers are focusing on integrated solutions that combine renewable energy generation with ammonia production facilities and developing specialized applications while navigating regulatory frameworks.
The key players operating in the global Green Ammonia market are Yara International ASA, CF Industries Holdings, Inc., BASF SE, Siemens Energy AG, ThyssenKrupp AG, Fertiglobe (OCI N.V. & ADNOC), Haldor Topsoe A/S, Nel ASA, Engie SA, Air Products and Chemicals, Inc., Iberdrola SA, Fortescue Future Industries, ACME Group, MAN Energy Solutions SE, and Ørsted A/S, among others.
|
Particulars |
Details |
|
Number of Pages |
185 |
|
Format |
PDF & Excel |
|
Forecast Period |
2025–2035 |
|
Base Year |
2024 |
|
CAGR (Value) |
61.6% |
|
Market Size (Value)in 2025 |
$700.4 million |
|
Market Size (Value) in 2035 |
$85.2 billion |
|
Segments Covered |
By Technology
By Production Method
By Application
By End User
|
|
Countries Covered |
North America (U.S., Canada), Europe (Germany, Netherlands, United Kingdom (U.K.), Norway, Denmark, Spain, Rest of Europe), Asia-Pacific (Australia, Japan, China, South Korea, India, Singapore, Rest of Asia-Pacific), Latin America (Brazil, Chile, Mexico, Rest of Latin America), Middle East & Africa (Saudi Arabia, United Arab Emirates (UAE), Morocco, Egypt, Rest of Middle East & Africa) |
|
Key Companies |
Traditional Ammonia Producers: Yara International ASA, CF Industries Holdings, Inc., BASF SE, Fertiglobe (OCI N.V. & ADNOC), Air Products and Chemicals, Inc. Technology and Engineering Firms: Siemens Energy AG, ThyssenKrupp AG, Haldor Topsoe A/S, Nel ASA Renewable Energy Players: Engie SA, Iberdrola SA, Fortescue Future Industries, ACME Group, Ørsted A/S Marine and Transport Specialists: MAN Energy Solutions SE |
The global Green Ammonia market was valued at $436.9 million in 2024 and is expected to reach approximately $85.3 billion by 2035, growing from an estimated $700.4 million in 2025, at a CAGR of 61.6% during the forecast period of 2025–2035.
The global Green Ammonia market is expected to grow at a CAGR of 61.6% during the forecast period of 2025–2035.
The global Green Ammonia market is expected to reach approximately $85.3 billion by 2035, growing from an estimated $700.2 million in 2025, at a CAGR of 61.6% during the forecast period of 2025–2035.
The key companies operating in this market include Yara International ASA, CF Industries Holdings, Inc., BASF SE, Siemens Energy AG, ThyssenKrupp AG, Fertiglobe (OCI N.V. & ADNOC), Haldor Topsoe A/S, Nel ASA, Engie SA, Air Products and Chemicals, Inc., Iberdrola SA, Fortescue Future Industries, ACME Group, MAN Energy Solutions SE, and Ørsted A/S among others.
Major trends shaping the market include strategic partnerships between energy and fertilizer companies, integration of AI and IoT in production optimization, development of ammonia-ready marine engines, and growth in carbon credit trading for green ammonia projects.
• In 2025, the Alkaline Water Electrolysis (AWE) segment is expected to dominate the overall Green Ammonia market by technology type, accounting for approximately 47% of market value.
• Based on production method, the Haber-Bosch Process with Green Hydrogen is expected to hold the largest share of the overall Green Ammonia market in 2025.
• Based on application, the Fertilizer Production segment is expected to hold the largest share of the global Green Ammonia market in 2025.
• Agriculture is expected to be the largest end-user segment, accounting for 49% of market value in 2025.
• Solid Oxide Electrolysis (SOE) is projected to grow at the highest CAGR of 18.2% in the technology segment through 2035.
• Photocatalytic Process is expected to grow at the highest CAGR of 19.5% during the forecast period among production methods.
• Marine Fuel applications are projected to grow at the highest CAGR of 22.6% during the forecast period.
Europe is expected to hold the largest share of the global Green Ammonia market in 2025, followed by Asia-Pacific. This is driven by aggressive decarbonization policies, substantial government support for renewable hydrogen projects, and strong industrial commitment to emissions reduction. However, the Asia-Pacific region is projected to grow at the highest CAGR of 16.4% during the forecast period.
The growth of this market is driven by increasing global focus on decarbonization, rising demand for carbon-neutral fertilizers, integration of renewable energy in ammonia production, government policies and incentives for green hydrogen projects, and growing investment in green ammonia infrastructure
1. Market Definition & Scope
1.1. Market Definition
1.2. Market Ecosystem
1.3. Currency & Pricing
1.4. Key Stakeholders
2. Research Methodology
2.1. Research Approach
2.2. Process of Data Collection and Validation
2.2.1. Secondary Research
2.2.2. Primary Research/Interviews with Key Opinion Leaders
2.3. Market Sizing and Forecast
2.3.1. Market Size Estimation Approach
2.3.2. Bottom-up Approach
2.3.3. Top-down Approach
2.3.4. Growth Forecast Approach
2.3.5. Assumptions for the Study
3. Executive Summary
3.1. Market Overview
3.2. Segmental Analysis
3.2.1. Green Ammonia Market, by Technology
3.2.2. Green Ammonia Market, by Production Method
3.2.3. Green Ammonia Market, by Application
3.2.4. Green Ammonia Market, by End User
3.2.5. Green Ammonia Market, by Geography
3.3. Competitive Landscape
4. Market Insights
4.1. Market Overview
4.2. Factors Affecting Market Growth
4.2.1. Drivers
4.2.1.1. Increasing Global Focus on Decarbonization
4.2.1.2. Rising Demand for Carbon-Neutral Fertilizers
4.2.1.3. Integration of Renewable Energy in Ammonia Production
4.2.1.4. Government Policies and Incentives for Green Hydrogen Projects
4.2.1.5. Growing Investment in Green Ammonia Infrastructure
4.2.2. Restraints
4.2.2.1. High Production Costs Compared to Conventional Ammonia
4.2.2.2. Technical Challenges in Scaling Production
4.2.2.3. Limited Infrastructure for Green Hydrogen Supply
4.2.2.4. Energy Intensity of Ammonia Synthesis Process
4.2.3. Opportunities
4.2.3.1. Ammonia as a Carbon-Free Marine Fuel
4.2.3.2. Ammonia as Hydrogen Carrier for Energy Storage
4.2.3.3. Declining Costs of Renewable Electricity
4.2.3.4. Advancements in Electrolysis Technologies
4.2.4. Trends
4.2.4.1. Strategic Partnerships Between Energy and Fertilizer Companies
4.2.4.2. Integration of AI and IoT in Production Optimization
4.2.4.3. Development of Ammonia-Ready Marine Engines
4.2.4.4. Growth in Carbon Credit Trading for Green Ammonia Projects
4.2.5. Challenges
4.2.5.1. Renewable Energy Intermittency Issues
4.2.5.2. Safety Concerns in Handling and Transportation
4.2.5.3. Cost Competitiveness with Gray and Blue Ammonia
4.3. Porter's Five Forces Analysis
4.3.1. Bargaining Power of Suppliers
4.3.2. Bargaining Power of Buyers
4.3.3. Threat of Substitutes
4.3.4. Threat of New Entrants
4.3.5. Degree of Competition
4.4. Impact of Sustainability on the Green Ammonia Market
4.4.1. Carbon Emission Reduction Goals and Compliance
4.4.2. Sustainable Production Practices
4.4.3. Life Cycle Assessment of Green Ammonia Production
4.4.4. Energy Source Considerations
5. Green Ammonia Market Assessment—by Technology
5.1. Alkaline Water Electrolysis (AWE)
5.2. Proton Exchange Membrane (PEM) Electrolysis
5.3. Solid Oxide Electrolysis (SOE)
5.4. Other Technologies
6. Green Ammonia Market Assessment—by Production Method
6.1. Haber-Bosch Process with Green Hydrogen
6.2. Electrochemical Processes
6.3. Photocatalytic Process
6.4. Biomass Gasification
7. Green Ammonia Market Assessment—by Application
7.1. Fertilizer Production
7.2. Energy Storage
7.3. Marine Fuel
7.4. Power Generation
7.5. Industrial Raw Material
8. Green Ammonia Market Assessment—by End User
8.1. Agriculture
8.2. Transportation
8.3. Power Generation
8.4. Industrial Manufacturing
8.5. Chemical Industry
8.6. Mining Operations
9. Green Ammonia Market Assessment—by Geography
9.1. Overview
9.2. North America
9.2.1. U.S.
9.2.2. Canada
9.3. Europe
9.3.1. Germany
9.3.2. Netherlands
9.3.3. U.K.
9.3.4. Norway
9.3.5. Denmark
9.3.6. Spain
9.3.7. Rest of Europe (RoE)
9.4. Asia-Pacific
9.4.1. Australia
9.4.2. Japan
9.4.3. China
9.4.4. South Korea
9.4.5. India
9.4.6. Singapore
9.4.7. Rest of Asia-Pacific (RoAPAC)
9.5. Latin America
9.5.1. Brazil
9.5.2. Chile
9.5.3. Mexico
9.5.4. Rest of Latin America (RoLATAM)
9.6. Middle East & Africa
9.6.1. Saudi Arabia
9.6.2. United Arab Emirates (UAE)
9.6.3. Morocco
9.6.4. Egypt
9.6.5. Rest of Middle East & Africa (RoMEA)
10. Competitive Landscape
10.1. Overview
10.2. Key Growth Strategies
10.3. Competitive Benchmarking
10.4. Competitive Dashboard
10.4.1. Industry Leaders
10.4.2. Market Differentiators
10.4.3. Vanguards
10.4.4. Emerging Players
10.5. Market Share/Ranking Analysis, by Key Players, 2024
11. Company Profiles (Business Overview, Financial Overview, Product Portfolio, Strategic Developments, and SWOT Analysis)
11.1. Yara International ASA
11.2. CF Industries Holdings, Inc.
11.3. BASF SE
11.4. Siemens Energy AG
11.5. ThyssenKrupp AG
11.6. Fertiglobe (OCI N.V. & ADNOC)
11.7. Haldor Topsoe A/S
11.8. Nel ASA
11.9. Engie SA
11.10. Air Products and Chemicals, Inc.
11.11. Iberdrola SA
11.12. Fortescue Future Industries
11.13. ACME Group
11.14. MAN Energy Solutions SE
11.15. Ørsted A/S
12. Appendix
12.1. Available Customizations
12.2. Related Reports
List of Tables
Global Market Overview
Table 1: Global Green Ammonia Market, 2023–2035 (USD Million)
Table 2: Global Green Ammonia Market, by Technology, 2023–2035 (USD Million)
Table 3: Global Green Ammonia Market, by Production Method, 2023–2035 (USD Million)
Table 4: Global Green Ammonia Market, by Application, 2023–2035 (USD Million)
Table 5: Global Green Ammonia Market, by End User, 2023–2035 (USD Million)
Table 6: Global Green Ammonia Market, by Region/Country, 2023–2035 (USD Million)
Technology Segment
Table 7: Global Alkaline Water Electrolysis (AWE) Green Ammonia Market, by Region/Country, 2023–2035 (USD Million)
Table 8: Global Proton Exchange Membrane (PEM) Electrolysis Green Ammonia Market, by Region/Country, 2023–2035 (USD Million)
Table 9: Global Solid Oxide Electrolysis (SOE) Green Ammonia Market, by Region/Country, 2023–2035 (USD Million)
Table 10: Global Other Technologies Green Ammonia Market, by Region/Country, 2023–2035 (USD Million)
Production Method Segment
Table 11: Global Haber-Bosch Green Hydrogen Market Revenue, by Region/Country, 2023–2035 (USD Million)
Table 12: Global Electrochemical Green Ammonia Production Market Revenue, by Region/Country, 2023–2035 (USD Million)
Table 13: Global Photocatalytic Green Ammonia Production Market Revenue, by Region/Country, 2023–2035 (USD Million)
Table 14: Global Biomass Gasification Green Ammonia Production Market Revenue, by Region/Country, 2023–2035 (USD Million)
Application Segment
Table 15: Global Green Ammonia Market for Fertilizer Production, by Region/Country, 2023–2035 (USD Million)
Table 16: Global Green Ammonia Market for Energy Storage, by Region/Country, 2023–2035 (USD Million)
Table 17: Global Green Ammonia Market for Marine Fuel, by Region/Country, 2023–2035 (USD Million)
Table 18: Global Green Ammonia Market for Power Generation, by Region/Country, 2023–2035 (USD Million)
Table 19: Global Green Ammonia Market for Industrial Raw Material, by Region/Country, 2023–2035 (USD Million)
End User Segment
Table 20: Global Green Ammonia Market for Agriculture End Users, by Region/Country, 2023–2035 (USD Million)
Table 24: Global Green Ammonia Market for Transportation End Users, by Region/Country, 2023–2035 (USD Million)
Table 27: Global Green Ammonia Market for Power Generation, by Region/Country, 2023–2035 (USD Million)
Table 28: Global Green Ammonia Market for Industrial Manufacturing, by Region/Country, 2023–2035 (USD Million)
Table 29: Global Green Ammonia Market for Chemical Industry, by Region/Country, 2023–2035 (USD Million)
Table 30: Global Green Ammonia Market for Mining Operations, by Region/Country, 2023–2035 (USD Million)
North America Market
Table 31: North America Green Ammonia Market, 2023–2035 (USD Million)
Table 32: North America Green Ammonia Market, by Technology, 2023–2035 (USD Million)
Table 33: North America Green Ammonia Market, by Production Method, 2023–2035 (USD Million)
Table 34: North America Green Ammonia Market, by Application, 2023–2035 (USD Million)
Table 35: North America Green Ammonia Market, by End User, 2023–2035 (USD Million)
Table 36: North America Green Ammonia Market, by Country, 2023–2035 (USD Million)
U.S. Market
Table 37: U.S. Green Ammonia Market, 2023–2035 (USD Million)
Table 38: U.S. Green Ammonia Market, by Technology, 2023–2035 (USD Million)
Table 39: U.S. Green Ammonia Market, by Production Method, 2023–2035 (USD Million)
Table 40: U.S. Green Ammonia Market, by Application, 2023–2035 (USD Million)
Table 41: U.S. Green Ammonia Market, by End User, 2023–2035 (USD Million)
Canada Market
Table 42: Canada Green Ammonia Market, 2023–2035 (USD Million)
Table 43: Canada Green Ammonia Market, by Technology, 2023–2035 (USD Million)
Table 44: Canada Green Ammonia Market, by Production Method, 2023–2035 (USD Million)
Table 45: Canada Green Ammonia Market, by Application, 2023–2035 (USD Million)
Table 46: Canada Green Ammonia Market, by End User, 2023–2035 (USD Million)
Europe Market
Table 47: Europe Green Ammonia Market, 2023–2035 (USD Million)
Table 48: Europe Green Ammonia Market, by Technology, 2023–2035 (USD Million)
Table 49: Europe Green Ammonia Market, by Production Method, 2023–2035 (USD Million)
Table 50: Europe Green Ammonia Market, by Application, 2023–2035 (USD Million)
Table 51: Europe Green Ammonia Market, by End User, 2023–2035 (USD Million)
Table 52: Europe Green Ammonia Market, by Country, 2023–2035 (USD Million)
Germany Market
Table 53: Germany Green Ammonia Market, 2023–2035 (USD Million)
Table 54: Germany Green Ammonia Market, by Technology, 2023–2035 (USD Million)
Table 55: Germany Green Ammonia Market, by Production Method, 2023–2035 (USD Million)
Table 56: Germany Green Ammonia Market, by Application, 2023–2035 (USD Million)
Table 57: Germany Green Ammonia Market, by End User, 2023–2035 (USD Million)
Netherlands Market
Table 58: Netherlands Green Ammonia Market, 2023–2035 (USD Million)
Table 59: Netherlands Green Ammonia Market, by Technology, 2023–2035 (USD Million)
Table 60: Netherlands Green Ammonia Market, by Production Method, 2023–2035 (USD Million)
Table 61: Netherlands Green Ammonia Market, by Application, 2023–2035 (USD Million)
Table 62: Netherlands Green Ammonia Market, by End User, 2023–2035 (USD Million)
U.K. Market
Table 63: U.K. Green Ammonia Market, 2023–2035 (USD Million)
Table 64: U.K. Green Ammonia Market, by Technology, 2023–2035 (USD Million)
Table 65: U.K. Green Ammonia Market, by Production Method, 2023–2035 (USD Million)
Table 66: U.K. Green Ammonia Market, by Application, 2023–2035 (USD Million)
Table 67: U.K. Green Ammonia Market, by End User, 2023–2035 (USD Million)
Norway Market
Table 68: Norway Green Ammonia Market, 2023–2035 (USD Million)
Table 69: Norway Green Ammonia Market, by Technology, 2023–2035 (USD Million)
Table 70: Norway Green Ammonia Market, by Production Method, 2023–2035 (USD Million)
Table 71: Norway Green Ammonia Market, by Application, 2023–2035 (USD Million)
Table 72: Norway Green Ammonia Market, by End User, 2023–2035 (USD Million)
Denmark Market
Table 73: Denmark Green Ammonia Market, 2023–2035 (USD Million)
Table 74: Denmark Green Ammonia Market, by Technology, 2023–2035 (USD Million)
Table 75: Denmark Green Ammonia Market, by Production Method, 2023–2035 (USD Million)
Table 76: Denmark Green Ammonia Market, by Application, 2023–2035 (USD Million)
Table 77: Denmark Green Ammonia Market, by End User, 2023–2035 (USD Million)
Spain Market
Table 78: Spain Green Ammonia Market, 2023–2035 (USD Million)
Table 79: Spain Green Ammonia Market, by Technology, 2023–2035 (USD Million)
Table 80: Spain Green Ammonia Market, by Production Method, 2023–2035 (USD Million)
Table 81: Spain Green Ammonia Market, by Application, 2023–2035 (USD Million)
Table 82: Spain Green Ammonia Market, by End User, 2023–2035 (USD Million)
Rest of Europe Market
Table 83: Rest of Europe Green Ammonia Market, 2023–2035 (USD Million)
Table 84: Rest of Europe Green Ammonia Market, by Technology, 2023–2035 (USD Million)
Table 85: Rest of Europe Green Ammonia Market, by Production Method, 2023–2035 (USD Million)
Table 86: Rest of Europe Green Ammonia Market, by Application, 2023–2035 (USD Million)
Table 87: Rest of Europe Green Ammonia Market, by End User, 2023–2035 (USD Million)
Asia-Pacific Market
Table 88: Asia-Pacific Green Ammonia Market, 2023–2035 (USD Million)
Table 89: Asia-Pacific Green Ammonia Market, by Technology, 2023–2035 (USD Million)
Table 90: Asia-Pacific Green Ammonia Market, by Production Method, 2023–2035 (USD Million)
Table 91: Asia-Pacific Green Ammonia Market, by Application, 2023–2035 (USD Million)
Table 92: Asia-Pacific Green Ammonia Market, by End User, 2023–2035 (USD Million)
Table 93: Asia-Pacific Green Ammonia Market, by Country, 2023–2035 (USD Million)
Australia Market
Table 94: Australia Green Ammonia Market, 2023–2035 (USD Million)
Table 95: Australia Green Ammonia Market, by Technology, 2023–2035 (USD Million)
Table 96: Australia Green Ammonia Market, by Production Method, 2023–2035 (USD Million)
Table 97: Australia Green Ammonia Market, by Application, 2023–2035 (USD Million)
Table 98: Australia Green Ammonia Market, by End User, 2023–2035 (USD Million)
Japan Market
Table 99: Japan Green Ammonia Market, 2023–2035 (USD Million)
Table 100: Japan Green Ammonia Market, by Technology, 2023–2035 (USD Million)
Table 101: Japan Green Ammonia Market, by Production Method, 2023–2035 (USD Million)
Table 102: Japan Green Ammonia Market, by Application, 2023–2035 (USD Million)
Table 103: Japan Green Ammonia Market, by End User, 2023–2035 (USD Million)
China Market
Table 104: China Green Ammonia Market, 2023–2035 (USD Million)
Table 105: China Green Ammonia Market, by Technology, 2023–2035 (USD Million)
Table 106: China Green Ammonia Market, by Production Method, 2023–2035 (USD Million)
Table 107: China Green Ammonia Market, by Application, 2023–2035 (USD Million)
Table 108: China Green Ammonia Market, by End User, 2023–2035 (USD Million)
South Korea Market
Table 109: South Korea Green Ammonia Market, 2023–2035 (USD Million)
Table 110: South Korea Green Ammonia Market, by Technology, 2023–2035 (USD Million)
Table 111: South Korea Green Ammonia Market, by Production Method, 2023–2035 (USD Million)
Table 112: South Korea Green Ammonia Market, by Application, 2023–2035 (USD Million)
Table 113: South Korea Green Ammonia Market, by End User, 2023–2035 (USD Million)
India Market
Table 114: India Green Ammonia Market, 2023–2035 (USD Million)
Table 115: India Green Ammonia Market, by Technology, 2023–2035 (USD Million)
Table 116: India Green Ammonia Market, by Production Method, 2023–2035 (USD Million)
Table 117: India Green Ammonia Market, by Application, 2023–2035 (USD Million)
Table 118: India Green Ammonia Market, by End User, 2023–2035 (USD Million)
Singapore Market
Table 119: Singapore Green Ammonia Market, 2023–2035 (USD Million)
Table 120: Singapore Green Ammonia Market, by Technology, 2023–2035 (USD Million)
Table 121: Singapore Green Ammonia Market, by Production Method, 2023–2035 (USD Million)
Table 122: Singapore Green Ammonia Market, by Application, 2023–2035 (USD Million)
Table 123: Singapore Green Ammonia Market, by End User, 2023–2035 (USD Million)
Rest of Asia-Pacific Market
Table 124: Rest of Asia-Pacific Green Ammonia Market, 2023–2035 (USD Million)
Table 125: Rest of Asia-Pacific Green Ammonia Market, by Technology, 2023–2035 (USD Million)
Table 126: Rest of Asia-Pacific Green Ammonia Market, by Production Method, 2023–2035 (USD Million)
Table 127: Rest of Asia-Pacific Green Ammonia Market, by Application, 2023–2035 (USD Million)
Table 128: Rest of Asia-Pacific Green Ammonia Market, by End User, 2023–2035 (USD Million)
Latin America Market
Table 129: Latin America Green Ammonia Market, 2023–2035 (USD Million)
Table 130: Latin America Green Ammonia Market, by Technology, 2023–2035 (USD Million)
Table 131: Latin America Green Ammonia Market, by Production Method, 2023–2035 (USD Million)
Table 132: Latin America Green Ammonia Market, by Application, 2023–2035 (USD Million)
Table 133: Latin America Green Ammonia Market, by End User, 2023–2035 (USD Million)
Table 134: Latin America Green Ammonia Market, by Country, 2023–2035 (USD Million)
Brazil Market
Table 135: Brazil Green Ammonia Market, 2023–2035 (USD Million)
Table 136: Brazil Green Ammonia Market, by Technology, 2023–2035 (USD Million)
Table 137: Brazil Green Ammonia Market, by Production Method, 2023–2035 (USD Million)
Table 138: Brazil Green Ammonia Market, by Application, 2023–2035 (USD Million)
Table 139: Brazil Green Ammonia Market, by End User, 2023–2035 (USD Million)
Chile Market
Table 140: Chile Green Ammonia Market, 2023–2035 (USD Million)
Table 141: Chile Green Ammonia Market, by Technology, 2023–2035 (USD Million)
Table 142: Chile Green Ammonia Market, by Production Method, 2023–2035 (USD Million)
Table 143: Chile Green Ammonia Market, by Application, 2023–2035 (USD Million)
Table 144: Chile Green Ammonia Market, by End User, 2023–2035 (USD Million)
Mexico Market
Table 145: Mexico Green Ammonia Market, 2023–2035 (USD Million)
Table 146: Mexico Green Ammonia Market, by Technology, 2023–2035 (USD Million)
Table 147: Mexico Green Ammonia Market, by Production Method, 2023–2035 (USD Million)
Table 148: Mexico Green Ammonia Market, by Application, 2023–2035 (USD Million)
Table 149: Mexico Green Ammonia Market, by End User, 2023–2035 (USD Million)
Rest of Latin America Market
Table 150: Rest of Latin America Green Ammonia Market, 2023–2035 (USD Million)
Table 151: Rest of Latin America Green Ammonia Market, by Technology, 2023–2035 (USD Million)
Table 152: Rest of Latin America Green Ammonia Market, by Production Method, 2023–2035 (USD Million)
Table 153: Rest of Latin America Green Ammonia Market, by Application, 2023–2035 (USD Million)
Table 154: Rest of Latin America Green Ammonia Market, by End User, 2023–2035 (USD Million)
Middle East & Africa Market
Table 155: Middle East & Africa Green Ammonia Market, 2023–2035 (USD Million)
Table 156: Middle East & Africa Green Ammonia Market, by Technology, 2023–2035 (USD Million)
Table 157: Middle East & Africa Green Ammonia Market, by Production Method, 2023–2035 (USD Million)
Table 158: Middle East & Africa Green Ammonia Market, by Application, 2023–2035 (USD Million)
Table 159: Middle East & Africa Green Ammonia Market, by End User, 2023–2035 (USD Million)
Table 160: Middle East & Africa Green Ammonia Market, by Country, 2023–2035 (USD Million)
Saudi Arabia Market
Table 161: Saudi Arabia Green Ammonia Market, 2023–2035 (USD Million)
Table 162: Saudi Arabia Green Ammonia Market, by Technology, 2023–2035 (USD Million)
Table 163: Saudi Arabia Green Ammonia Market, by Production Method, 2023–2035 (USD Million)
Table 164: Saudi Arabia Green Ammonia Market, by Application, 2023–2035 (USD Million)
Table 165: Saudi Arabia Green Ammonia Market, by End User, 2023–2035 (USD Million)
United Arab Emirates (UAE) Market
Table 166: UAE Green Ammonia Market, 2023–2035 (USD Million)
Table 167: UAE Green Ammonia Market, by Technology, 2023–2035 (USD Million)
Table 168: UAE Green Ammonia Market, by Production Method, 2023–2035 (USD Million)
Table 169: UAE Green Ammonia Market, by Application, 2023–2035 (USD Million)
Table 170: UAE Green Ammonia Market, by End User, 2023–2035 (USD Million)
Morocco Market
Table 171: Morocco Green Ammonia Market, 2023–2035 (USD Million)
Table 172: Morocco Green Ammonia Market, by Technology, 2023–2035 (USD Million)
Table 173: Morocco Green Ammonia Market, by Production Method, 2023–2035 (USD Million)
Table 174: Morocco Green Ammonia Market, by Application, 2023–2035 (USD Million)
Table 175: Morocco Green Ammonia Market, by End User, 2023–2035 (USD Million)
Egypt Market
Table 176: Egypt Green Ammonia Market, 2023–2035 (USD Million)
Table 177: Egypt Green Ammonia Market, by Technology, 2023–2035 (USD Million)
Table 178: Egypt Green Ammonia Market, by Production Method, 2023–2035 (USD Million)
Table 179: Egypt Green Ammonia Market, by Application, 2023–2035 (USD Million)
Table 180: Egypt Green Ammonia Market, by End User, 2023–2035 (USD Million)
Rest of Middle East & Africa Market
Table 181: Rest of Middle East & Africa Green Ammonia Market, 2023–2035 (USD Million)
Table 182: Rest of Middle East & Africa Green Ammonia Market, by Technology, 2023–2035 (USD Million)
Table 183: Rest of Middle East & Africa Green Ammonia Market, by Production Method, 2023–2035 (USD Million)
Table 184: Rest of Middle East & Africa Green Ammonia Market, by Application, 2023–2035 (USD Million)
Table 185: Rest of Middle East & Africa Green Ammonia Market, by End User, 2023–2035 (USD Million)
List of Figures
Figure 1: Global Green Ammonia Market Size, 2023–2035 (USD Million)
Figure 2: Global Green Ammonia Market Growth, Y-o-Y % Growth, 2025-2035
Figure 3: Global Green Ammonia Market, by Technology, 2025 vs. 2032 (%)
Figure 4: Global Green Ammonia Market, by Production Method, 2025 vs. 2032 (%)
Figure 5: Global Green Ammonia Market, by Application, 2025 vs. 2032 (%)
Figure 6: Global Green Ammonia Market, by End User, 2025 vs. 2032 (%)
Figure 7: Global Green Ammonia Market, by Region/Country, 2025 vs. 2032 (%)
Figure 8: Impact Assessment of Market Drivers on Global Green Ammonia Market (2025-2032)
Figure 9: Impact Assessment of Market Restraints on Global Green Ammonia Market (2025-2032)
Figure 10: Impact Assessment of Market Opportunities on Global Green Ammonia Market (2025-2032)
Figure 11: Porter's Five Forces Analysis: Global Green Ammonia Market
Figure 12: Green Ammonia Production Capacity by Region, 2024
Figure 13: Key Regulatory Frameworks for Green Ammonia Production by Region
Figure 14: Investment Trends in Green Hydrogen and Ammonia Technology, 2022-2025
Figure 15: Renewable Integration Level in Ammonia Production by Technology
Figure 16: Electrolyzer Technology Evolution for Green Hydrogen Production, 2020-2030
Figure 17: Carbon Intensity Comparison: Green vs. Gray vs. Blue Ammonia
Figure 18: Global Marine Fuel Transition Timeline: Adoption of Ammonia, 2023–2035
Figure 19: North America Green Ammonia Market Snapshot, 2025-2035 (USD Million)
Figure 20: North America Green Ammonia Market Share, by Country, 2025 vs. 2035 (%)
Figure 21: Europe Green Ammonia Market Snapshot, 2025-2035 (USD Million)
Figure 22: Europe Green Ammonia Market Share, by Country, 2025 vs. 2035 (%)
Figure 23: Asia-Pacific Green Ammonia Market Snapshot, 2025-2035 (USD Million)
Figure 24: Asia Pacific Green Ammonia Market Share, by Country, 2025 vs. 2035 (%)
Figure 25: Latin America Green Ammonia Market Snapshot, 2025-2035 (USD Million)
Figure 26: Latin America Green Ammonia Market Share, by Country, 2025 vs. 2035 (%)
Figure 27: Middle East & Africa Green Ammonia Market Snapshot, 2025-2035 (USD Million)
Figure 28: Middle East & Africa Green Ammonia Market Share, by Country, 2025 vs. 2035 (%)


Published Date: Apr-2025
Published Date: Feb-2025
Published Date: Aug-2024
Published Date: May-2024
Published Date: May-2022
Subscribe to get the latest industry updates