Resources
About Us
This comprehensive market research report analyzes the global carbon accounting software market, evaluating how software providers are addressing increasing regulatory requirements, corporate sustainability commitments, and growing demand for emissions tracking and reporting across various industries and regions. The report provides a strategic analysis of market dynamics, growth projections till 2032, and competitive positioning across global and regional/country-level markets.
Key Market Drivers & Trends and Insights
Click here to: Get Free Sample Pages of this Report
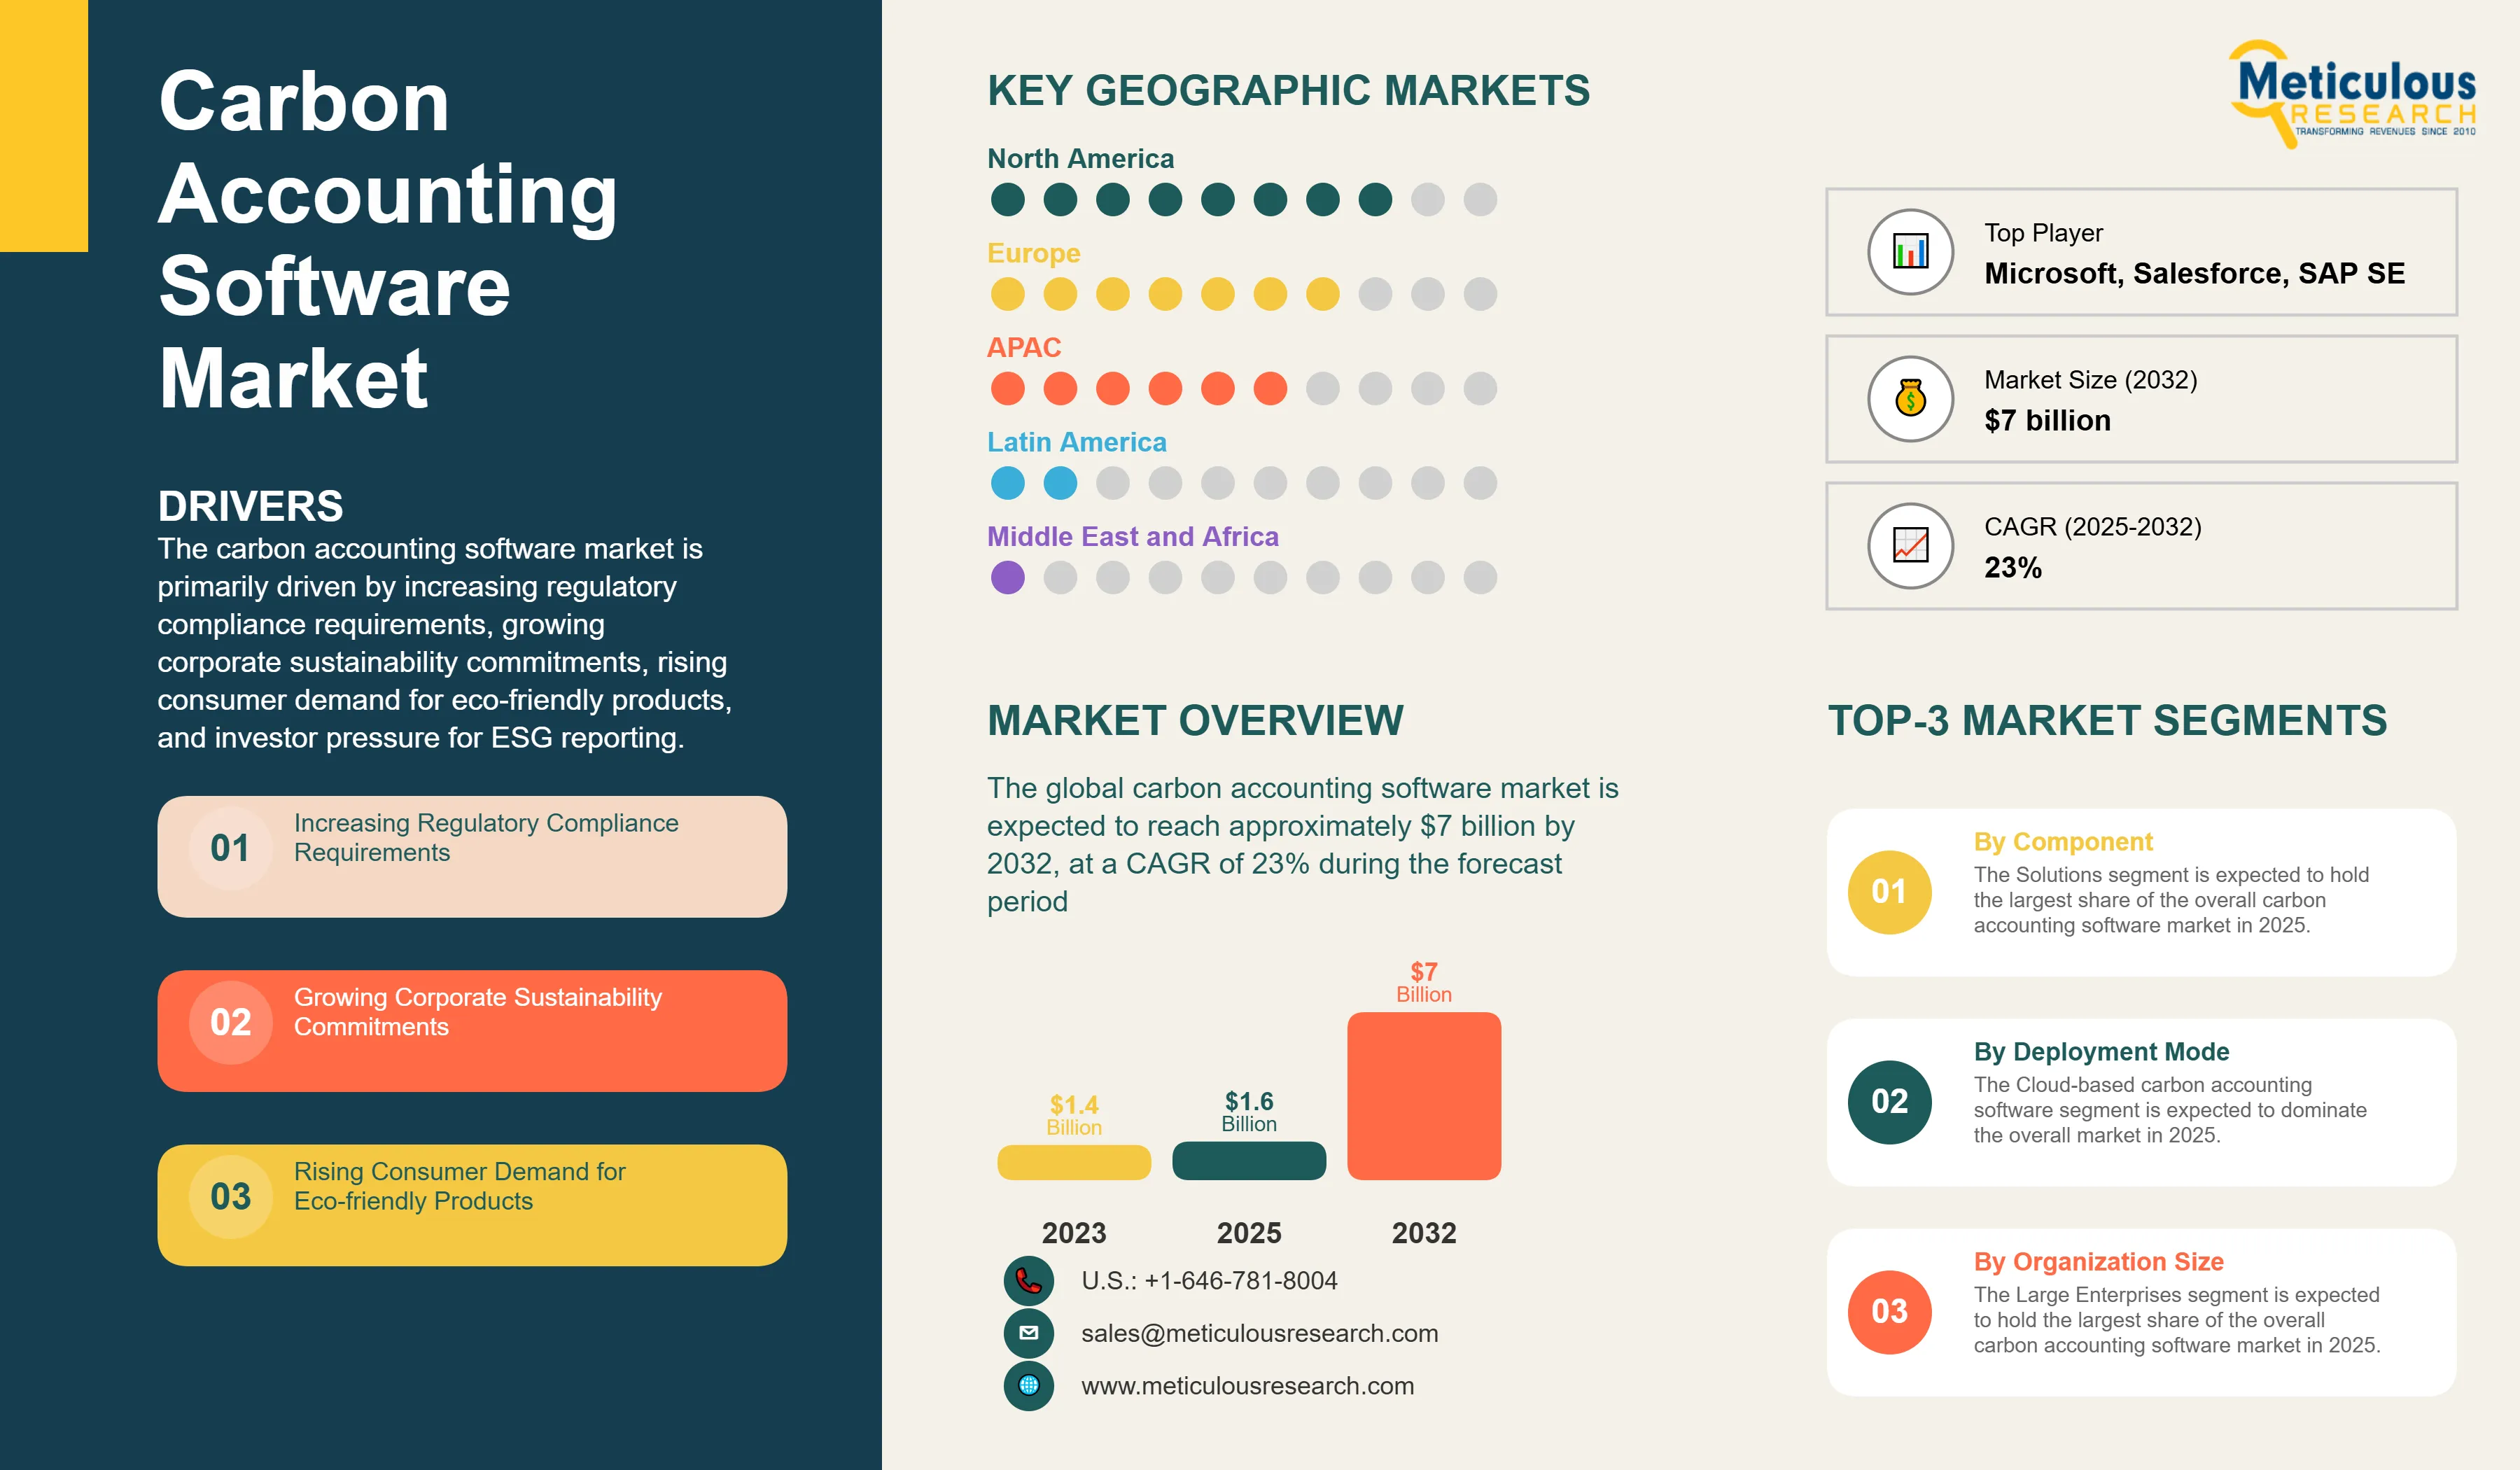
The carbon accounting software market is primarily driven by increasing regulatory compliance requirements, growing corporate sustainability commitments, rising consumer demand for eco-friendly products, and investor pressure for ESG reporting. Real-time carbon footprint monitoring is reshaping the industry, while cloud-based carbon management platforms are gaining significant traction. Additionally, advancements in data analytics and AI technologies, integration with supply chain management systems, and the development of industry-specific solutions are further driving market growth, especially in North America and Europe.
Key Challenges
Despite significant growth potential, the overall carbon accounting software market faces challenges including high implementation and maintenance costs, data quality and consistency issues, and lack of standardized reporting frameworks. Additionally, complexity in scope 3 emissions tracking, methodological complexities in emissions calculations, integration with legacy IT systems, limited expertise in carbon management, and an evolving regulatory landscape present significant barrier, potentially slowing down market adoption in different sectors across the globe.
Growth Opportunities
The carbon accounting software market offers several high-growth opportunities. AI and machine learning in carbon data analytics is driving innovation across multiple segments. Another major opportunity lies in the integration with supply chain management systems. Additionally, expansion of carbon credit trading functionalities and development of industry-specific solutions are creating new revenue streams for solution providers, as organizations increasingly seek comprehensive approaches to emissions management.
Market Segmentation Highlights
By Component
The Solutions segment is expected to hold the largest share of the overall carbon accounting software market in 2025, due to the essential role of emissions calculation and reporting tools, carbon footprint analysis, and sustainability performance management. The Services segment is expected to grow at the fastest CAGR during the forecast period, driven by increasing demand for specialized consulting, integration and deployment, support and maintenance, and training and education as organizations implement and optimize their carbon accounting programs.
By Deployment Mode
The Cloud-based carbon accounting software segment is expected to dominate the overall market in 2025, primarily due to its scalability, accessibility, and lower upfront costs. However, the Hybrid deployment mode is expected to grow at the fastest CAGR through 2032, driven by organizations seeking to balance cloud flexibility with on-premises data control and security.
By Organization Size
The Large Enterprises segment is expected to hold the largest share of the overall carbon accounting software market in 2025, as these organizations face particularly high regulatory pressures and investor scrutiny regarding their emissions. However, the Small and Medium-sized Enterprises (SMEs) segment is expected to experience the fastest growth rate during the forecast period, driven by increasing supply chain requirements, growing awareness of sustainability benefits, and the availability of more affordable, scalable solutions tailored to their needs.
By Industry Vertical
The Manufacturing segment is expected to hold the largest share of the global carbon accounting software market in 2025, driven by its significant carbon footprint and increasing regulatory requirements for emissions disclosure. The Energy and Utilities segment follows closely due to its carbon-intensive operations and regulatory focus. However, the Transportation and Logistics segment is witnessing the fastest growth rate during the forecast period, primarily driven by increasing pressure to reduce emissions in the transportation sector, evolving regulations on transport-related emissions, and growing consumer demand for sustainable shipping options.
By Geography
North America is expected to hold the largest share of the global carbon accounting software market in 2025, driven by stringent regulatory environments, high corporate sustainability adoption, and significant investment in sustainability technology innovation. Europe follows as the second-largest market, bolstered by advanced regulatory frameworks like the EU Emissions Trading System and strong public environmental consciousness. However, Asia-Pacific is witnessing the fastest growth rate during the forecast period, primarily driven by rapid industrialization, increasing regulatory pressure on emissions, and growing corporate sustainability commitments in countries like China, Japan, and India.
Competitive Landscape
The global carbon accounting software market features a diverse competitive landscape with established enterprise software providers, specialized sustainability solution developers, ESG consulting firms, and innovative startups pursuing varied approaches to carbon accounting.
The broader solution provider landscape is categorized into industry leaders, market differentiators, vanguards, and emerging players, with each group employing distinctive strategies to maintain competitive advantage. Leading providers are focusing on integrated solutions that combine carbon accounting with broader sustainability initiatives while addressing industry-specific challenges.
The key players operating in the global carbon accounting software market are Salesforce.com, Inc. (Net Zero Cloud), Microsoft Corporation (Microsoft Cloud for Sustainability), International Business Machines Corporation (IBM Environmental Intelligence Suite), SAP SE (SAP Sustainability Control Tower), Persefoni AI, Inc., Greenly SAS, Watershed Technology, Inc., Sweep SAS, Diligent Corporation (Diligent ESG), Sphera Solutions, Inc., Emitwise Ltd., IBM Corporation (Envizi), Normative Business Intelligence AB, Greenstone+ Ltd., Plan A Earth GmbH, OneTrust LLC (Planetly), CleanSpeak Corporation, Sinai Technologies Inc., and EcoVadis SAS, among others.
|
Particulars |
Details |
|
Number of Pages |
196 |
|
Format |
PDF & Excel |
|
Forecast Period |
2025–2032 |
|
Base Year |
2024 |
|
CAGR (Value) |
23% |
|
Market Size (Value)in 2025 |
USD 1.6 Billion |
|
Market Size (Value) in 2032 |
USD 7 Billion |
|
Segments Covered |
By Component: By Deployment Mode: By Organization Size: By Industry Vertical |
|
Countries Covered |
North America (U.S., Canada), Europe (Germany, France, U.K., Italy, Spain, Netherlands, Rest of Europe), Asia-Pacific (China, Japan, India, South Korea, Australia, Singapore, Rest of Asia-Pacific), Latin America (Brazil, Mexico, Argentina, Rest of Latin America), Middle East & Africa (Saudi Arabia, South Africa, UAE, Israel, Rest of Middle East & Africa) |
|
Key Companies |
Salesforce.com, Inc. (Net Zero Cloud), Microsoft Corporation (Microsoft Cloud for Sustainability), International Business Machines Corporation (IBM Environmental Intelligence Suite, Envizi), SAP SE (SAP Sustainability Control Tower), Persefoni AI, Inc., Greenly SAS, Watershed Technology, Inc., Sweep SAS, Diligent Corporation (Diligent ESG), Sphera Solutions, Inc., Emitwise Ltd., Normative Business Intelligence AB, Greenstone+ Ltd., Plan A Earth GmbH, OneTrust LLC (Planetly), CleanSpeak Corporation, Sinai Technologies Inc., EcoVadis SAS |
The global carbon accounting software market was valued at $1.4 billion in 2024. This market is expected to reach approximately $7 billion by 2032, growing from an estimated $1.6 billion in 2025, at a CAGR of 23% during the forecast period of 2025-2032.
The global carbon accounting software market is expected to grow at a CAGR of 23% during the forecast period of 2025-2032.
The global carbon accounting software market is expected to reach approximately $7 billion by 2032, growing from an estimated $1.6 billion in 2025, at a CAGR of 23% during the forecast period of 2025-2032.
The key companies operating in this market include Salesforce.com, Inc. (Net Zero Cloud), Microsoft Corporation (Microsoft Cloud for Sustainability), International Business Machines Corporation (IBM Environmental Intelligence Suite), SAP SE (SAP Sustainability Control Tower), Persefoni AI, Inc., Greenly SAS, Watershed Technology, Inc., Sweep SAS, Diligent Corporation (Diligent ESG), Sphera Solutions, Inc., Emitwise Ltd., IBM Corporation (Envizi), Normative Business Intelligence AB, Greenstone+ Ltd., Plan A Earth GmbH, OneTrust LLC (Planetly), CleanSpeak Corporation, Sinai Technologies Inc., and EcoVadis SAS.
Major trends shaping the market include increasing partnerships between software providers and sustainability consultants, rise of real-time carbon footprint monitoring, focus on user-friendly interfaces and visualization tools, and growth of Carbon Accounting as a Service (CAaaS).
• In 2025, the Solutions segment is expected to dominate the overall carbon accounting software market by component
• Based on deployment mode, the Cloud-based segment is expected to hold the largest share of the overall carbon accounting software market in 2025
• Based on organization size, the Large Enterprises segment is expected to hold the largest share of the global carbon accounting software market in 2025
• Based on industry vertical, the Manufacturing segment is expected to hold the largest share of the global carbon accounting software market in 2025
North America is expected to hold the largest share of the global carbon accounting software market in 2025, driven by stringent regulatory environments, high corporate sustainability adoption, and significant investment in sustainability technology innovation. Asia-Pacific is witnessing the fastest growth rate during the forecast period.
The growth of this market is driven by increasing regulatory compliance requirements, growing corporate sustainability commitments, rising consumer demand for eco-friendly products, investor pressure for ESG reporting, and advancements in data analytics and AI technologies.
1. Market Definition & Scope
1.1. Market Definition
1.2. Market Ecosystem
1.3. Currency & Pricing
1.4. Key Stakeholders
2. Research Methodology
2.1. Research Approach
2.2. Process of Data Collection and Validation
2.2.1. Secondary Research
2.2.2. Primary Research/Interviews with Key Opinion Leaders
2.3. Market Sizing and Forecast
2.3.1. Market Size Estimation Approach
2.3.2. Bottom-up Approach
2.3.3. Top-down Approach
2.3.4. Growth Forecast Approach
2.3.5. Assumptions for the Study
3. Executive Summary
3.1. Market Overview
3.2. Segmental Analysis
3.2.1. Carbon Accounting Software Market, by Component
3.2.2. Carbon Accounting Software Market, by Deployment Mode
3.2.3. Carbon Accounting Software Market, by Organization Size
3.2.4. Carbon Accounting Software Market, by Industry Vertical
3.2.5. Carbon Accounting Software Market, by Geography
3.3. Competitive Landscape
4. Market Insights
4.1. Market Overview
4.2. Factors Affecting Market Growth
4.2.1. Drivers
4.2.1.1. Increasing Regulatory Compliance Requirements
4.2.1.2. Growing Corporate Sustainability Commitments
4.2.1.3. Rising Consumer Demand for Eco-friendly Products
4.2.1.4. Investor Pressure for ESG Reporting
4.2.1.5. Advancements in Data Analytics and AI Technologies
4.2.2. Restraints
4.2.2.1. High Implementation and Maintenance Costs
4.2.2.2. Data Quality and Consistency Challenges
4.2.2.3. Lack of Standardized Reporting Frameworks
4.2.2.4. Complexity in Scope 3 Emissions Tracking
4.2.3. Opportunities
4.2.3.1. Integration with Supply Chain Management Systems
4.2.3.2. Expansion of Carbon Credit Trading Functionalities
4.2.3.3. Development of Industry-specific Solutions
4.2.3.4. AI and ML-powered Predictive Analytics
4.2.4. Trends
4.2.4.1. Increasing Partnerships Between Software Providers and Sustainability Consultants
4.2.4.2. Rise of Real-time Carbon Footprint Monitoring
4.2.4.3. Focus on User-friendly Interfaces and Visualization Tools
4.2.4.4. Growth of Carbon Accounting as a Service (CAaaS)
4.2.5. Challenges
4.2.5.1. Methodological Complexities in Emissions Calculations
4.2.5.2. Integration with Legacy IT Systems
4.2.5.3. Limited Expertise in Carbon Management
4.2.5.4. Evolving Regulatory Landscape
4.3. Porter's Five Forces Analysis
4.3.1. Bargaining Power of Suppliers
4.3.2. Bargaining Power of Buyers
4.3.3. Threat of Substitutes
4.3.4. Threat of New Entrants
4.3.5. Degree of Competition
4.4. Impact of Sustainability Regulations on the Carbon Accounting Software Market
4.4.1. Global Emission Disclosure Mandates
4.4.2. Carbon Pricing Mechanisms
4.4.3. Net-Zero Commitments Impact
4.4.4. ESG Reporting Standards
5. Carbon Accounting Software Market Assessment—by Component
5.1. Solutions
5.1.1. Emissions Calculation and Reporting
5.1.2. Carbon Footprint Analysis
5.1.3. Energy Data Management
5.1.4. Sustainability Performance Management
5.1.5. Carbon Credit Management
5.1.6. Scope 3 Supply Chain Emissions Management
5.2. Services
5.2.1. Consulting Services
5.2.2. Integration and Deployment
5.2.3. Support and Maintenance
5.2.4. Training and Education
6. Carbon Accounting Software Market Assessment—by Deployment Mode
6.1. Cloud-based
6.2. On-premises
6.3. Hybrid
7. Carbon Accounting Software Market Assessment—by Organization Size
7.1. Large Enterprises
7.2. Small and Medium-sized Enterprises (SMEs)
8. Carbon Accounting Software Market Assessment—by Industry Vertical
8.1. Manufacturing
8.1.1. Automotive
8.1.2. Chemical and Materials
8.1.3. Industrial Equipment
8.2. Energy and Utilities
8.2.1. Oil and Gas
8.2.2. Power Generation
8.2.3. Renewable Energy
8.3. Transportation and Logistics
8.3.1. Air Transport
8.3.2. Maritime Transport
8.3.3. Land Transport
8.4. IT and Telecommunications
8.5. Banking, Financial Services, and Insurance (BFSI)
8.6. Healthcare and Life Sciences
8.7. Retail and Consumer Goods
8.8. Government and Public Sector
8.9. Agriculture and Food
8.10. Others (Hospitality, Education, Construction)
9. Carbon Accounting Software Market Assessment—by Geography
9.1. Overview
9.2. North America
9.2.1. U.S.
9.2.2. Canada
9.3. Europe
9.3.1. Germany
9.3.2. France
9.3.3. U.K.
9.3.4. Italy
9.3.5. Spain
9.3.6. Netherlands
9.3.7. Rest of Europe (RoE)
9.4. Asia-Pacific
9.4.1. China
9.4.2. Japan
9.4.3. India
9.4.4. South Korea
9.4.5. Australia
9.4.6. Singapore
9.4.7. Rest of Asia-Pacific (RoAPAC)
9.5. Latin America
9.5.1. Brazil
9.5.2. Mexico
9.5.3. Argentina
9.5.4. Rest of Latin America (RoLATAM)
9.6. Middle East & Africa
9.6.1. Saudi Arabia
9.6.2. South Africa
9.6.3. United Arab Emirates (UAE)
9.6.4. Israel
9.6.5. Rest of Middle East & Africa (RoMEA)
10. Competitive Landscape
10.1. Overview
10.2. Key Growth Strategies
10.3. Competitive Benchmarking
10.4. Competitive Dashboard
10.4.1. Industry Leaders
10.4.2. Market Differentiators
10.4.3. Vanguards
10.4.4. Emerging Players
10.5. Market Share/Ranking Analysis, by Key Players, 2024
11. Company Profiles (Business Overview, Financial Overview, Product Portfolio, Strategic Developments, and SWOT Analysis)
11.1. Salesforce.com, Inc. (Net Zero Cloud)
11.2. Microsoft Corporation (Microsoft Cloud for Sustainability)
11.3. International Business Machines Corporation (IBM Environmental Intelligence Suite)
11.4. SAP SE (SAP Sustainability Control Tower)
11.5. Persefoni AI, Inc.
11.6. Greenly SAS
11.7. Watershed Technology, Inc.
11.8. Sweep SAS
11.9. Diligent Corporation (Diligent ESG)
11.10. Sphera Solutions, Inc.
11.11. Emitwise Ltd.
11.12. IBM Corporation (Envizi)
11.13. Normative Business Intelligence AB
11.14. Greenstone+ Ltd.
11.15. Plan A Earth GmbH
11.16. OneTrust LLC (Planetly)
11.17. CleanSpeak Corporation
11.18. Sinai Technologies Inc.
11.19. EcoVadis SAS
12. Appendix
12.1. Available Customizations
12.2. Related Reports
List of Tables
Global Market Overview
Table 1: Global Carbon Accounting Software Market, 2023-2032 (USD Million)
Table 2: Global Carbon Accounting Software Market, by Component, 2023-2032 (USD Million)
Table 3: Global Carbon Accounting Software Market, by Deployment Mode, 2023-2032 (USD Million)
Table 4: Global Carbon Accounting Software Market, by Organization Size, 2023-2032 (USD Million)
Table 5: Global Carbon Accounting Software Market, by Industry Vertical, 2023-2032 (USD Million)
Table 6: Global Carbon Accounting Software Market, by Region/Country, 2023-2032 (USD Million)
Component Segment
Table 7: Global Carbon Accounting Software Solutions Market, by Region/Country, 2023-2032 (USD Million)
Table 8: Global Emissions Calculation and Reporting Solutions Market, by Region/Country, 2023-2032 (USD Million)
Table 9: Global Carbon Footprint Analysis Solutions Market, by Region/Country, 2023-2032 (USD Million)
Table 10: Global Energy Data Management Solutions Market, by Region/Country, 2023-2032 (USD Million)
Table 11: Global Sustainability Performance Management Solutions Market, by Region/Country, 2023-2032 (USD Million)
Table 12: Global Carbon Credit Management Solutions Market, by Region/Country, 2023-2032 (USD Million)
Table 13: Global Carbon Accounting Software Services Market, by Region/Country, 2023-2032 (USD Million)
Table 14: Global Carbon Accounting Software Consulting Services Market, by Region/Country, 2023-2032 (USD Million)
Table 15: Global Carbon Accounting Software Integration and Deployment Market, by Region/Country, 2023-2032 (USD Million)
Table 16: Global Carbon Accounting Software Support and Maintenance Market, by Region/Country, 2023-2032 (USD Million)
Table 17: Global Carbon Accounting Software Training and Education Market, by Region/Country, 2023-2032 (USD Million)
Deployment Mode Segment
Table 18: Global Cloud-based Carbon Accounting Software Market, by Region/Country, 2023-2032 (USD Million)
Table 19: Global On-premises Carbon Accounting Software Market, by Region/Country, 2023-2032 (USD Million)
Table 20: Global Hybrid Carbon Accounting Software Market, by Region/Country, 2023-2032 (USD Million)
Organization Size Segment
Table 21: Global Carbon Accounting Software Market for Large Enterprises, by Region/Country, 2023-2032 (USD Million)
Table 22: Global Carbon Accounting Software Market for Small and Medium-sized Enterprises (SMEs), by Region/Country, 2023-2032 (USD Million)
Industry Vertical Segment
Table 23: Global Carbon Accounting Software Market for Manufacturing Industry, by Region/Country, 2023-2032 (USD Million)
Table 24: Global Carbon Accounting Software Market for Automotive Industry, by Region/Country, 2023-2032 (USD Million)
Table 25: Global Carbon Accounting Software Market for Chemical and Materials Industry, by Region/Country, 2023-2032 (USD Million)
Table 26: Global Carbon Accounting Software Market for Industrial Equipment, by Region/Country, 2023-2032 (USD Million)
Table 27: Global Carbon Accounting Software Market for Energy and Utilities Industry, by Region/Country, 2023-2032 (USD Million)
Table 28: Global Carbon Accounting Software Market for Oil and Gas Industry, by Region/Country, 2023-2032 (USD Million)
Table 29: Global Carbon Accounting Software Market for Power Generation Industry, by Region/Country, 2023-2032 (USD Million)
Table 30: Global Carbon Accounting Software Market for Renewable Energy Industry, by Region/Country, 2023-2032 (USD Million)
Table 31: Global Carbon Accounting Software Market for Transportation and Logistics Industry, by Region/Country, 2023-2032 (USD Million)
Table 32: Global Carbon Accounting Software Market for Air Transport Industry, by Region/Country, 2023-2032 (USD Million)
Table 33: Global Carbon Accounting Software Market for Maritime Transport Industry, by Region/Country, 2023-2032 (USD Million)
Table 34: Global Carbon Accounting Software Market for Land Transport Industry, by Region/Country, 2023-2032 (USD Million)
Table 35: Global Carbon Accounting Software Market for IT and Telecommunications Industry, by Region/Country, 2023-2032 (USD Million)
Table 36: Global Carbon Accounting Software Market for Banking, Financial Services, and Insurance (BFSI) Sector, by Region/Country, 2023-2032 (USD Million)
Table 37: Global Carbon Accounting Software Market for Healthcare and Life Sciences Industry, by Region/Country, 2023-2032 (USD Million)
Table 38: Global Carbon Accounting Software Market for Retail and Consumer Goods Industry, by Region/Country, 2023-2032 (USD Million)
Table 39: Global Carbon Accounting Software Market for Government and Public Sector, by Region/Country, 2023-2032 (USD Million)
Table 40: Global Carbon Accounting Software Market for Agriculture and Food Industry, by Region/Country, 2023-2032 (USD Million)
Table 41: Global Carbon Accounting Software Market for Other Industries, by Region/Country, 2023-2032 (USD Million)
North America Market
Table 42: North America Carbon Accounting Software Market, 2023-2032 (USD Million)
Table 43: North America Carbon Accounting Software Market, by Component, 2023-2032 (USD Million)
Table 44: North America Carbon Accounting Software Market, by Deployment Mode, 2023-2032 (USD Million)
Table 45: North America Carbon Accounting Software Market, by Organization Size, 2023-2032 (USD Million)
Table 46: North America Carbon Accounting Software Market, by Industry Vertical, 2023-2032 (USD Million)
Table 47: North America Carbon Accounting Software Market, by Country, 2023-2032 (USD Million)
U.S. Market
Table 48: U.S. Carbon Accounting Software Market, 2023-2032 (USD Million)
Table 49: U.S. Carbon Accounting Software Market, by Component, 2023-2032 (USD Million)
Table 50: U.S. Carbon Accounting Software Market, by Deployment Mode, 2023-2032 (USD Million)
Table 51: U.S. Carbon Accounting Software Market, by Organization Size, 2023-2032 (USD Million)
Table 52: U.S. Carbon Accounting Software Market, by Industry Vertical, 2023-2032 (USD Million)
Canada Market
Table 53: Canada Carbon Accounting Software Market, 2023-2032 (USD Million)
Table 54: Canada Carbon Accounting Software Market, by Component, 2023-2032 (USD Million)
Table 55: Canada Carbon Accounting Software Market, by Deployment Mode, 2023-2032 (USD Million)
Table 56: Canada Carbon Accounting Software Market, by Organization Size, 2023-2032 (USD Million)
Table 57: Canada Carbon Accounting Software Market, by Industry Vertical, 2023-2032 (USD Million)
Europe Market
Table 58: Europe Carbon Accounting Software Market, 2023-2032 (USD Million)
Table 59: Europe Carbon Accounting Software Market, by Component, 2023-2032 (USD Million)
Table 60: Europe Carbon Accounting Software Market, by Deployment Mode, 2023-2032 (USD Million)
Table 61: Europe Carbon Accounting Software Market, by Organization Size, 2023-2032 (USD Million)
Table 62: Europe Carbon Accounting Software Market, by Industry Vertical, 2023-2032 (USD Million)
Table 63: Europe Carbon Accounting Software Market, by Country, 2023-2032 (USD Million)
Germany Market
Table 64: Germany Carbon Accounting Software Market, 2023-2032 (USD Million)
Table 65: Germany Carbon Accounting Software Market, by Component, 2023-2032 (USD Million)
Table 66: Germany Carbon Accounting Software Market, by Deployment Mode, 2023-2032 (USD Million)
Table 67: Germany Carbon Accounting Software Market, by Organization Size, 2023-2032 (USD Million)
Table 68: Germany Carbon Accounting Software Market, by Industry Vertical, 2023-2032 (USD Million)
France Market
Table 69: France Carbon Accounting Software Market, 2023-2032 (USD Million)
Table 70: France Carbon Accounting Software Market, by Component, 2023-2032 (USD Million)
Table 71: France Carbon Accounting Software Market, by Deployment Mode, 2023-2032 (USD Million)
Table 72: France Carbon Accounting Software Market, by Organization Size, 2023-2032 (USD Million)
Table 73: France Carbon Accounting Software Market, by Industry Vertical, 2023-2032 (USD Million)
U.K. Market
Table 74: U.K. Carbon Accounting Software Market, 2023-2032 (USD Million)
Table 75: U.K. Carbon Accounting Software Market, by Component, 2023-2032 (USD Million)
Table 76: U.K. Carbon Accounting Software Market, by Deployment Mode, 2023-2032 (USD Million)
Table 77: U.K. Carbon Accounting Software Market, by Organization Size, 2023-2032 (USD Million)
Table 78: U.K. Carbon Accounting Software Market, by Industry Vertical, 2023-2032 (USD Million)
Italy Market
Table 79: Italy Carbon Accounting Software Market, 2023-2032 (USD Million)
Table 80: Italy Carbon Accounting Software Market, by Component, 2023-2032 (USD Million)
Table 81: Italy Carbon Accounting Software Market, by Deployment Mode, 2023-2032 (USD Million)
Table 82: Italy Carbon Accounting Software Market, by Organization Size, 2023-2032 (USD Million)
Table 83: Italy Carbon Accounting Software Market, by Industry Vertical, 2023-2032 (USD Million)
Spain Market
Table 84: Spain Carbon Accounting Software Market, 2023-2032 (USD Million)
Table 85: Spain Carbon Accounting Software Market, by Component, 2023-2032 (USD Million)
Table 86: Spain Carbon Accounting Software Market, by Deployment Mode, 2023-2032 (USD Million)
Table 87: Spain Carbon Accounting Software Market, by Organization Size, 2023-2032 (USD Million)
Table 88: Spain Carbon Accounting Software Market, by Industry Vertical, 2023-2032 (USD Million)
Netherlands Market
Table 89: Netherlands Carbon Accounting Software Market, 2023-2032 (USD Million)
Table 90: Netherlands Carbon Accounting Software Market, by Component, 2023-2032 (USD Million)
Table 91: Netherlands Carbon Accounting Software Market, by Deployment Mode, 2023-2032 (USD Million)
Table 92: Netherlands Carbon Accounting Software Market, by Organization Size, 2023-2032 (USD Million)
Table 93: Netherlands Carbon Accounting Software Market, by Industry Vertical, 2023-2032 (USD Million)
Rest of Europe Market
Table 94: Rest of Europe Carbon Accounting Software Market, 2023-2032 (USD Million)
Table 95: Rest of Europe Carbon Accounting Software Market, by Component, 2023-2032 (USD Million)
Table 96: Rest of Europe Carbon Accounting Software Market, by Deployment Mode, 2023-2032 (USD Million)
Table 97: Rest of Europe Carbon Accounting Software Market, by Organization Size, 2023-2032 (USD Million)
Table 98: Rest of Europe Carbon Accounting Software Market, by Industry Vertical, 2023-2032 (USD Million)
Asia-Pacific Market
Table 99: Asia-Pacific Carbon Accounting Software Market, 2023-2032 (USD Million)
Table 100: Asia-Pacific Carbon Accounting Software Market, by Component, 2023-2032 (USD Million)
Table 101: Asia-Pacific Carbon Accounting Software Market, by Deployment Mode, 2023-2032 (USD Million)
Table 102: Asia-Pacific Carbon Accounting Software Market, by Organization Size, 2023-2032 (USD Million)
Table 103: Asia-Pacific Carbon Accounting Software Market, by Industry Vertical, 2023-2032 (USD Million)
Table 104: Asia-Pacific Carbon Accounting Software Market, by Country, 2023-2032 (USD Million)
China Market
Table 105: China Carbon Accounting Software Market, 2023-2032 (USD Million)
Table 106: China Carbon Accounting Software Market, by Component, 2023-2032 (USD Million)
Table 107: China Carbon Accounting Software Market, by Deployment Mode, 2023-2032 (USD Million)
Table 108: China Carbon Accounting Software Market, by Organization Size, 2023-2032 (USD Million)
Table 109: China Carbon Accounting Software Market, by Industry Vertical, 2023-2032 (USD Million)
Japan Market
Table 110: Japan Carbon Accounting Software Market, 2023-2032 (USD Million)
Table 111: Japan Carbon Accounting Software Market, by Component, 2023-2032 (USD Million)
Table 112: Japan Carbon Accounting Software Market, by Deployment Mode, 2023-2032 (USD Million)
Table 113: Japan Carbon Accounting Software Market, by Organization Size, 2023-2032 (USD Million)
Table 114: Japan Carbon Accounting Software Market, by Industry Vertical, 2023-2032 (USD Million)
India Market
Table 115: India Carbon Accounting Software Market, 2023-2032 (USD Million)
Table 116: India Carbon Accounting Software Market, by Component, 2023-2032 (USD Million)
Table 117: India Carbon Accounting Software Market, by Deployment Mode, 2023-2032 (USD Million)
Table 118: India Carbon Accounting Software Market, by Organization Size, 2023-2032 (USD Million)
Table 119: India Carbon Accounting Software Market, by Industry Vertical, 2023-2032 (USD Million)
South Korea Market
Table 120: South Korea Carbon Accounting Software Market, 2023-2032 (USD Million)
Table 121: South Korea Carbon Accounting Software Market, by Component, 2023-2032 (USD Million)
Table 122: South Korea Carbon Accounting Software Market, by Deployment Mode, 2023-2032 (USD Million)
Table 123: South Korea Carbon Accounting Software Market, by Organization Size, 2023-2032 (USD Million)
Table 124: South Korea Carbon Accounting Software Market, by Industry Vertical, 2023-2032 (USD Million)
Australia Market
Table 125: Australia Carbon Accounting Software Market, 2023-2032 (USD Million)
Table 126: Australia Carbon Accounting Software Market, by Component, 2023-2032 (USD Million)
Table 127: Australia Carbon Accounting Software Market, by Deployment Mode, 2023-2032 (USD Million)
Table 128: Australia Carbon Accounting Software Market, by Organization Size, 2023-2032 (USD Million)
Table 129: Australia Carbon Accounting Software Market, by Industry Vertical, 2023-2032 (USD Million)
Singapore Market
Table 130: Singapore Carbon Accounting Software Market, 2023-2032 (USD Million)
Table 131: Singapore Carbon Accounting Software Market, by Component, 2023-2032 (USD Million)
Table 132: Singapore Carbon Accounting Software Market, by Deployment Mode, 2023-2032 (USD Million)
Table 133: Singapore Carbon Accounting Software Market, by Organization Size, 2023-2032 (USD Million)
Table 134: Singapore Carbon Accounting Software Market, by Industry Vertical, 2023-2032 (USD Million)
Rest of Asia-Pacific Market
Table 135: Rest of Asia-Pacific Carbon Accounting Software Market, 2023-2032 (USD Million)
Table 136: Rest of Asia-Pacific Carbon Accounting Software Market, by Component, 2023-2032 (USD Million)
Table 137: Rest of Asia-Pacific Carbon Accounting Software Market, by Deployment Mode, 2023-2032 (USD Million)
Table 138: Rest of Asia-Pacific Carbon Accounting Software Market, by Organization Size, 2023-2032 (USD Million)
Table 139: Rest of Asia-Pacific Carbon Accounting Software Market, by Industry Vertical, 2023-2032 (USD Million)
Latin America Market
Table 140: Latin America Carbon Accounting Software Market, 2023-2032 (USD Million)
Table 141: Latin America Carbon Accounting Software Market, by Component, 2023-2032 (USD Million)
Table 142: Latin America Carbon Accounting Software Market, by Deployment Mode, 2023-2032 (USD Million)
Table 143: Latin America Carbon Accounting Software Market, by Organization Size, 2023-2032 (USD Million)
Table 144: Latin America Carbon Accounting Software Market, by Industry Vertical, 2023-2032 (USD Million)
Table 145: Latin America Carbon Accounting Software Market, by Country, 2023-2032 (USD Million)
Brazil Market
Table 146: Brazil Carbon Accounting Software Market, 2023-2032 (USD Million)
Table 147: Brazil Carbon Accounting Software Market, by Component, 2023-2032 (USD Million)
Table 148: Brazil Carbon Accounting Software Market, by Deployment Mode, 2023-2032 (USD Million)
Table 149: Brazil Carbon Accounting Software Market, by Organization Size, 2023-2032 (USD Million)
Table 150: Brazil Carbon Accounting Software Market, by Industry Vertical, 2023-2032 (USD Million)
Mexico Market
Table 151: Mexico Carbon Accounting Software Market, 2023-2032 (USD Million)
Table 152: Mexico Carbon Accounting Software Market, by Component, 2023-2032 (USD Million)
Table 153: Mexico Carbon Accounting Software Market, by Deployment Mode, 2023-2032 (USD Million)
Table 154: Mexico Carbon Accounting Software Market, by Organization Size, 2023-2032 (USD Million)
Table 155: Mexico Carbon Accounting Software Market, by Industry Vertical, 2023-2032 (USD Million)
Argentina Market
Table 156: Argentina Carbon Accounting Software Market, 2023-2032 (USD Million)
Table 157: Argentina Carbon Accounting Software Market, by Component, 2023-2032 (USD Million)
Table 158: Argentina Carbon Accounting Software Market, by Deployment Mode, 2023-2032 (USD Million)
Table 159: Argentina Carbon Accounting Software Market, by Organization Size, 2023-2032 (USD Million)
Table 160: Argentina Carbon Accounting Software Market, by Industry Vertical, 2023-2032 (USD Million)
Rest of Latin America Market
Table 161: Rest of Latin America Carbon Accounting Software Market, 2023-2032 (USD Million)
Table 162: Rest of Latin America Carbon Accounting Software Market, by Component, 2023-2032 (USD Million)
Table 163: Rest of Latin America Carbon Accounting Software Market, by Deployment Mode, 2023-2032 (USD Million)
Table 164: Rest of Latin America Carbon Accounting Software Market, by Organization Size, 2023-2032 (USD Million)
Table 165: Rest of Latin America Carbon Accounting Software Market, by Industry Vertical, 2023-2032 (USD Million)
Middle East & Africa Market
Table 166: Middle East & Africa Carbon Accounting Software Market, 2023-2032 (USD Million)
Table 167: Middle East & Africa Carbon Accounting Software Market, by Component, 2023-2032 (USD Million)
Table 168: Middle East & Africa Carbon Accounting Software Market, by Deployment Mode, 2023-2032 (USD Million)
Table 169: Middle East & Africa Carbon Accounting Software Market, by Organization Size, 2023-2032 (USD Million)
Table 170: Middle East & Africa Carbon Accounting Software Market, by Industry Vertical, 2023-2032 (USD Million)
Table 171: Middle East & Africa Carbon Accounting Software Market, by Country, 2023-2032 (USD Million)
Saudi Arabia Market
Table 172: Saudi Arabia Carbon Accounting Software Market, 2023-2032 (USD Million)
Table 173: Saudi Arabia Carbon Accounting Software Market, by Component, 2023-2032 (USD Million)
Table 174: Saudi Arabia Carbon Accounting Software Market, by Deployment Mode, 2023-2032 (USD Million)
Table 175: Saudi Arabia Carbon Accounting Software Market, by Organization Size, 2023-2032 (USD Million)
Table 176: Saudi Arabia Carbon Accounting Software Market, by Industry Vertical, 2023-2032 (USD Million)
South Africa Market
Table 177: South Africa Carbon Accounting Software Market, 2023-2032 (USD Million)
Table 178: South Africa Carbon Accounting Software Market, by Component, 2023-2032 (USD Million)
Table 179: South Africa Carbon Accounting Software Market, by Deployment Mode, 2023-2032 (USD Million)
Table 180: South Africa Carbon Accounting Software Market, by Organization Size, 2023-2032 (USD Million)
Table 181: South Africa Carbon Accounting Software Market, by Industry Vertical, 2023-2032 (USD Million)
United Arab Emirates (UAE) Market
Table 182: UAE Carbon Accounting Software Market, 2023-2032 (USD Million)
Table 183: UAE Carbon Accounting Software Market, by Component, 2023-2032 (USD Million)
Table 184: UAE Carbon Accounting Software Market, by Deployment Mode, 2023-2032 (USD Million)
Table 185: UAE Carbon Accounting Software Market, by Organization Size, 2023-2032 (USD Million)
Table 186: UAE Carbon Accounting Software Market, by Industry Vertical, 2023-2032 (USD Million)
Israel Market
Table 187: Israel Carbon Accounting Software Market, 2023-2032 (USD Million)
Table 188: Israel Carbon Accounting Software Market, by Component, 2023-2032 (USD Million)
Table 189: Israel Carbon Accounting Software Market, by Deployment Mode, 2023-2032 (USD Million)
Table 190: Israel Carbon Accounting Software Market, by Organization Size, 2023-2032 (USD Million)
Table 191: Israel Carbon Accounting Software Market, by Industry Vertical, 2023-2032 (USD Million)
Rest of Middle East & Africa Market
Table 192: Rest of Middle East & Africa Carbon Accounting Software Market, 2023-2032 (USD Million)
Table 193: Rest of Middle East & Africa Carbon Accounting Software Market, by Component, 2023-2032 (USD Million)
Table 194: Rest of Middle East & Africa Carbon Accounting Software Market, by Deployment Mode, 2023-2032 (USD Million)
Table 195: Rest of Middle East & Africa Carbon Accounting Software Market, by Organization Size, 2023-2032 (USD Million)
Table 196: Rest of Middle East & Africa Carbon Accounting Software Market, by Industry Vertical, 2023-2032 (USD Million)
List of Figures
Figure 1: Global Carbon Accounting Software Market Size, 2023-2032 (USD Million)
Figure 2: Global Carbon Accounting Software Market Growth, Y-o-Y % Growth, 2025-2032
Figure 3: Global Carbon Accounting Software Market, by Component, 2025 vs. 2032 (%)
Figure 4: Global Carbon Accounting Software Market, by Deployment Mode, 2025 vs. 2032 (%)
Figure 5: Global Carbon Accounting Software Market, by Organization Size, 2025 vs. 2032 (%)
Figure 6: Global Carbon Accounting Software Market, by Industry Vertical, 2025 vs. 2032 (%)
Figure 7: Global Carbon Accounting Software Market, by Region/Country, 2025 vs. 2032 (%)
Figure 8: Impact Assessment of Market Drivers on Global Carbon Accounting Software Market (2025-2032)
Figure 9: Impact Assessment of Market Restraints on Global Carbon Accounting Software Market (2025-2032)
Figure 10: Impact Assessment of Market Opportunities on Global Carbon Accounting Software Market (2025-2032)
Figure 11: Porter's Five Forces Analysis: Global Carbon Accounting Software Market
Figure 12: Global Carbon Emissions Reporting Regulations by Region, 2024
Figure 13: Key Regulatory Frameworks for Carbon Accounting by Region
Figure 14: Investment Trends in Carbon Management Software
Figure 15: North America Cabon Accounting Software Market Snapshot (2025)
Figure 16: Europe Cabon Accounting Software Market Snapshot (2025)
Figure 17: Asia-Pacific Cabon Accounting Software Market Snapshot (2025)
Figure 18: Latin America Cabon Accounting Software Market Snapshot (2025)
Figure 19: Middle East & Africa Cabon Accounting Software Market Snapshot (2025)


Published Date: Apr-2026
Subscribe to get the latest industry updates