Resources
About Us
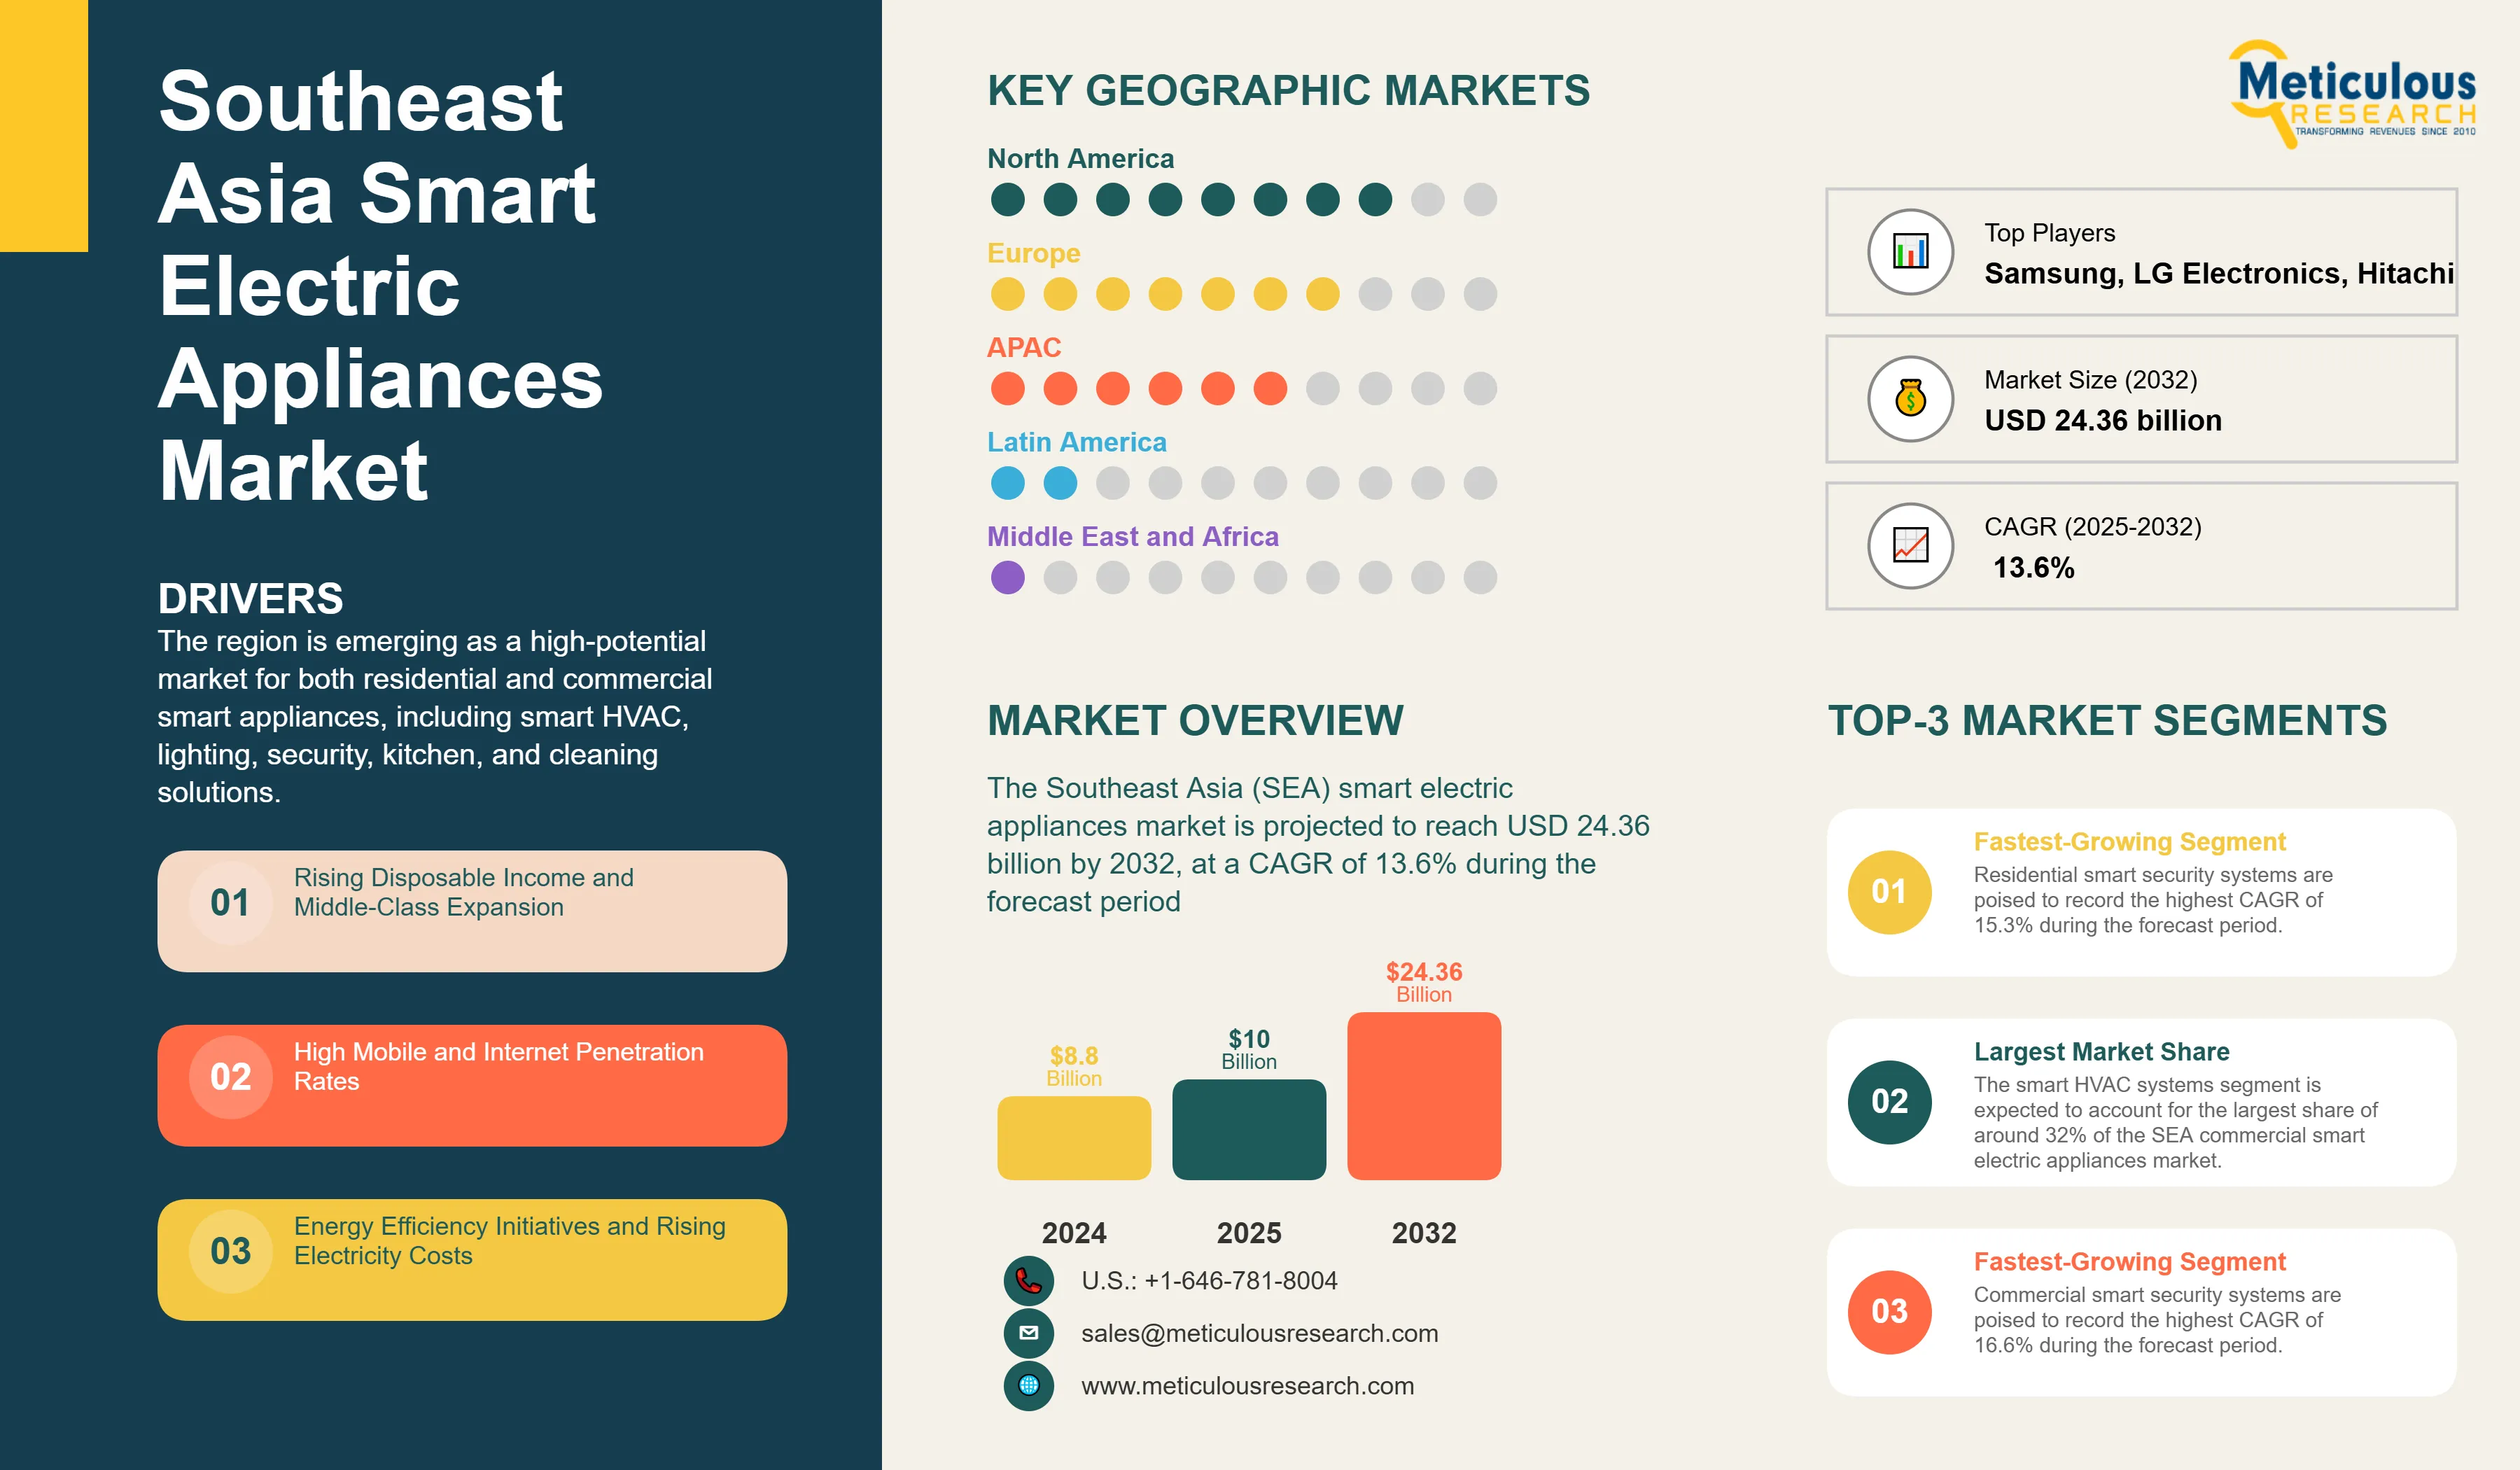
The Southeast Asia (SEA) smart electric appliances market is projected to reach USD 24.36 billion by 2032 from an estimated USD 10 billion in 2025, at a CAGR of 13.6% during the forecast period. The growth of this market is driven by several key factors, including:
The region is emerging as a high-potential market for both residential and commercial smart appliances, including smart HVAC, lighting, security, kitchen, and cleaning solutions. Moreover, technological advancements such as AI-driven appliances, IoT integration, and enhanced energy efficiency are further propelling market expansion. However, challenges like high initial costs, security concerns, and regulatory hurdles persist. Key players are actively engaging in strategic partnerships, mergers, and new product launches to strengthen their foothold in this dynamic market.
Market Segmentation and Insights
The SEA smart electric appliances market is segmented by product type (residential smart electric appliances {smart entertainment appliances, smart kitchen appliances, smart climate control, smart laundry appliances, smart cleaning appliances, smart security systems, smart lighting solutions, and smart water appliances} and commercial smart electric appliances {smart HVAC systems, smart security systems, smart lighting systems, smart office equipment, smart energy management systems, smart kitchen appliances, smart water management, and smart cleaning solutions}), and by protocols & standards (wireless protocols, wired protocols, and hybrid protocols). The study also evaluates industry competitors and analyzes the market at the country and regional levels.
Segmental Analysis
Residential Smart Electric Appliances Market
In 2025, the residential smart electric appliances segment is expected to account for a larger share of around 68% of the overall SEA smart electric appliances market and is expected to grow at a CAGR of 13% during the forecast period of 2025-2032.
Key Growth Drivers:
Fastest-Growing Segment:
Residential smart security systems are poised to record the highest CAGR of 15.3% during the forecast period. Rising concerns over personal and property security are leading consumers to adopt smart locks, surveillance cameras, and integrated alarm systems.
Commercial Smart Electric Appliances Market
The commercial smart electric appliances segment is projected to register a higher CAGR of 14.6% during the forecast period. The fast growth of this segment is driven by:
Largest Market Share:
The smart HVAC systems segment is expected to account for the largest share of around 32% of the SEA commercial smart electric appliances market. This segment is projected to grow at a CAGR of 13.3% from 2025 to 2032. The demand for energy-efficient and sustainable cooling solutions is increasing due to:
Fastest-Growing Segment:
Commercial smart security systems are poised to record the highest CAGR of 16.6% during the forecast period. The growth is driven by rising concerns over safety in commercial spaces such as offices, retail centers, and healthcare facilities.
Country-Wise Market Insights
Indonesia: Largest Market Share
In 2025, Indonesia is expected to account for the largest share of around 22% of the overall SEA smart electric appliances market. The market is projected to grow at a CAGR of 12.2% from 2025-2032, mainly driven by:
Singapore: Fastest-Growing Market:
Singapore is slated to register the highest CAGR of 15.9% during 2025–2032 in the overall SEA smart electric appliances market. The country’s rapid market growth is attributed to:
Competitive Landscape and Key Players in the SEA Smart Electric Appliances Market:
Major companies in the SEA smart electric appliances market have implemented various strategies to expand their product offerings' footprints and augment their market shares. The key strategies followed by most companies in the smart electric appliances market were product launches, expansions, mergers & acquisitions, agreements, collaborations, and partnerships. Product launches accounted for a major share of the total strategic developments from key players between 2022 and 2025 followed by expansions, and partnerships, agreements, and collaborations.
Some of the prominent players operating in the Southeast Asia smart electric appliances market and implementing various strategies to maintain their leading position in the market are Samsung Electronics Co., Ltd. (South Korea), LG Electronics Inc. (South Korea), Panasonic Holdings Corporation (Japan), Electrolux AB (Sweden), Hitachi, Ltd. (Japan), Xiaomi Corporation (China), ABB LTD. (Switzerland), Toshiba Lifestyle Products & Services Corporation (Japan), Daikin Industries, Ltd. (Japan), Schneider Electric SE (France), Johnson Controls International PLC (Ireland), Siemens AG (Germany), and Honeywell International Inc. (U.S.).
|
Particulars |
Details |
|
Number of Pages |
285 |
|
Format |
PDF & Excel |
|
Forecast Period |
2025–2032 |
|
Base Year |
2024 |
|
CAGR (Value) |
13.6% |
|
Market Size (Value)in 2025 |
USD 10 Billion |
|
Market Size (Value) in 2032 |
USD 24.36 Billion |
|
Segments Covered |
|
|
Countries Covered |
Indonesia, Vietnam, Thailand, Singapore, Malaysia, Philippines, Rest of SEA |
|
Key Companies |
Samsung Electronics Co., Ltd. (South Korea), LG Electronics Inc. (South Korea), Panasonic Holdings Corporation (Japan), Electrolux AB (Sweden), Hitachi, Ltd. (Japan), Xiaomi Corporation (China), ABB LTD. (Switzerland), Toshiba Lifestyle Products & Services Corporation (Japan), Daikin Industries, Ltd. (Japan), Schneider Electric SE (France), Johnson Controls International PLC (Ireland), Siemens AG (Germany), and Honeywell International Inc. (U.S.). |
The Southeast Asia smart electric appliances market size is estimated to be valued at $10 billion in 2025.
The market is projected to grow from $10 billion in 2025 to $24.36 billion by 2032, at a CAGR of 13.6%.
The Southeast Asia Smart Electric Appliances market analysis indicates substantial growth, with projections indicating that the market will reach $24.36 billion by 2032 at a compound annual growth rate (CAGR) of 13.6% from 2025 to 2032.
The key companies operating in this market include Samsung Electronics Co., Ltd. (South Korea), LG Electronics Inc. (South Korea), Panasonic Holdings Corporation (Japan), Electrolux AB (Sweden), Hitachi, Ltd. (Japan), Xiaomi Corporation (China), ABB LTD. (Switzerland), Toshiba Lifestyle Products & Services Corporation (Japan), Daikin Industries, Ltd. (Japan), Schneider Electric SE (France), Johnson Controls International PLC (Ireland), Siemens AG (Germany), and Honeywell International Inc. (U.S.).
Ecosystem Consolidation Around Unified Platforms and AI-Enhanced Predictive Capabilities are the prominent trends in this market
· In 2025, the residential smart electric appliances segment is expected to account for a larger share of around 68% of the SEA smart electric appliances market.
· In 2025, the smart entertainment appliances segment is expected to account for the largest share of 23.7% of the SEA residential smart electric appliances market.
· In 2025, the smart HVAC systems segment is expected to account for the largest share of 31.9% of the SEA commercial smart electric appliances market.
· In 2025, the wireless protocols segment is expected to account for the largest share of 79.3% of the SEA smart electric appliances market
In 2025, Indonesia is expected to account for the largest share of 21.7% of the SEA smart electric appliances market.
The growth of this market is driven by the rising disposable income and middle-class expansion, the high mobile and internet penetration rates, growth in tech-savvy consumers, energy efficiency initiatives and rising electricity costs, and the smart city projects across major SEA countries. The region is emerging as a high-potential market for both residential and commercial smart appliances, including smart HVAC, lighting, security, kitchen, and cleaning solutions.
1. Introduction
1.1. Market Definition
1.2. Market Ecosystem
1.3. Currency and Limitations
1.3.1. Currency
1.3.2. Limitations
1.4. Key Stakeholders
2. Research Methodology
2.1. Research Approach
2.2. Data Collection & Validation
2.2.1. Secondary Research
2.2.2. Primary Research
2.3. Market Assessment
2.3.1. Market Size Estimation
2.3.2. Bottom-Up Approach
2.3.3. Top-Down Approach
2.3.4. Growth forecast
2.4. Assumptions for the Study
3. Executive Summary
3.1. Overview
3.2. Segmental Analysis
3.2.1. Market Analysis, by Product Type
3.2.1.1. Residential Smart Electric Appliances Market Analysis, by Type
3.2.1.2. Commercial Smart Electric Appliances Market Analysis, by Type
3.2.2. Market Analysis, by Protocols & Standards
3.3. Country-Level Analysis
3.4. Competitive Analysis
4. Market Insights
4.1. Introduction
4.2. Market Dynamics
4.2.1. Drivers
4.2.1.1. Rising Disposable Income and Middle-Class Expansion
4.2.1.2. High Mobile and Internet Penetration Rates
4.2.1.3. Energy Efficiency Initiatives and Rising Electricity Costs
4.2.1.4. Smart City Projects Across Major SEA Countries
4.2.2. Restraints/Challenges
4.2.2.1. Price Sensitivity and High Premium for Smart Features
4.2.2.2. Fragmented Protocols and Interoperability Issues
4.2.2.3. Infrastructure Limitations in Developing Areas
4.2.3. Opportunities
4.2.3.1. Localization of Features for Southeast Asian Needs
4.2.3.2. Integrated Energy Management Ecosystems
4.2.3.3. Expansion into Tier-2 Cities
4.2.4. Trends
4.2.4.1. Ecosystem Consolidation Around Unified Platforms
4.2.4.2. AI-Enhanced Predictive Capabilities
4.3. Impact of AI on Southeast Asia Smart Electric Appliances Market
4.3.1. Personalized User Experiences Through Machine Learning
4.3.2. Predictive Maintenance Reducing Downtime
4.3.3. Intelligent Energy Optimization
4.3.4. Advanced Voice Recognition for Regional Languages
4.3.5. Leading Companies Driving AI Innovation in Smart Appliances
4.3.6. Global Market Opportunities in AI-Enabled Smart Appliances
4.3.6.1. Growing Adoption in Emerging Economies
4.3.6.2. Predictive Maintenance & Self-Healing Capabilities
4.3.6.3. Emotional AI & Adaptive UX
4.3.6.4. Subscription-Based AI Services
4.3.6.5. AI-Powered Energy Optimization
4.3.6.6. Integration With Renewable Energy Grids
4.3.6.7. Federated Learning & Privacy-Preserving Ai Models
4.4. Impact of Sustainability on the Smart Electric Appliances Market in Southeast Asia
4.4.1. Introduction
4.4.2. Regulatory Landscape and Government Initiatives
4.4.2.1. Energy Efficiency Regulations
4.4.2.2. Green Building and Smart City Initiatives
4.4.2.3. E-Waste and Circular Economy Policies
4.4.3. Consumer Behavior and Market Trends
4.4.3.1. Rising Demand for Eco-Friendly Appliances
4.4.3.2. Growth of Eco-Conscious Consumer Segments
4.4.3.3. Impact of ESG Considerations on Purchasing Decisions
4.4.4. Technological Innovations Driving Sustainability
4.4.4.1. Energy-Efficient Technologies in Smart Appliances
4.4.4.2. Sustainable Materials and Manufacturing Practices
4.4.4.3. IoT-Enabled Energy Management Systems
4.4.5. Corporate Sustainability Strategies
4.4.5.1. Leading Companies and Sustainability Commitments
4.4.5.2. Circular Economy and Product Lifecycle Management
4.4.5.3. Supply Chain Sustainability
4.4.6. Challenges and Future Outlook
4.4.6.1. Challenges In Achieving Sustainable Growth
4.4.6.2. Future Market Outlook and Opportunities
4.4.7. Conclusion
4.5. Porter’s Five Forces Analysis
4.5.1. Threat of New Entrants- Moderate
4.5.2. Threat of Substitutes - Low to Moderate
4.5.3. Bargaining Power of Buyers - Moderate
4.5.4. Bargaining Power of Suppliers - Moderate to High
4.5.5. Degree of Competition - High
5. SEA Smart Electric Appliances Market Assessment—by Product Type
5.1. Overview
5.2. Residential Smart Electric Appliances
5.2.1. Smart Entertainment Appliances
5.2.1.1. Smart TVs
5.2.1.2. Smart Speakers
5.2.2. Smart Kitchen Appliances
5.2.2.1. Smart Refrigerators
5.2.2.2. Smart Ovens & Microwaves
5.2.2.3. Smart Cooktops & Ranges
5.2.2.4. Smart Dishwashers
5.2.2.5. Smart Coffee Makers
5.2.3. Smart Climate Control
5.2.3.1. Smart Air Conditioners
5.2.3.2. Smart Fans
5.2.3.3. Smart Heaters
5.2.4. Smart Laundry Appliances
5.2.4.1. Smart Washing Machines
5.2.4.2. Smart Dryers
5.2.5. Smart Cleaning Appliances
5.2.5.1. Smart Vacuum Cleaners
5.2.5.2. Smart Mops & Sweepers
5.2.6. Smart Security Systems
5.2.6.1. Smart Cameras
5.2.6.2. Smart Locks
5.2.6.3. Smart Doorbells
5.2.7. Smart Lighting Solutions
5.2.7.1. Smart LED Bulbs
5.2.7.2. Smart Light Fixtures
5.2.8. Smart Water Appliances
5.2.8.1. Smart Water Heaters
5.2.8.2. Smart Faucets
5.3. Commercial Smart Electric Appliances
5.3.1. Smart HVAC Systems
5.3.1.1. Smart Air Conditioners
5.3.1.2. Smart Ventilation Systems
5.3.1.3. Smart Heating Systems
5.3.2. Smart Security Systems
5.3.2.1. Smart Access Control
5.3.2.2. Smart Surveillance Systems
5.3.3. Smart Lighting Systems
5.3.3.1. Smart LED Panels
5.3.3.2. Smart Lighting Controls
5.3.4. Smart Office Equipment
5.3.4.1. Smart Printers
5.3.4.2. Smart Conference Systems
5.3.5. Smart Energy Management Systems
5.3.5.1. Smart Meters
5.3.5.2. Smart Energy Monitoring Systems
5.3.6. Smart Kitchen Appliances
5.3.6.1. Smart Ovens
5.3.6.2. Smart Refrigerators
5.3.6.3. Smart Coffee Machines
5.3.7. Smart Water Management
5.3.7.1. Smart Water Heaters
5.3.7.2. Smart Water Purifiers
5.3.7.3. Smart Faucets
5.3.8. Smart Cleaning Solutions
5.3.8.1. Robotic Cleaners
5.3.8.2. Smart Janitorial Equipment
6. SEA Smart Electric Appliances Market Assessment–by Protocols & Standards
6.1. Overview
6.2. Wireless Protocols
6.2.1. Wi-Fi
6.2.2. Bluetooth
6.2.3. Zigbee
6.2.4. Z-Wave
6.2.5. Thread
6.2.6. EnOcean
6.3. Wired Protocols
6.3.1. Ethernet
6.3.2. BACnet
6.3.3. KNX
6.3.4. MODBUS
6.3.5. DALI
6.3.6. LONWORKS
6.4. Hybrid Protocols
6.4.1. Insteon
6.4.2. C-Bus
6.4.3. Others
7. SEA Smart Electric Appliances Market Assessment–by Country
7.1. Overview
7.2. Indonesia
7.3. Thailand
7.4. Singapore
7.5. Vietnam
7.6. Malaysia
7.7. Philippines
7.8. Rest of SEA
8. Competitive Landscape
8.1. Overview
8.2. Key Growth Strategies
8.3. Competitive Benchmarking
8.4. Competitive Dashboard
8.4.1. Industry Leaders
8.4.2. Market Differentiators
8.4.3. Vanguards
8.4.4. Emerging Companies
8.5. Market Share Analysis
8.5.1. Residential Smart Electric Appliances Market Share Analysis
8.5.2. Commercial Smart Electric Appliances Market Share Analysis
8.6. Major Regional Players
8.6.1. Residential Smart Electric Appliances Market
8.6.2. Commercial Smart Electric Appliances Market
8.7. Local Players, by Country
8.7.1. Singapore
8.7.2. Thailand
8.7.3. Malaysia
8.7.4. Indonesia
8.7.5. Vietnam
8.7.6. Philippines
8.8. Emerging Regional Brands
8.9. Protocol and Standard Specialists
9. Company Profiles
9.1. Samsung Electronics Co., Ltd.
9.2. LG Electronics Inc.
9.3. Panasonic Holdings Corporation
9.4. Electrolux AB
9.5. Hitachi, Ltd.
9.6. Honeywell International Inc.
9.7. Xiaomi Corporation
9.8. Toshiba Lifestyle Products & Services Corporation
9.9. Daikin Industries, Ltd.
9.10. Schneider Electric SE
9.11. Johnson Controls International Plc
9.12. Siemens AG
10. Appendix
10.1. Available Customization
10.2. Related Reports
List of Tables
Table 1 Currency Conversion Rate, 2020–2024
Table 2 SEA Smart Electric Appliances Market, by Product Type, 2023–2032 (USD Million)
Table 3 SEA Residential Electric Appliances Market, by Type, 2023–2032 (USD Million)
Table 4 SEA Residential Electric Appliances Market, by Country/Region, 2023–2032 (USD Million)
Table 5 SEA Residential Smart Entertainment Appliances Market, by Type, 2023–2032 (USD Million)
Table 6 SEA Residential Smart Entertainment Appliances Market, by Country/ Region, 2023–2032 (USD Million)
Table 7 SEA Residential Smart TVs Market, by Country/Region, 2023–2032 (USD Million)
Table 8 SEA Residential Smart Speakers Market, by Country/Region, 2023–2032 (USD Million)
Table 9 SEA Residential Smart Kitchen Appliances Market, by Type, 2023–2032 (USD Million)
Table 10 SEA Residential Smart Kitchen Appliances Market, by Country/Region, 2023–2032 (USD Million)
Table 11 SEA Residential Smart Refrigerators Market, by Country/Region, 2023–2032 (USD Million)
Table 12 SEA Residential Smart Ovens and Microwaves Market, by Country/Region, 2023–2032 (USD Million)
Table 13 SEA Residential Smart Cooktops and Ranges Market, by Country/Region, 2023–2032 (USD Million)
Table 14 SEA Residential Smart Dishwashers Market, by Country/Region, 2023–2032 (USD Million)
Table 15 SEA Residential Smart Coffee Maker Market, by Country/Region, 2023–2032 (USD Million)
Table 16 SEA Residential Smart Climate Control Market, by Type, 2023–2032 (USD Million)
Table 17 SEA Residential Smart Climate Control Market, by Country/Region, 2023–2032 (USD Million)
Table 18 SEA Residential Smart Air Conditioners Market, by Country/Region, 2023–2032 (USD Million)
Table 19 SEA Residential Smart Fans Market, by Country/Region, 2023–2032 (USD Million)
Table 20 SEA Residential Smart Heaters Market, by Country/Region, 2023–2032 (USD Million)
Table 21 SEA Residential Smart Laundry Appliances Market, by Type, 2023–2032 (USD Million)
Table 22 SEA Residential Smart Laundry Appliances Market, by Country/Region, 2023–2032 (USD Million)
Table 23 SEA Residential Smart Washing Machines Market, by Country/Region, 2023–2032 (USD Million)
Table 24 SEA Residential Smart Dryers Market, by Country/Region, 2023–2032 (USD Million)
Table 25 SEA Residential Smart Cleaning Appliances Market, by Type, 2023–2032 (USD Million)
Table 26 SEA Residential Smart Cleaning Appliances Market, by Country/Region, 2023–2032 (USD Million)
Table 27 SEA Residential Smart Vacuum Cleaners Market, by Country/Region, 2023–2032 (USD Million)
Table 28 SEA Residential Smart Mops and Sweepers Market, by Country/Region, 2023–2032 (USD Million)
Table 29 SEA Residential Smart Security Systems Market, by Type, 2023–2032 (USD Million)
Table 30 SEA Residential Smart Security Systems Market, by Country/Region, 2023–2032 (USD Million)
Table 31 SEA Residential Smart Cameras Market, by Country/Region, 2023–2032 (USD Million)
Table 32 SEA Residential Smart Locks Market, by Country/Region, 2023–2032 (USD Million)
Table 33 SEA Residential Smart Doorbells Market, by Country/Region, 2023–2032 (USD Million)
Table 34 SEA Residential Smart Lighting Solutions Market, by Type, 2023–2032 (USD Million)
Table 35 SEA Residential Smart Lighting Solutions Market, by Country/Region, 2023–2032 (USD Million)
Table 36 SEA Residential Smart LED Bulbs Market, by Country/Region, 2023–2032 (USD Million)
Table 37 SEA Residential Smart Light Fixtures Market, by Country/Region, 2023–2032 (USD Million)
Table 38 SEA Residential Smart Water Appliances Market, by Type, 2023–2032 (USD Million)
Table 39 SEA Residential Smart Water Appliances Market, by Country/Region, 2023–2032 (USD Million)
Table 40 SEA Residential Smart Water Heaters Market, by Country/Region, 2023–2032 (USD Million)
Table 41 SEA Residential Smart Faucets Market, by Country/Region, 2023–2032 (USD Million)
Table 42 SEA Commercial Smart Electric Appliances Market, by Type, 2023–2032 (USD Million)
Table 43 SEA Commercial Smart Electric Appliances Market, by Country/Region, 2023–2032 (USD Million)
Table 44 SEA Commercial Smart HVAC Systems Market, by Type, 2023–2032 (USD Million)
Table 45 SEA Commercial Smart HVAC Systems Market, by Country/Region, 2023–2032 (USD Million)
Table 46 SEA Commercial Smart Air Conditioners Market, by Country/Region, 2023–2032 (USD Million)
Table 47 SEA Commercial Smart Ventilation Systems Market, by Country/Region, 2023–2032 (USD Million)
Table 48 SEA Commercial Smart Heating Systems Market, by Country/Region, 2023–2032 (USD Million)
Table 49 SEA Commercial Smart Security Systems Market, by Type, 2023–2032 (USD Million)
Table 50 SEA Commercial Smart Security Systems Market, by Country/Region, 2023–2032 (USD Million)
Table 51 SEA Commercial Smart Access Control Market, by Country/Region, 2023–2032 (USD Million)
Table 52 SEA Commercial Smart Surveillance Systems Market, by Country/Region, 2023–2032 (USD Million)
Table 53 SEA Commercial Smart Lighting Systems Market, by Type, 2023–2032 (USD Million)
Table 54 SEA Commercial Smart Lighting Systems Market, by Country/Region, 2023–2032 (USD Million)
Table 55 SEA Commercial Smart LED Panels Market, by Country/Region, 2023–2032 (USD Million)
Table 56 SEA Commercial Smart Lighting Controls Market, by Country/Region, 2023–2032 (USD Million)
Table 57 SEA Commercial Smart Office Equipment Market, by Type, 2023–2032 (USD Million)
Table 58 SEA Commercial Smart Office Equipment Market, by Country/Region, 2023–2032 (USD Million)
Table 59 SEA Commercial Smart Printers Market, by Country/Region, 2023–2032 (USD Million)
Table 60 SEA Commercial Smart Conference Systems Market, by Country/Region, 2023–2032 (USD Million)
Table 61 SEA Commercial Smart Energy Management Market, by Type, 2023–2032 (USD Million)
Table 62 SEA Commercial Smart Energy Management Market, by Country/Region, 2023–2032 (USD Million)
Table 63 SEA Commercial Smart Meters Market, by Country/Region, 2023–2032 (USD Million)
Table 64 SEA Commercial Smart Energy Monitoring Systems Market, by Country/Region, 2023–2032 (USD Million)
Table 65 SEA Commercial Smart Kitchen Appliances Market, by Type, 2023–2032 (USD Million)
Table 66 SEA Commercial Smart Kitchen Appliances Market, by Country/Region, 2023–2032 (USD Million)
Table 67 SEA Commercial Smart Ovens Market, by Country/Region, 2023–2032 (USD Million)
Table 68 SEA Commercial Smart Refrigerators Market, by Country/Region, 2023–2032 (USD Million)
Table 69 SEA Commercial Smart Coffee Machines Market, by Country/Region, 2023–2032 (USD Million)
Table 70 SEA Commercial Smart Water Management Market, by Type, 2023–2032 (USD Million)
Table 71 SEA Commercial Smart Water Management Market, by Country/Region, 2023–2032 (USD Million)
Table 72 SEA Commercial Smart Water Heaters Market, by Country/Region, 2023–2032 (USD Million)
Table 73 SEA Commercial Smart Water Purifiers Market, by Country/Region, 2023–2032 (USD Million)
Table 74 SEA Commercial Smart Faucets Market, by Country/Region, 2023–2032 (USD Million)
Table 75 SEA Commercial Smart Cleaning Solutions Market, by Type, 2023–2032 (USD Million)
Table 76 SEA Commercial Smart Cleaning Solutions Market, by Country/Region, 2023–2032 (USD Million)
Table 77 SEA Commercial Smart Robotic Cleaners Market, by Country/Region, 2023–2032 (USD Million)
Table 78 SEA Commercial Smart Janitorial Equipment Market, by Country/Region, 2023–2032 (USD Million)
Table 79 SEA Smart Electric Appliances Market, by Protocol & Standards, 2023–2032 (USD Million)
Table 80 SEA Wireless Protocols-Enabled Smart Electric Appliances Market, by Type, 2023–2032 (USD Million)
Table 81 SEA Wireless Protocols-Enabled Smart Electric Appliances Market, by Country/ Region, 2023–2032 (USD Million)
Table 82 SEA Wi-Fi-Enabled Smart Electric Appliances Market, by Country/Region, 2023–2032 (USD Million)
Table 83 SEA Bluetooth-Enabled Smart Electric Appliances Market, by Country/ Region, 2023–2032 (USD Million)
Table 84 SEA Zigbee-Enabled Smart Electric Appliances Market, by Country/Region, 2023–2032 (USD Million)
Table 85 SEA Z-Wave-Enabled Smart Electric Appliances Market, by Country/ Region, 2023–2032 (USD Million)
Table 86 SEA Thread-Enabled Smart Electric Appliances Market, by Country/ Region, 2023–2032 (USD Million)
Table 87 SEA ENOCEAN-Enabled Smart Electric Appliances Market, by Country/ Region, 2023–2032 (USD Million)
Table 88 SEA Wired Protocols -Enabled Smart Electric Appliances Market, by Type, 2023–2032 (USD Million)
Table 89 SEA Wired Protocols -Enabled Smart Electric Appliances Market, by Country/ Region, 2023–2032 (USD Million)
Table 90 SEA Ethernet-Enabled Smart Electric Appliances Market, by Country/ Region, 2023–2032 (USD Million)
Table 91 SEA BACNET -Enabled Smart Electric Appliances Market, by Country/ Region, 2023–2032 (USD Million)
Table 92 SEA KNX -Enabled Smart Electric Appliances Market, by Country/Region, 2023–2032 (USD Million)
Table 93 SEA MODBUS -Enabled Smart Electric Appliances Market, by Country/ Region, 2023–2032 (USD Million)
Table 94 SEA DALI -Enabled Smart Electric Appliances Market, by Country/Region, 2023–2032 (USD Million)
Table 95 SEA LONWORKS -Enabled Smart Electric Appliances Market, by Country/ Region, 2023–2032 (USD Million)
Table 96 SEA Hybrid Protocols -Enabled Smart Electric Appliances Market, by Type, 2023–2032 (USD Million)
Table 97 SEA Hybrid Protocols -Enabled Smart Electric Appliances Market, by Country/Region, 2023–2032 (USD Million)
Table 98 SEA Insteon-Enabled Smart Electric Appliances Market, by Country/Region, 2023–2032 (USD Million)
Table 99 SEA C-Bus-Enabled Smart Electric Appliances Market, by Country/Region, 2023–2032 (USD Million)
Table 100 SEA Other Hybrid Protocol-Enabled Smart Electric Appliances Market, by Country/Region, 2023–2032 (USD Million)
Table 101 SEA Smart Appliances Market, by Country/Region, 2023–2032 (USD Million)
Table 102 Indonesia: Electric Appliances Market, by Product Type, 2023–2032 (USD Million)
Table 103 Indonesia: Residential Electric Appliances Market, by Type, 2023–2032 (USD Million)
Table 104 Indonesia: Residential Smart Entertainment Appliances Market, by Type, 2023–2032 (USD Million)
Table 105 Indonesia: Residential Smart Kitchen Appliances Market, by Type, 2023–2032 (USD Million)
Table 106 Indonesia: Residential Smart Climate Control Market, by Type, 2023–2032 (USD Million)
Table 107 Indonesia: Residential Smart Laundry Appliances Market, by Type, 2023–2032 (USD Million)
Table 108 Indonesia: Residential Smart Cleaning Appliances Market, by Type, 2023–2032 (USD Million)
Table 109 Indonesia: Residential Smart Security Systems Market, by Type, 2023–2032 (USD Million)
Table 110 Indonesia: Residential Smart Lighting Solutions Market, by Type, 2023–2032 (USD Million)
Table 111 Indonesia: Residential Smart Water Appliances Market, by Type, 2023–2032 (USD Million)
Table 112 Indonesia: Commercial Smart Electric Appliances Market, by Type, 2023–2032 (USD Million)
Table 113 Indonesia: Commercial Smart HVAC Systems Market, by Type, 2023–2032 (USD Million)
Table 114 Indonesia: Commercial Smart Security Systems Market, by Type, 2023–2032 (USD Million)
Table 115 Indonesia: Commercial Smart Lighting Systems Market, by Type, 2023–2032 (USD Million)
Table 116 Indonesia: Commercial Smart Office Equipment Market, by Type, 2023–2032 (USD Million)
Table 117 Indonesia: Commercial Smart Energy Management Systems Market, by Type, 2023–2032 (USD Million)
Table 118 Indonesia: Commercial Smart Kitchen Appliances Market, by Type, 2023–2032 (USD Million)
Table 119 Indonesia: Commercial Smart Water Management Market, by Type, 2023–2032 (USD Million)
Table 120 Indonesia: Commercial Smart Cleaning Solutions Market, by Type, 2023–2032 (USD Million)
Table 121 Indonesia: Smart Electric Appliances Market, by Protocol & Standards, 2023–2032 (USD Million)
Table 122 Indonesia: Wireless Protocols-Enabled Smart Electric Appliances Market, by Type, 2023–2032 (USD Million)
Table 123 Indonesia: Wired Protocols -Enabled Smart Electric Appliances Market, by Type, 2023–2032 (USD Million)
Table 124 Thailand: Electric Appliances Market, by Product Type, 2023–2032 (USD Million)
Table 125 Thailand: Residential Electric Appliances Market, by Type, 2023–2032 (USD Million)
Table 126 Thailand: Residential Smart Entertainment Appliances Market, by Type, 2023–2032 (USD Million)
Table 127 Thailand: Residential Smart Kitchen Appliances Market, by Type, 2023–2032 (USD Million)
Table 128 Thailand: Residential Smart Climate Control Market, by Type, 2023–2032 (USD Million)
Table 129 Thailand: Residential Smart Laundry Appliances Market, by Type, 2023–2032 (USD Million)
Table 130 Thailand: Residential Smart Cleaning Appliances Market, by Type, 2023–2032 (USD Million)
Table 131 Thailand: Residential Smart Security Systems Market, by Type, 2023–2032 (USD Million)
Table 132 Thailand: Residential Smart Lighting Solutions Market, by Type, 2023–2032 (USD Million)
Table 133 Thailand: Residential Smart Water Appliances Market, by Type, 2023–2032 (USD Million)
Table 134 Thailand: Commercial Smart Electric Appliances Market, by Type, 2023–2032 (USD Million)
Table 135 Thailand: Commercial Smart HVAC Systems Market, by Type, 2023–2032 (USD Million)
Table 136 Thailand: Commercial Smart Security Systems Market, by Type, 2023–2032 (USD Million)
Table 137 Thailand: Commercial Smart Lighting Systems Market, by Type, 2023–2032 (USD Million)
Table 138 Thailand: Commercial Smart Office Equipment Market, by Type, 2023–2032 (USD Million)
Table 139 Thailand: Commercial Smart Energy Management Systems Market, by Type, 2023–2032 (USD Million)
Table 140 Thailand: Commercial Smart Kitchen Appliances Market, by Type, 2023–2032 (USD Million)
Table 141 Thailand: Commercial Smart Water Management Market, by Type, 2023–2032 (USD Million)
Table 142 Thailand: Commercial Smart Cleaning Solutions Market, by Type, 2023–2032 (USD Million)
Table 143 Thailand: Smart Electric Appliances Market, by Protocol & Standards, 2023–2032 (USD Million)
Table 144 Thailand: Wireless Protocols-Enabled Smart Electric Appliances Market, by Type, 2023–2032 (USD Million)
Table 145 Thailand: Wired Protocols -Enabled Smart Electric Appliances Market, by Type, 2023–2032 (USD Million)
Table 146 Singapore: Electric Appliances Market, by Product Type, 2023–2032 (USD Million)
Table 147 Singapore: Residential Electric Appliances Market, by Type, 2023–2032 (USD Million)
Table 148 Singapore: Residential Smart Entertainment Appliances Market, by Type, 2023–2032 (USD Million)
Table 149 Singapore: Residential Smart Kitchen Appliances Market, by Type, 2023–2032 (USD Million)
Table 150 Singapore: Residential Smart Climate Control Market, by Type, 2023–2032 (USD Million)
Table 151 Singapore: Residential Smart Laundry Appliances Market, by Type, 2023–2032 (USD Million)
Table 152 Singapore: Residential Smart Cleaning Appliances Market, by Type, 2023–2032 (USD Million)
Table 153 Singapore: Residential Smart Security Systems Market, by Type, 2023–2032 (USD Million)
Table 154 Singapore: Residential Smart Lighting Solutions Market, by Type, 2023–2032 (USD Million)
Table 155 Singapore: Residential Smart Water Appliances Market, by Type, 2023–2032 (USD Million)
Table 156 Singapore: Commercial Smart Electric Appliances Market, by Type, 2023–2032 (USD Million)
Table 157 Singapore: Commercial Smart HVAC Systems Market, by Type, 2023–2032 (USD Million)
Table 158 Singapore: Commercial Smart Security Systems Market, by Type, 2023–2032 (USD Million)
Table 159 Singapore: Commercial Smart Lighting Systems Market, by Type, 2023–2032 (USD Million)
Table 160 Singapore: Commercial Smart Office Equipment Market, by Type, 2023–2032 (USD Million)
Table 161 Singapore: Commercial Smart Energy Management Systems Market, by Type, 2023–2032 (USD Million)
Table 162 Singapore: Commercial Smart Kitchen Appliances Market, by Type, 2023–2032 (USD Million)
Table 163 Singapore: Commercial Smart Water Management Market, by Type, 2023–2032 (USD Million)
Table 164 Singapore: Commercial Smart Cleaning Solutions Market, by Type, 2023–2032 (USD Million)
Table 165 Singapore: Smart Electric Appliances Market, by Protocol & Standards, 2023–2032 (USD Million)
Table 166 Singapore: Wireless Protocols-Enabled Smart Electric Appliances Market, by Type, 2023–2032 (USD Million)
Table 167 Singapore: Wired Protocols -Enabled Smart Electric Appliances Market, by Type, 2023–2032 (USD Million)
Table 168 Vietnam: Electric Appliances Market, by Product Type, 2023–2032 (USD Million)
Table 169 Vietnam: Residential Electric Appliances Market, by Type, 2023–2032 (USD Million)
Table 170 Vietnam: Residential Smart Entertainment Appliances Market, by Type, 2023–2032 (USD Million)
Table 171 Vietnam: Residential Smart Kitchen Appliances Market, by Type, 2023–2032 (USD Million)
Table 172 Vietnam: Residential Smart Climate Control Market, by Type, 2023–2032 (USD Million)
Table 173 Vietnam: Residential Smart Laundry Appliances Market, by Type, 2023–2032 (USD Million)
Table 174 Vietnam: Residential Smart Cleaning Appliances Market, by Type, 2023–2032 (USD Million)
Table 175 Vietnam: Residential Smart Security Systems Market, by Type, 2023–2032 (USD Million)
Table 176 Vietnam: Residential Smart Lighting Solutions Market, by Type, 2023–2032 (USD Million)
Table 177 Vietnam: Residential Smart Water Appliances Market, by Type, 2023–2032 (USD Million)
Table 178 Vietnam: Commercial Smart Electric Appliances Market, by Type, 2023–2032 (USD Million)
Table 179 Vietnam: Commercial Smart HVAC Systems Market, by Type, 2023–2032 (USD Million)
Table 180 Vietnam: Commercial Smart Security Systems Market, by Type, 2023–2032 (USD Million)
Table 181 Vietnam: Commercial Smart Lighting Systems Market, by Type, 2023–2032 (USD Million)
Table 182 Vietnam: Commercial Smart Office Equipment Market, by Type, 2023–2032 (USD Million)
Table 183 Vietnam: Commercial Smart Energy Management Systems Market, by Type, 2023–2032 (USD Million)
Table 184 Vietnam: Commercial Smart Kitchen Appliances Market, by Type, 2023–2032 (USD Million)
Table 185 Vietnam: Commercial Smart Water Management Market, by Type, 2023–2032 (USD Million)
Table 186 Vietnam: Commercial Smart Cleaning Solutions Market, by Type, 2023–2032 (USD Million)
Table 187 Vietnam: Smart Electric Appliances Market, by Protocol & Standards, 2023–2032 (USD Million)
Table 188 Vietnam: Wireless Protocols-Enabled Smart Electric Appliances Market, by Type, 2023–2032 (USD Million)
Table 189 Vietnam: Wired Protocols -Enabled Smart Electric Appliances Market, by Type, 2023–2032 (USD Million)
Table 190 Malaysia: Electric Appliances Market, by Product Type, 2023–2032 (USD Million)
Table 191 Malaysia: Residential Electric Appliances Market, by Type, 2023–2032 (USD Million)
Table 192 Malaysia: Residential Smart Entertainment Appliances Market, by Type, 2023–2032 (USD Million)
Table 193 Malaysia: Residential Smart Kitchen Appliances Market, by Type, 2023–2032 (USD Million)
Table 194 Malaysia: Residential Smart Climate Control Market, by Type, 2023–2032 (USD Million)
Table 195 Malaysia: Residential Smart Laundry Appliances Market, by Type, 2023–2032 (USD Million)
Table 196 Malaysia: Residential Smart Cleaning Appliances Market, by Type, 2023–2032 (USD Million)
Table 197 Malaysia: Residential Smart Security Systems Market, by Type, 2023–2032 (USD Million)
Table 198 Malaysia: Residential Smart Lighting Solutions Market, by Type, 2023–2032 (USD Million)
Table 199 Malaysia: Residential Smart Water Appliances Market, by Type, 2023–2032 (USD Million)
Table 200 Malaysia: Commercial Smart Electric Appliances Market, by Type, 2023–2032 (USD Million)
Table 201 Malaysia: Commercial Smart HVAC Systems Market, by Type, 2023–2032 (USD Million)
Table 202 Malaysia: Commercial Smart Security Systems Market, by Type, 2023–2032 (USD Million)
Table 203 Malaysia: Commercial Smart Lighting Systems Market, by Type, 2023–2032 (USD Million)
Table 204 Malaysia: Commercial Smart Office Equipment Market, by Type, 2023–2032 (USD Million)
Table 205 Malaysia: Commercial Smart Energy Management Systems Market, by Type, 2023–2032 (USD Million)
Table 206 Malaysia: Commercial Smart Kitchen Appliances Market, by Type, 2023–2032 (USD Million)
Table 207 Malaysia: Commercial Smart Water Management Market, by Type, 2023–2032 (USD Million)
Table 208 Malaysia: Commercial Smart Cleaning Solutions Market, by Type, 2023–2032 (USD Million)
Table 209 Malaysia: Smart Electric Appliances Market, by Protocol & Standards, 2023–2032 (USD Million)
Table 210 Malaysia: Wireless Protocols-Enabled Smart Electric Appliances Market, by Type, 2023–2032 (USD Million)
Table 211 Malaysia: Wired Protocols -Enabled Smart Electric Appliances Market, by Type, 2023–2032 (USD Million)
Table 212 Philippines: Electric Appliances Market, by Product Type, 2023–2032 (USD Million)
Table 213 Philippines: Residential Electric Appliances Market, by Type, 2023–2032 (USD Million)
Table 214 Philippines: Residential Smart Entertainment Appliances Market, by Type, 2023–2032 (USD Million)
Table 215 Philippines: Residential Smart Kitchen Appliances Market, by Type, 2023–2032 (USD Million)
Table 216 Philippines: Residential Smart Climate Control Market, by Type, 2023–2032 (USD Million)
Table 217 Philippines: Residential Smart Laundry Appliances Market, by Type, 2023–2032 (USD Million)
Table 218 Philippines: Residential Smart Cleaning Appliances Market, by Type, 2023–2032 (USD Million)
Table 219 Philippines: Residential Smart Security Systems Market, by Type, 2023–2032 (USD Million)
Table 220 Philippines: Residential Smart Lighting Solutions Market, by Type, 2023–2032 (USD Million)
Table 221 Philippines: Residential Smart Water Appliances Market, by Type, 2023–2032 (USD Million)
Table 222 Philippines: Commercial Smart Electric Appliances Market, by Type, 2023–2032 (USD Million)
Table 223 Philippines: Commercial Smart HVAC Systems Market, by Type, 2023–2032 (USD Million)
Table 224 Philippines: Commercial Smart Security Systems Market, by Type, 2023–2032 (USD Million)
Table 225 Philippines: Commercial Smart Lighting Systems Market, by Type, 2023–2032 (USD Million)
Table 226 Philippines: Commercial Smart Office Equipment Market, by Type, 2023–2032 (USD Million)
Table 227 Philippines: Commercial Smart Energy Management Systems Market, by Type, 2023–2032 (USD Million)
Table 228 Philippines: Commercial Smart Kitchen Appliances Market, by Type, 2023–2032 (USD Million)
Table 229 Philippines: Commercial Smart Water Management Market, by Type, 2023–2032 (USD Million)
Table 230 Philippines: Commercial Smart Cleaning Solutions Market, by Type, 2023–2032 (USD Million)
Table 231 Philippines: Smart Electric Appliances Market, by Protocol & Standards, 2023–2032 (USD Million)
Table 232 Philippines: Wireless Protocols-Enabled Smart Electric Appliances Market, by Type, 2023–2032 (USD Million)
Table 233 Philippines: Wired Protocols -Enabled Smart Electric Appliances Market, by Type, 2023–2032 (USD Million)
Table 234 Rest of SEA: Electric Appliances Market, by Product Type, 2023–2032 (USD Million)
Table 235 Rest of SEA: Residential Electric Appliances Market, by Type, 2023–2032 (USD Million)
Table 236 Rest of SEA: Residential Smart Entertainment Appliances Market, by Type, 2023–2032 (USD Million)
Table 237 Rest of SEA: Residential Smart Kitchen Appliances Market, by Type, 2023–2032 (USD Million)
Table 238 Rest of SEA: Residential Smart Climate Control Market, by Type, 2023–2032 (USD Million)
Table 239 Rest of SEA: Residential Smart Laundry Appliances Market, by Type, 2023–2032 (USD Million)
Table 240 Rest of SEA: Residential Smart Cleaning Appliances Market, by Type, 2023–2032 (USD Million)
Table 241 Rest of SEA: Residential Smart Security Systems Market, by Type, 2023–2032 (USD Million)
Table 242 Rest of SEA: Residential Smart Lighting Solutions Market, by Type, 2023–2032 (USD Million)
Table 243 Rest of SEA: Residential Smart Water Appliances Market, by Type, 2023–2032 (USD Million)
Table 244 Rest of SEA: Commercial Smart Electric Appliances Market, by Type, 2023–2032 (USD Million)
Table 245 Rest of SEA: Commercial Smart HVAC Systems Market, by Type, 2023–2032 (USD Million)
Table 246 Rest of SEA: Commercial Smart Security Systems Market, by Type, 2023–2032 (USD Million)
Table 247 Rest of SEA: Commercial Smart Lighting Systems Market, by Type, 2023–2032 (USD Million)
Table 248 Rest of SEA: Commercial Smart Office Equipment Market, by Type, 2023–2032 (USD Million)
Table 249 Rest of SEA: Commercial Smart Energy Management Systems Market, by Type, 2023–2032 (USD Million)
Table 250 Rest of SEA: Commercial Smart Kitchen Appliances Market, by Type, 2023–2032 (USD Million)
Table 251 Rest of SEA: Commercial Smart Water Management Market, by Type, 2023–2032 (USD Million)
Table 252 Rest of SEA: Commercial Smart Cleaning Solutions Market, by Type, 2023–2032 (USD Million)
Table 253 Rest of SEA: Smart Electric Appliances Market, by Protocol & Standards, 2023–2032 (USD Million)
Table 254 Rest of SEA: Wireless Protocols-Enabled Smart Electric Appliances Market, by Type, 2023–2032 (USD Million)
Table 255 Rest of SEA: Wired Protocols -Enabled Smart Electric Appliances Market, by Type, 2023–2032 (USD Million)
Table 256 Recent Developments, by Company, 2022-2025
Table 257 Key Regional Players in the SEA Residential Smart Electric Appliances Market
Table 258 Key Regional Players in the SEA Commercial Smart Electric Appliances Market
Table 259 Key Local Players in Singapore
Table 260 Key Local Players in Thailand
Table 261 Key Local Players in Malaysia
Table 262 Key Local Players in Indonesia
Table 263 Key Local Players in Vietnam
Table 264 Key Local Players in Philippines
Table 265 Key Emerging Regional Brands
Table 266 Key Players and their Connectivity Protocols and Standards
List of Figures
Figure 1 Research Process
Figure 2 Key Secondary Sources
Figure 3 Primary Research Techniques
Figure 4 Key Executives Interviewed
Figure 5 Breakdown of Primary Interviews (Supply-Side & Demand-Side)
Figure 6 Market Sizing and Growth Forecast Approach
Figure 7 In 2025, the Residential Smart Electric Appliances Segment Is Expected to Dominate the SEA Smart Electric Appliances Market
Figure 8 In 2025, the Smart Entertainment Appliances Segment is Expected to Dominate the SEA Residential Smart Electric Appliances Market
Figure 9 In 2025, the Smart HVAC Systems Segment is Expected to Dominate the SEA Commercial Smart Electric Appliances Market
Figure 10 In 2025, the Wireless Segment is Expected to Dominate the SEA Smart Electric Appliances Market
Figure 11 SEA Smart Electric Appliances Market, by Country (2025 Vs. 2032)
Figure 12 Porter's Five Forces Analysis
Figure 13 SEA Smart Electric Appliances Market, by Product Type, 2025 Vs. 2032 (USD Million)
Figure 14 SEA Residential Smart Electric Appliances Market, by Product Type, 2025 Vs. 2032 (USD Million)
Figure 15 SEA Commercial Smart Electric Appliances Market, by Type, 2025 Vs. 2032 (USD Million)
Figure 16 SEA Smart Electric Appliances Market, by Protocol & Standards, 2025 Vs. 2030 (USD Million)
Figure 17 Wi-Fi Penetration in Southeast Asia, by Country, 2024
Figure 18 SEA Smart Electric Appliances Market, by Country/Region, 2025 Vs. 2032 (USD Million)
Figure 19 Indonesia: Smart Electric Appliances Market Snapshot
Figure 20 Thailand: Smart Electric Appliances Market Snapshot
Figure 21 Singapore: Smart Electric Appliances Market Snapshot
Figure 22 Vietnam: Smart Electric Appliances Market Snapshot
Figure 23 Malaysia: Smart Electric Appliances Market Snapshot
Figure 24 Philippines: Smart Electric Appliances Market Snapshot
Figure 25 Rest of SEA: Smart Electric Appliances Market Snapshot
Figure 26 Key Growth Strategies Adopted by Leading Players, 2022-2025
Figure 27 Residential Smart Electric Appliances: Competitive Benchmarking, by Product
Figure 28 Competitive Dashboard: Southeast Asia Smart Electric Appliances Market
Figure 29 SEA Residential Smart Electric Appliances Market Share, by Key Player, 2024
Figure 30 SEA Commercial Smart Electric Appliances Market Share, by Key Player, 2024
Figure 31 Samsung Electronics Co., Ltd.: Financial Overview (2024)
Figure 32 LG Electronics: Financial Overview (2023)
Figure 33 Panasonic Holdings Corporation: Financial Overview (2024)
Figure 34 Electrolux AB: Financial Overview (2023)
Figure 35 Hitachi, Ltd.: Financial Overview (2024)
Figure 36 Honeywell International Inc.: Financial Overview (2024)
Figure 37 Xiaomi Corporation: Financial Overview (2023)
Figure 38 Daikin Industries, Ltd.: Financial Overview (2024)
Figure 39 Schneider Electric SE: Financial Overview (2024)
Figure 40 Johnson Controls International Plc: Financial Overview (2024)
Figure 41 Siemens AG: Financial Overview (2024)


Published Date: Apr-2025
Published Date: Jan-2025
Published Date: Jan-2025
Published Date: Jan-2025
Published Date: Jul-2024
Subscribe to get the latest industry updates