Resources
About Us
This market research report analyzes the rapidly evolving Microgrid Implementation market, evaluating how distributed energy technologies and smart grid solutions are transforming energy resilience and sustainability across various industries and regions. The report provides a strategic analysis of market dynamics, growth projections till 2035, and competitive positioning across global and regional/country-level markets.
Key Market Drivers & Trends and Insights
Click here to: Get Free Sample Pages of this Report
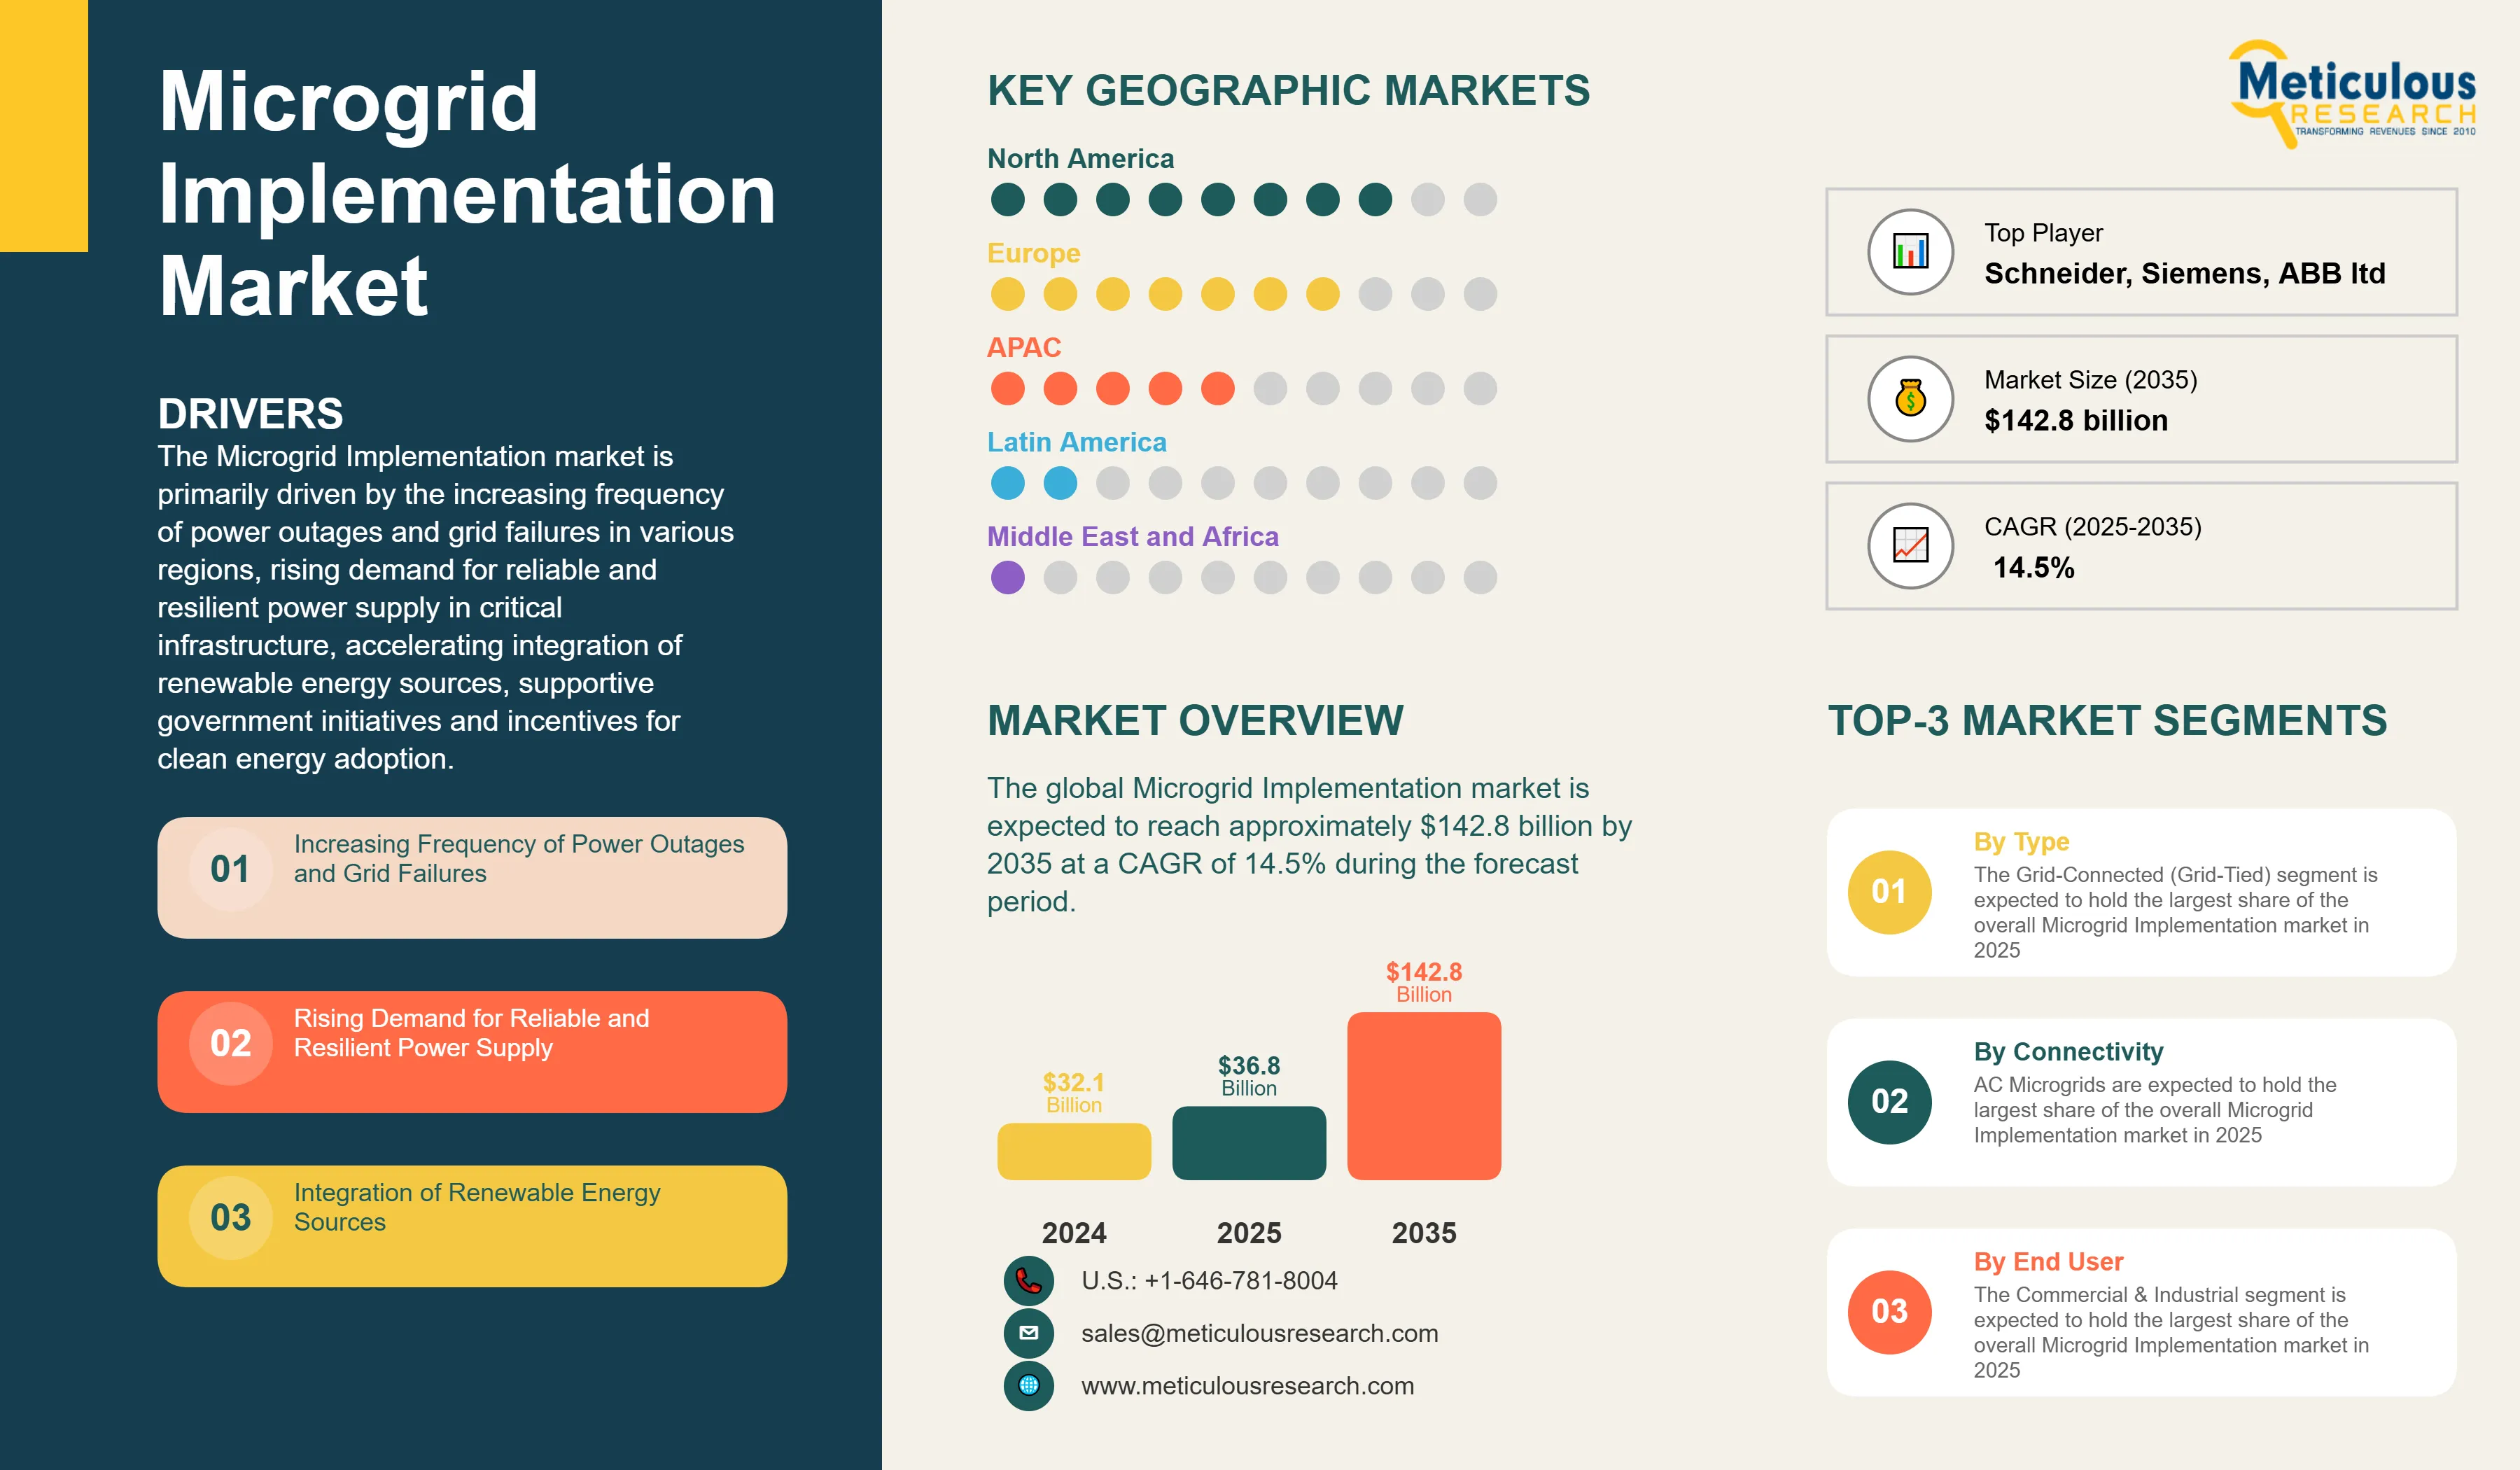
The Microgrid Implementation market is primarily driven by the increasing frequency of power outages and grid failures in various regions, rising demand for reliable and resilient power supply in critical infrastructure, accelerating integration of renewable energy sources, supportive government initiatives and incentives for clean energy adoption, and growing energy security concerns worldwide. The increasing adoption of AI and IoT in grid management is enhancing operational efficiency, while the rise of community and campus microgrids is expanding market applications. Additionally, heightened focus on cybersecurity for microgrid systems and the growth in blockchain-based energy trading platforms are further driving market innovation, especially in North America and Europe.
Key Challenges
Despite significant growth potential, the Microgrid Implementation market faces challenges including high initial implementation costs that can delay project deployment, technical challenges in integration with the main grid that require complex engineering solutions, regulatory barriers and policy uncertainties across different jurisdictions, and limited standardization across technologies that complicates interoperability. Additionally, energy storage limitations affect system efficiency and reliability, grid synchronization complexities create technical hurdles, and financing and business model uncertainties restrict broader market adoption, particularly in developing regions where energy infrastructure investments compete with other priorities.
Growth Opportunities
The Microgrid Implementation market offers several high-growth opportunities. Electrification of remote areas presents significant potential for off-grid microgrid solutions in regions lacking reliable grid infrastructure. Integration with smart grid technologies enables advanced functionality and greater system optimization. The declining costs of renewable energy technologies are improving project economics and return on investment timelines. Advancements in energy storage solutions are enhancing microgrid capabilities and reliability, opening new application areas. These opportunities collectively represent substantial growth potential as organizations and communities increasingly prioritize energy resilience, sustainability, and independence.
Market Segmentation Highlights
By Grid Type
The Grid-Connected (Grid-Tied) segment is expected to hold the largest share of the overall Microgrid Implementation market in 2025, as these systems benefit grid reliability and autonomous operation during outages. However, Hybrid microgrids are projected to grow at the fastest CAGR through 2035 as they combine the advantages of both grid-connected and off-grid systems, providing optimal flexibility for varying energy needs and conditions.
By Power Source
Solar PV is expected to dominate the power source segment in 2025, driven by declining solar panel costs, modularity, and minimal maintenance requirements. Combined Heat and Power (CHP) systems hold the second-largest share due to their high efficiency and reliability for continuous operations. However, Fuel Cells are expected to grow at the highest CAGR during the forecast period as this technology advances in efficiency and cost-effectiveness while offering clean power generation capabilities. Wind Turbines also show significant growth potential as their integration with microgrids improves and installation costs decrease.
By Connectivity
AC Microgrids are expected to hold the largest share of the overall Microgrid Implementation market in 2025, as they align with existing infrastructure and conventional power generation systems. However, Hybrid AC/DC Microgrids are projected to grow at the highest CAGR during the forecast period as they optimize the benefits of both AC and DC systems, particularly for installations combining various renewable sources with diverse load requirements.
By End User
The Commercial & Industrial segment is expected to hold the largest share of the overall Microgrid Implementation market in 2025, with Manufacturing Facilities and Data Centers being the dominant subsegments due to their critical power reliability requirements. However, Healthcare facilities are projected to grow at the highest CAGR of 17.9% during the forecast period as hospitals and medical centers increasingly prioritize uninterrupted power for critical care operations. Military & Defense installations also show strong growth potential at a CAGR of 16.8% as energy security becomes a strategic priority for defense organizations worldwide.
By Geography
North America is expected to hold the largest share of the global Microgrid Implementation market in 2025, followed by Europe. This leadership position is driven by advanced grid infrastructure, progressive energy policies, and high awareness of energy resilience benefits. The United States represents the largest market globally, while Germany leads adoption in the European region due to its energy transition initiatives. However, the Asia-Pacific region, particularly China, India, and Australia, is projected to witness the highest CAGR during the forecast period 2025-2035, driven by rapid industrialization, increasing power reliability concerns, and significant renewable energy investments. The Middle East & Africa region shows promising growth potential as countries invest in modernizing their energy infrastructure and addressing energy access challenges in remote communities.
Competitive Landscape
The global Microgrid Implementation market features a diverse competitive landscape with established energy management companies competing alongside specialized microgrid solution providers and emerging technology firms.
The broader solution provider landscape is categorized into industry leaders, market differentiators, vanguards, and emerging players, with each group employing distinctive strategies to maintain competitive advantage. Leading providers are focusing on integrated solutions that combine hardware, software, and services while addressing complex technical and regulatory challenges.
The key players operating in the global Microgrid Implementation market are Schneider Electric SE, Siemens AG, ABB Ltd., General Electric, Eaton Corporation, Honeywell International Inc., S&C Electric Company, Power Analytics Corporation, Spirae, LLC, Emerson Electric Co., Bloom Energy Corporation, Engie (formerly GDF Suez), Tesla, Inc., Toshiba Corporation, and Ameresco, Inc. among others.
|
Particulars |
Details |
|
Number of Pages |
185 |
|
Format |
PDF & Excel |
|
Forecast Period |
2025–2035 |
|
Base Year |
2024 |
|
CAGR (Value) |
14.5% |
|
Market Size (Value)in 2025 |
USD 36.8 Billion |
|
Market Size (Value) in 2035 |
USD 142.8 Billion |
|
Segments Covered |
By Grid Type
By Power Source
By Connectivity
By End User
|
|
Countries Covered |
North America
Europe
Asia-Pacific
Latin America
Middle East & Africa
|
|
Key Companies |
Industry Leaders: Schneider Electric SE, Siemens AG, ABB Ltd., General Electric Market Differentiators: Eaton Corporation, Honeywell International Inc., S&C Electric Company Vanguards: Power Analytics Corporation, Spirae, LLC, Emerson Electric Co. Emerging Players: Bloom Energy Corporation, Engie (formerly GDF Suez), Tesla, Inc., Toshiba Corporation, Ameresco, Inc. |
The global Microgrid Implementation market was valued at $32.1 billion in 2024. This market is expected to reach approximately $142.8 billion by 2035, growing from an estimated $36.8 billion in 2025, at a CAGR of 14.5% during the forecast period of 2025-2035.
The global Microgrid Implementation market is expected to grow at a CAGR of 14.5% during the forecast period of 2025-2035.
The global Microgrid Implementation market is expected to reach approximately $142.8 billion by 2035, growing from an estimated $36.8 billion in 2025, at a CAGR of 14.5% during the forecast period of 2025-2035.
The key companies operating in this market include Schneider Electric SE, Siemens AG, ABB Ltd., General Electric, Eaton Corporation, Honeywell International Inc., S&C Electric Company, Power Analytics Corporation, Spirae, LLC, Emerson Electric Co., Bloom Energy Corporation, Engie (formerly GDF Suez), Tesla, Inc., Toshiba Corporation, and Ameresco, Inc. among others.
Major trends shaping the market include increasing adoption of AI and IoT in grid management, rise of community and campus microgrids, focus on cybersecurity for microgrid systems, growth in blockchain-based energy trading platforms, and advancements in energy storage solutions.
• In 2025, the Grid-Connected segment is expected to dominate the overall Microgrid Implementation market by grid type.
• Based on power source, Solar PV is expected to hold the largest share of the overall Microgrid Implementation market in 2025.
• Based on connectivity, AC Microgrids are expected to hold the largest share of the global Microgrid Implementation market in 2025.
• Commercial & Industrial users are expected to be the largest end-user segment in 2025.
• Hybrid microgrids are projected to grow at the highest CAGR in the grid type segment through 2035.
• Fuel Cells are expected to grow at the highest CAGR during the forecast period.
• Healthcare facilities are projected to grow at the highest CAGR during the forecast period.
North America is expected to hold the largest share of the global Microgrid Implementation market in 2025, followed by Europe. This is driven by advanced grid infrastructure, progressive energy policies, and high awareness of energy resilience benefits. However, the Asia-Pacific region is projected to grow at the highest CAGR during the forecast period.
The growth of this market is driven by increasing frequency of power outages and grid failures, rising demand for reliable and resilient power supply, accelerating integration of renewable energy sources, supportive government initiatives and incentives for clean energy adoption, and growing energy security concerns worldwide.
1. Market Definition & Scope
1.1. Market Definition
1.2. Market Ecosystem
1.3. Currency & Pricing
1.4. Key Stakeholders
2. Research Methodology
2.1. Research Approach
2.2. Process of Data Collection and Validation
2.2.1. Secondary Research
2.2.2. Primary Research/Interviews with Key Opinion Leaders
2.3. Market Sizing and Forecast
2.3.1. Market Size Estimation Approach
2.3.2. Bottom-up Approach
2.3.3. Top-down Approach
2.3.4. Growth Forecast Approach
2.3.5. Assumptions for the Study
3. Executive Summary
3.1. Market Overview
3.2. Segmental Analysis
3.2.1. Microgrid Implementation Market, by Grid Type
3.2.2. Microgrid Implementation Market, by Power Source
3.2.3. Microgrid Implementation Market, by Connectivity
3.2.4. Microgrid Implementation Market, by End User
3.2.5. Microgrid Implementation Market, by Geography
3.3. Competitive Landscape
4. Market Insights
4.1. Market Overview
4.2. Factors Affecting Market Growth
4.2.1. Drivers
4.2.1.1. Increasing Frequency of Power Outages and Grid Failures
4.2.1.2. Rising Demand for Reliable and Resilient Power Supply
4.2.1.3. Integration of Renewable Energy Sources
4.2.1.4. Government Initiatives and Incentives for Clean Energy
4.2.1.5. Growing Energy Security Concerns
4.2.2. Restraints
4.2.2.1. High Initial Implementation Costs
4.2.2.2. Technical Challenges in Integration with Main Grid
4.2.2.3. Regulatory Barriers and Policy Uncertainties
4.2.2.4. Limited Standardization Across Technologies
4.2.3. Opportunities
4.2.3.1. Electrification of Remote Areas
4.2.3.2. Integration with Smart Grid Technologies
4.2.3.3. Declining Costs of Renewable Energy Technologies
4.2.3.4. Advancements in Energy Storage Solutions
4.2.4. Trends
4.2.4.1. Increasing Adoption of AI and IoT in Grid Management
4.2.4.2. Rise of Community and Campus Microgrids
4.2.4.3. Focus on Cybersecurity for Microgrid Systems
4.2.4.4. Growth in Blockchain-based Energy Trading Platforms
4.2.5. Challenges
4.2.5.1. Energy Storage Limitations
4.2.5.2. Grid Synchronization Complexities
4.2.5.3. Financing and Business Model Uncertainties
4.3. Porter's Five Forces Analysis
4.3.1. Bargaining Power of Suppliers
4.3.2. Bargaining Power of Buyers
4.3.3. Threat of Substitutes
4.3.4. Threat of New Entrants
4.3.5. Degree of Competition
4.4. Impact of Sustainability on the Microgrid Implementation Market
4.4.1. Carbon Emission Reduction Goals and Compliance
4.4.2. Sustainable Energy Generation Practices
4.4.3. Life Cycle Assessment of Microgrid Components
4.4.4. Energy Source Considerations
5. Microgrid Implementation Market Assessment—by Grid Type
5.1. Grid-Connected (Grid-Tied)
5.2. Off-Grid (Island Mode)
5.3. Hybrid
6. Microgrid Implementation Market Assessment—by Power Source
6.1. Solar PV
6.2. Wind Turbines
6.3. Fuel Cells
6.4. Combined Heat and Power (CHP)
6.5. Diesel
6.6. Natural Gas
7. Microgrid Implementation Market Assessment—by Connectivity
7.1. AC Microgrid
7.2. DC Microgrid
7.3. Hybrid AC/DC Microgrid
8. Microgrid Implementation Market Assessment—by End User
8.1. Commercial & Industrial
8.1.1. Data Centers
8.1.2. Manufacturing Facilities
8.1.3. Commercial Buildings
8.1.4. Industrial Parks
8.2. Utilities
8.3. Military & Defense
8.4. Healthcare
8.5. Educational Institutions
8.6. Remote Communities
8.7. Government Facilities
9. Microgrid Implementation Market Assessment—by Geography
9.1. Overview
9.2. North America
9.2.1. U.S.
9.2.2. Canada
9.3. Europe
9.3.1. Germany
9.3.2. France
9.3.3. U.K.
9.3.4. Italy
9.3.5. Spain
9.3.6. Denmark
9.3.7. Rest of Europe (RoE)
9.4. Asia-Pacific
9.4.1. China
9.4.2. Japan
9.4.3. India
9.4.4. South Korea
9.4.5. Australia
9.4.6. Singapore
9.4.7. Rest of Asia-Pacific (RoAPAC)
9.5. Latin America
9.5.1. Brazil
9.5.2. Mexico
9.5.3. Chile
9.5.4. Rest of Latin America (RoLATAM)
9.6. Middle East & Africa
9.6.1. Saudi Arabia
9.6.2. South Africa
9.6.3. United Arab Emirates (UAE)
9.6.4. Israel
9.6.5. Rest of Middle East & Africa (RoMEA)
10. Competitive Landscape
10.1. Overview
10.2. Key Growth Strategies
10.3. Competitive Benchmarking
10.4. Competitive Dashboard
10.4.1. Industry Leaders
10.4.2. Market Differentiators
10.4.3. Vanguards
10.4.4. Emerging Players
10.5. Market Share/Ranking Analysis, by Key Players, 2024
11. Company Profiles (Business Overview, Financial Overview, Product Portfolio, Strategic Developments, and SWOT Analysis)
11.1. Schneider Electric SE
11.2. Siemens AG
11.3. ABB Ltd.
11.4. General Electric
11.5. Eaton Corporation
11.6. Honeywell International Inc.
11.7. S&C Electric Company
11.8. Power Analytics Corporation
11.9. Spirae, LLC
11.10. Emerson Electric Co.
11.11. Bloom Energy Corporation
11.12. Engie (formerly GDF Suez)
11.13. Tesla, Inc.
11.14. Toshiba Corporation
11.15. Ameresco, Inc.
12. Appendix
12.1. Available Customizations
12.2. Related Reports
List of Tables
Global Market Overview
Table 1: Global Microgrid Implementation Market, 2023-2035 (USD Million)
Table 2: Global Microgrid Implementation Market, by Grid Type, 2023-2035 (USD Million)
Table 3: Global Microgrid Implementation Market, by Power Source, 2023-2035 (USD Million)
Table 4: Global Microgrid Implementation Market, by Connectivity, 2023-2035 (USD Million)
Table 5: Global Microgrid Implementation Market, by End User, 2023-2035 (USD Million)
Table 6: Global Microgrid Implementation Market, by Region/Country, 2023-2035 (USD Million)
Grid Type Segment
Table 7: Global Grid-Connected Microgrids Market, by Region/Country, 2023-2035 (USD Million)
Table 8: Global Off-Grid Microgrids Market, by Region/Country, 2023-2035 (USD Million)
Table 9: Global Hybrid Microgrids Market, by Region/Country, 2023-2035 (USD Million)
Power Source Segment
Table 10: Global Solar PV Microgrids Market, by Region/Country, 2023-2035 (USD Million)
Table 11: Global Wind Turbine Microgrids Market, by Region/Country, 2023-2035 (USD Million)
Table 12: Global Fuel Cell Microgrids Market, by Region/Country, 2023-2035 (USD Million)
Table 13: Global Combined Heat and Power (CHP) Microgrids Market, by Region/Country, 2023-2035 (USD Million)
Table 14: Global Diesel Microgrids Market, by Region/Country, 2023-2035 (USD Million)
Table 15: Global Natural Gas Microgrids Market, by Region/Country, 2023-2035 (USD Million)
Connectivity Segment
Table 16: Global AC Microgrids Market, by Region/Country, 2023-2035 (USD Million) Table 17: Global DC Microgrids Market, by Region/Country, 2023-2035 (USD Million) Table 18: Global Hybrid AC/DC Microgrids Market, by Region/Country, 2023-2035 (USD Million)
End User Segment
Table 19: Global Microgrids Market for Commercial & Industrial End Users, by Region/Country, 2023-2035 (USD Million)
Table 20: Global Microgrids Market for Data Centers, by Region/Country, 2023-2035 (USD Million)
Table 21: Global Microgrids Market for Manufacturing Facilities, by Region/Country, 2023-2035 (USD Million)
Table 22: Global Microgrids Market for Commercial Buildings, by Region/Country, 2023-2035 (USD Million)
Table 23: Global Microgrids Market for Industrial Parks, by Region/Country, 2023-2035 (USD Million)
Table 24: Global Microgrids Market for Utilities End Users, by Region/Country, 2023-2035 (USD Million)
Table 25: Global Microgrids Market for Military & Defense, by Region/Country, 2023-2035 (USD Million)
Table 26: Global Microgrids Market for Healthcare Industry, by Region/Country, 2023-2035 (USD Million)
Table 27: Global Microgrids Market for Educational Institutions, by Region/Country, 2023-2035 (USD Million)
Table 28: Global Microgrids Market for Remote Communities, by Region/Country, 2023-2035 (USD Million)
Table 29: Global Microgrids Market for Government Facilities, by Region/Country, 2023-2035 (USD Million)
North America Market
Table 30: North America Microgrid Implementation Market, 2023-2035 (USD Million)
Table 31: North America Microgrid Implementation Market, by Grid Type, 2023-2035 (USD Million)
Table 32: North America Microgrid Implementation Market, by Power Source, 2023-2035 (USD Million)
Table 33: North America Microgrid Implementation Market, by Connectivity, 2023-2035 (USD Million)
Table 34: North America Microgrid Implementation Market, by End User, 2023-2035 (USD Million)
Table 35: North America Microgrid Implementation Market, by Country, 2023-2035 (USD Million)
U.S. Market
Table 36: U.S. Microgrid Implementation Market, 2023-2035 (USD Million)
Table 37: U.S. Microgrid Implementation Market, by Grid Type, 2023-2035 (USD Million)
Table 38: U.S. Microgrid Implementation Market, by Power Source, 2023-2035 (USD Million)
Table 39: U.S. Microgrid Implementation Market, by Connectivity, 2023-2035 (USD Million)
Table 40: U.S. Microgrid Implementation Market, by End User, 2023-2035 (USD Million)
Canada Market
Table 41: Canada Microgrid Implementation Market, 2023-2035 (USD Million)
Table 42: Canada Microgrid Implementation Market, by Grid Type, 2023-2035 (USD Million)
Table 43: Canada Microgrid Implementation Market, by Power Source, 2023-2035 (USD Million)
Table 44: Canada Microgrid Implementation Market, by Connectivity, 2023-2035 (USD Million)
Table 45: Canada Microgrid Implementation Market, by End User, 2023-2035 (USD Million)
Europe Market
Table 46: Europe Microgrid Implementation Market, 2023-2035 (USD Million)
Table 47: Europe Microgrid Implementation Market, by Grid Type, 2023-2035 (USD Million)
Table 48: Europe Microgrid Implementation Market, by Power Source, 2023-2035 (USD Million)
Table 49: Europe Microgrid Implementation Market, by Connectivity, 2023-2035 (USD Million)
Table 50: Europe Microgrid Implementation Market, by End User, 2023-2035 (USD Million)
Table 51: Europe Microgrid Implementation Market, by Country, 2023-2035 (USD Million)
Germany Market
Table 52: Germany Microgrid Implementation Market, 2023-2035 (USD Million)
Table 53: Germany Microgrid Implementation Market, by Grid Type, 2023-2035 (USD Million)
Table 54: Germany Microgrid Implementation Market, by Power Source, 2023-2035 (USD Million)
Table 55: Germany Microgrid Implementation Market, by Connectivity, 2023-2035 (USD Million)
Table 56: Germany Microgrid Implementation Market, by End User, 2023-2035 (USD Million)
France Market
Table 57: France Microgrid Implementation Market, 2023-2035 (USD Million)
Table 58: France Microgrid Implementation Market, by Grid Type, 2023-2035 (USD Million)
Table 59: France Microgrid Implementation Market, by Power Source, 2023-2035 (USD Million)
Table 60: France Microgrid Implementation Market, by Connectivity, 2023-2035 (USD Million)
Table 61: France Microgrid Implementation Market, by End User, 2023-2035 (USD Million)
U.K. Market
Table 62: U.K. Microgrid Implementation Market, 2023-2035 (USD Million)
Table 63: U.K. Microgrid Implementation Market, by Grid Type, 2023-2035 (USD Million)
Table 64: U.K. Microgrid Implementation Market, by Power Source, 2023-2035 (USD Million)
Table 65: U.K. Microgrid Implementation Market, by Connectivity, 2023-2035 (USD Million)
Table 66: U.K. Microgrid Implementation Market, by End User, 2023-2035 (USD Million)
Italy Market
Table 67: Italy Microgrid Implementation Market, 2023-2035 (USD Million)
Table 68: Italy Microgrid Implementation Market, by Grid Type, 2023-2035 (USD Million)
Table 69: Italy Microgrid Implementation Market, by Power Source, 2023-2035 (USD Million)
Table 70: Italy Microgrid Implementation Market, by Connectivity, 2023-2035 (USD Million)
Table 71: Italy Microgrid Implementation Market, by End User, 2023-2035 (USD Million)
Spain Market
Table 72: Spain Microgrid Implementation Market, 2023-2035 (USD Million)
Table 73: Spain Microgrid Implementation Market, by Grid Type, 2023-2035 (USD Million)
Table 74: Spain Microgrid Implementation Market, by Power Source, 2023-2035 (USD Million)
Table 75: Spain Microgrid Implementation Market, by Connectivity, 2023-2035 (USD Million)
Table 76: Spain Microgrid Implementation Market, by End User, 2023-2035 (USD Million)
Denmark Market
Table 77: Denmark Microgrid Implementation Market, 2023-2035 (USD Million)
Table 78: Denmark Microgrid Implementation Market, by Grid Type, 2023-2035 (USD Million)
Table 79: Denmark Microgrid Implementation Market, by Power Source, 2023-2035 (USD Million)
Table 80: Denmark Microgrid Implementation Market, by Connectivity, 2023-2035 (USD Million)
Table 81: Denmark Microgrid Implementation Market, by End User, 2023-2035 (USD Million)
Rest of Europe Market
Table 82: Rest of Europe Microgrid Implementation Market, 2023-2035 (USD Million)
Table 83: Rest of Europe Microgrid Implementation Market, by Grid Type, 2023-2035 (USD Million)
Table 84: Rest of Europe Microgrid Implementation Market, by Power Source, 2023-2035 (USD Million)
Table 85: Rest of Europe Microgrid Implementation Market, by Connectivity, 2023-2035 (USD Million)
Table 86: Rest of Europe Microgrid Implementation Market, by End User, 2023-2035 (USD Million)
Asia-Pacific Market
Table 87: Asia-Pacific Microgrid Implementation Market, 2023-2035 (USD Million)
Table 88: Asia-Pacific Microgrid Implementation Market, by Grid Type, 2023-2035 (USD Million)
Table 89: Asia-Pacific Microgrid Implementation Market, by Power Source, 2023-2035 (USD Million)
Table 90: Asia-Pacific Microgrid Implementation Market, by Connectivity, 2023-2035 (USD Million)
Table 91: Asia-Pacific Microgrid Implementation Market, by End User, 2023-2035 (USD Million)
Table 92: Asia-Pacific Microgrid Implementation Market, by Country, 2023-2035 (USD Million)
China Market
Table 93: China Microgrid Implementation Market, 2023-2035 (USD Million)
Table 94: China Microgrid Implementation Market, by Grid Type, 2023-2035 (USD Million)
Table 95: China Microgrid Implementation Market, by Power Source, 2023-2035 (USD Million)
Table 96: China Microgrid Implementation Market, by Connectivity, 2023-2035 (USD Million)
Table 97: China Microgrid Implementation Market, by End User, 2023-2035 (USD Million)
Japan Market
Table 98: Japan Microgrid Implementation Market, 2023-2035 (USD Million)
Table 99: Japan Microgrid Implementation Market, by Grid Type, 2023-2035 (USD Million)
Table 100: Japan Microgrid Implementation Market, by Power Source, 2023-2035 (USD Million)
Table 101: Japan Microgrid Implementation Market, by Connectivity, 2023-2035 (USD Million)
Table 102: Japan Microgrid Implementation Market, by End User, 2023-2035 (USD Million)
India Market
Table 103: India Microgrid Implementation Market, 2023-2035 (USD Million)
Table 104: India Microgrid Implementation Market, by Grid Type, 2023-2035 (USD Million)
Table 105: India Microgrid Implementation Market, by Power Source, 2023-2035 (USD Million)
Table 106: India Microgrid Implementation Market, by Connectivity, 2023-2035 (USD Million)
Table 107: India Microgrid Implementation Market, by End User, 2023-2035 (USD Million)
South Korea Market
Table 108: South Korea Microgrid Implementation Market, 2023-2035 (USD Million)
Table 109: South Korea Microgrid Implementation Market, by Grid Type, 2023-2035 (USD Million)
Table 110: South Korea Microgrid Implementation Market, by Power Source, 2023-2035 (USD Million)
Table 111: South Korea Microgrid Implementation Market, by Connectivity, 2023-2035 (USD Million)
Table 112: South Korea Microgrid Implementation Market, by End User, 2023-2035 (USD Million)
Australia Market
Table 113: Australia Microgrid Implementation Market, 2023-2035 (USD Million)
Table 114: Australia Microgrid Implementation Market, by Grid Type, 2023-2035 (USD Million)
Table 115: Australia Microgrid Implementation Market, by Power Source, 2023-2035 (USD Million)
Table 116: Australia Microgrid Implementation Market, by Connectivity, 2023-2035 (USD Million)
Table 117: Australia Microgrid Implementation Market, by End User, 2023-2035 (USD Million)
Singapore Market
Table 118: Singapore Microgrid Implementation Market, 2023-2035 (USD Million)
Table 119: Singapore Microgrid Implementation Market, by Grid Type, 2023-2035 (USD Million)
Table 120: Singapore Microgrid Implementation Market, by Power Source, 2023-2035 (USD Million)
Table 121: Singapore Microgrid Implementation Market, by Connectivity, 2023-2035 (USD Million)
Table 122: Singapore Microgrid Implementation Market, by End User, 2023-2035 (USD Million)
Rest of Asia-Pacific Market
Table 123: Rest of Asia-Pacific Microgrid Implementation Market, 2023-2035 (USD Million)
Table 124: Rest of Asia-Pacific Microgrid Implementation Market, by Grid Type, 2023-2035 (USD Million)
Table 125: Rest of Asia-Pacific Microgrid Implementation Market, by Power Source, 2023-2035 (USD Million)
Table 126: Rest of Asia-Pacific Microgrid Implementation Market, by Connectivity, 2023-2035 (USD Million)
Table 127: Rest of Asia-Pacific Microgrid Implementation Market, by End User, 2023-2035 (USD Million)
Latin America Market
Table 128: Latin America Microgrid Implementation Market, 2023-2035 (USD Million)
Table 129: Latin America Microgrid Implementation Market, by Grid Type, 2023-2035 (USD Million)
Table 130: Latin America Microgrid Implementation Market, by Power Source, 2023-2035 (USD Million)
Table 131: Latin America Microgrid Implementation Market, by Connectivity, 2023-2035 (USD Million)
Table 132: Latin America Microgrid Implementation Market, by End User, 2023-2035 (USD Million)
Table 133: Latin America Microgrid Implementation Market, by Country, 2023-2035 (USD Million)
Brazil Market
Table 134: Brazil Microgrid Implementation Market, 2023-2035 (USD Million)
Table 135: Brazil Microgrid Implementation Market, by Grid Type, 2023-2035 (USD Million)
Table 136: Brazil Microgrid Implementation Market, by Power Source, 2023-2035 (USD Million)
Table 137: Brazil Microgrid Implementation Market, by Connectivity, 2023-2035 (USD Million)
Table 138: Brazil Microgrid Implementation Market, by End User, 2023-2035 (USD Million)
Mexico Market
Table 139: Mexico Microgrid Implementation Market, 2023-2035 (USD Million)
Table 140: Mexico Microgrid Implementation Market, by Grid Type, 2023-2035 (USD Million)
Table 141: Mexico Microgrid Implementation Market, by Power Source, 2023-2035 (USD Million)
Table 142: Mexico Microgrid Implementation Market, by Connectivity, 2023-2035 (USD Million)
Table 143: Mexico Microgrid Implementation Market, by End User, 2023-2035 (USD Million)
Chile Market
Table 144: Chile Microgrid Implementation Market, 2023-2035 (USD Million)
Table 145: Chile Microgrid Implementation Market, by Grid Type, 2023-2035 (USD Million)
Table 146: Chile Microgrid Implementation Market, by Power Source, 2023-2035 (USD Million)
Table 147: Chile Microgrid Implementation Market, by Connectivity, 2023-2035 (USD Million)
Table 148: Chile Microgrid Implementation Market, by End User, 2023-2035 (USD Million)
Rest of Latin America Market
Table 149: Rest of Latin America Microgrid Implementation Market, 2023-2035 (USD Million)
Table 150: Rest of Latin America Microgrid Implementation Market, by Grid Type, 2023-2035 (USD Million)
Table 151: Rest of Latin America Microgrid Implementation Market, by Power Source, 2023-2035 (USD Million)
Table 152: Rest of Latin America Microgrid Implementation Market, by Connectivity, 2023-2035 (USD Million)
Table 153: Rest of Latin America Microgrid Implementation Market, by End User, 2023-2035 (USD Million)
Middle East & Africa Market
Table 154: Middle East & Africa Microgrid Implementation Market, 2023-2035 (USD Million)
Table 155: Middle East & Africa Microgrid Implementation Market, by Grid Type, 2023-2035 (USD Million)
Table 156: Middle East & Africa Microgrid Implementation Market, by Power Source, 2023-2035 (USD Million)
Table 157: Middle East & Africa Microgrid Implementation Market, by Connectivity, 2023-2035 (USD Million)
Table 158: Middle East & Africa Microgrid Implementation Market, by End User, 2023-2035 (USD Million)
Table 159: Middle East & Africa Microgrid Implementation Market, by Country, 2023-2035 (USD Million)
Saudi Arabia Market
Table 160: Saudi Arabia Microgrid Implementation Market, 2023-2035 (USD Million)
Table 161: Saudi Arabia Microgrid Implementation Market, by Grid Type, 2023-2035 (USD Million)
Table 162: Saudi Arabia Microgrid Implementation Market, by Power Source, 2023-2035 (USD Million)
Table 163: Saudi Arabia Microgrid Implementation Market, by Connectivity, 2023-2035 (USD Million)
Table 164: Saudi Arabia Microgrid Implementation Market, by End User, 2023-2035 (USD Million)
South Africa Market
Table 165: South Africa Microgrid Implementation Market, 2023-2035 (USD Million)
Table 166: South Africa Microgrid Implementation Market, by Grid Type, 2023-2035 (USD Million)
Table 167: South Africa Microgrid Implementation Market, by Power Source, 2023-2035 (USD Million)
Table 168: South Africa Microgrid Implementation Market, by Connectivity, 2023-2035 (USD Million)
Table 169: South Africa Microgrid Implementation Market, by End User, 2023-2035 (USD Million)
United Arab Emirates (UAE) Market
Table 170: UAE Microgrid Implementation Market, 2023-2035 (USD Million)
Table 171: UAE Microgrid Implementation Market, by Grid Type, 2023-2035 (USD Million)
Table 172: UAE Microgrid Implementation Market, by Power Source, 2023-2035 (USD Million)
Table 173: UAE Microgrid Implementation Market, by Connectivity, 2023-2035 (USD Million)
Table 174: UAE Microgrid Implementation Market, by End User, 2023-2035 (USD Million)
Israel Market
Table 175: Israel Microgrid Implementation Market, 2023-2035 (USD Million)
Table 176: Israel Microgrid Implementation Market, by Grid Type, 2023-2035 (USD Million)
Table 177: Israel Microgrid Implementation Market, by Power Source, 2023-2035 (USD Million)
Table 178: Israel Microgrid Implementation Market, by Connectivity, 2023-2035 (USD Million)
Table 179: Israel Microgrid Implementation Market, by End User, 2023-2035 (USD Million)
Rest of Middle East & Africa Market
Table 180: Rest of Middle East & Africa Microgrid Implementation Market, 2023-2035 (USD Million)
Table 181: Rest of Middle East & Africa Microgrid Implementation Market, by Grid Type, 2023-2035 (USD Million)
Table 182: Rest of Middle East & Africa Microgrid Implementation Market, by Power Source, 2023-2035 (USD Million)
Table 183: Rest of Middle East & Africa Microgrid Implementation Market, by Connectivity, 2023-2035 (USD Million)
Table 184: Rest of Middle East & Africa Microgrid Implementation Market, by End User, 2023-2035 (USD Million)
List of Figures
Figure 1: Global Microgrid Implementation Market Size, 2023-2035 (USD Million)
Figure 2: Global Microgrid Implementation Market Growth, Y-o-Y % Growth, 2025-2035
Figure 3: Global Microgrid Implementation Market, by Grid Type, 2025 vs. 2035 (%)
Figure 4: Global Microgrid Implementation Market, by Power Source, 2025 vs. 2035 (%)
Figure 5: Global Microgrid Implementation Market, by Connectivity, 2025 vs. 2035 (%)
Figure 6: Global Microgrid Implementation Market, by End User, 2025 vs. 2035 (%)
Figure 7: Global Microgrid Implementation Market, by Region/Country, 2025 vs. 2035 (%)
Figure 8: Impact Assessment of Market Drivers on Global Microgrid Implementation Market (2025-2035)
Figure 9: Impact Assessment of Market Restraints on Global Microgrid Implementation Market (2025-2035)
Figure 10: Impact Assessment of Market Opportunities on Global Microgrid Implementation Market (2025-2035)
Figure 11: Porter's Five Forces Analysis: Global Microgrid Implementation Market
Figure 12: Microgrid Infrastructure Development by Region, 2024
Figure 13: Key Regulatory Frameworks for Microgrid Implementation by Region
Figure 14: Investment Trends in Microgrid Technology, 2022-2025
Figure 15: Renewable Integration Level in Microgrids by Type
Figure 16: Energy Storage Technology Evolution for Microgrids, 2020-2025
Figure 17: Grid Reliability Comparison: Microgrid vs. Traditional Grid
Figure 18: Vertiport Development Progress by Region, 2023-2025
Figure 19: North America Microgrid Implementation Market Snapshot, 2025-2035 (USD Million)
Figure 20: North America Microgrid Implementation Market Share, by Country, 2025 vs. 2035 (%)
Figure 21: North America Microgrid Implementation Market Snapshot (2025)
Figure 22: Europe Microgrid Implementation Market Snapshot (2025)
Figure 23: Asia-Pacific Microgrid Implementation Market Snapshot (2025)
Figure 24: Latin America Microgrid Implementation Market Snapshot (2025)
Figure 25: Middle East & Africa Microgrid Implementation Market Snapshot (2025)


Published Date: Jun-2026
Published Date: Sep-2025
Published Date: Jul-2025
Subscribe to get the latest industry updates