Resources
About Us
Report Overview
This comprehensive market research report analyzes the rapidly evolving Direct Air Capture market, evaluating how carbon removal technologies and climate mitigation strategies are transforming the atmospheric CO2 capture industry across various applications and regions. The report provides a strategic analysis of market dynamics, growth projections till 2035, and competitive positioning across global and regional/country-level markets.
Key Market Drivers & Trends and Insights
Click here to: Get Free Sample Pages of this Report
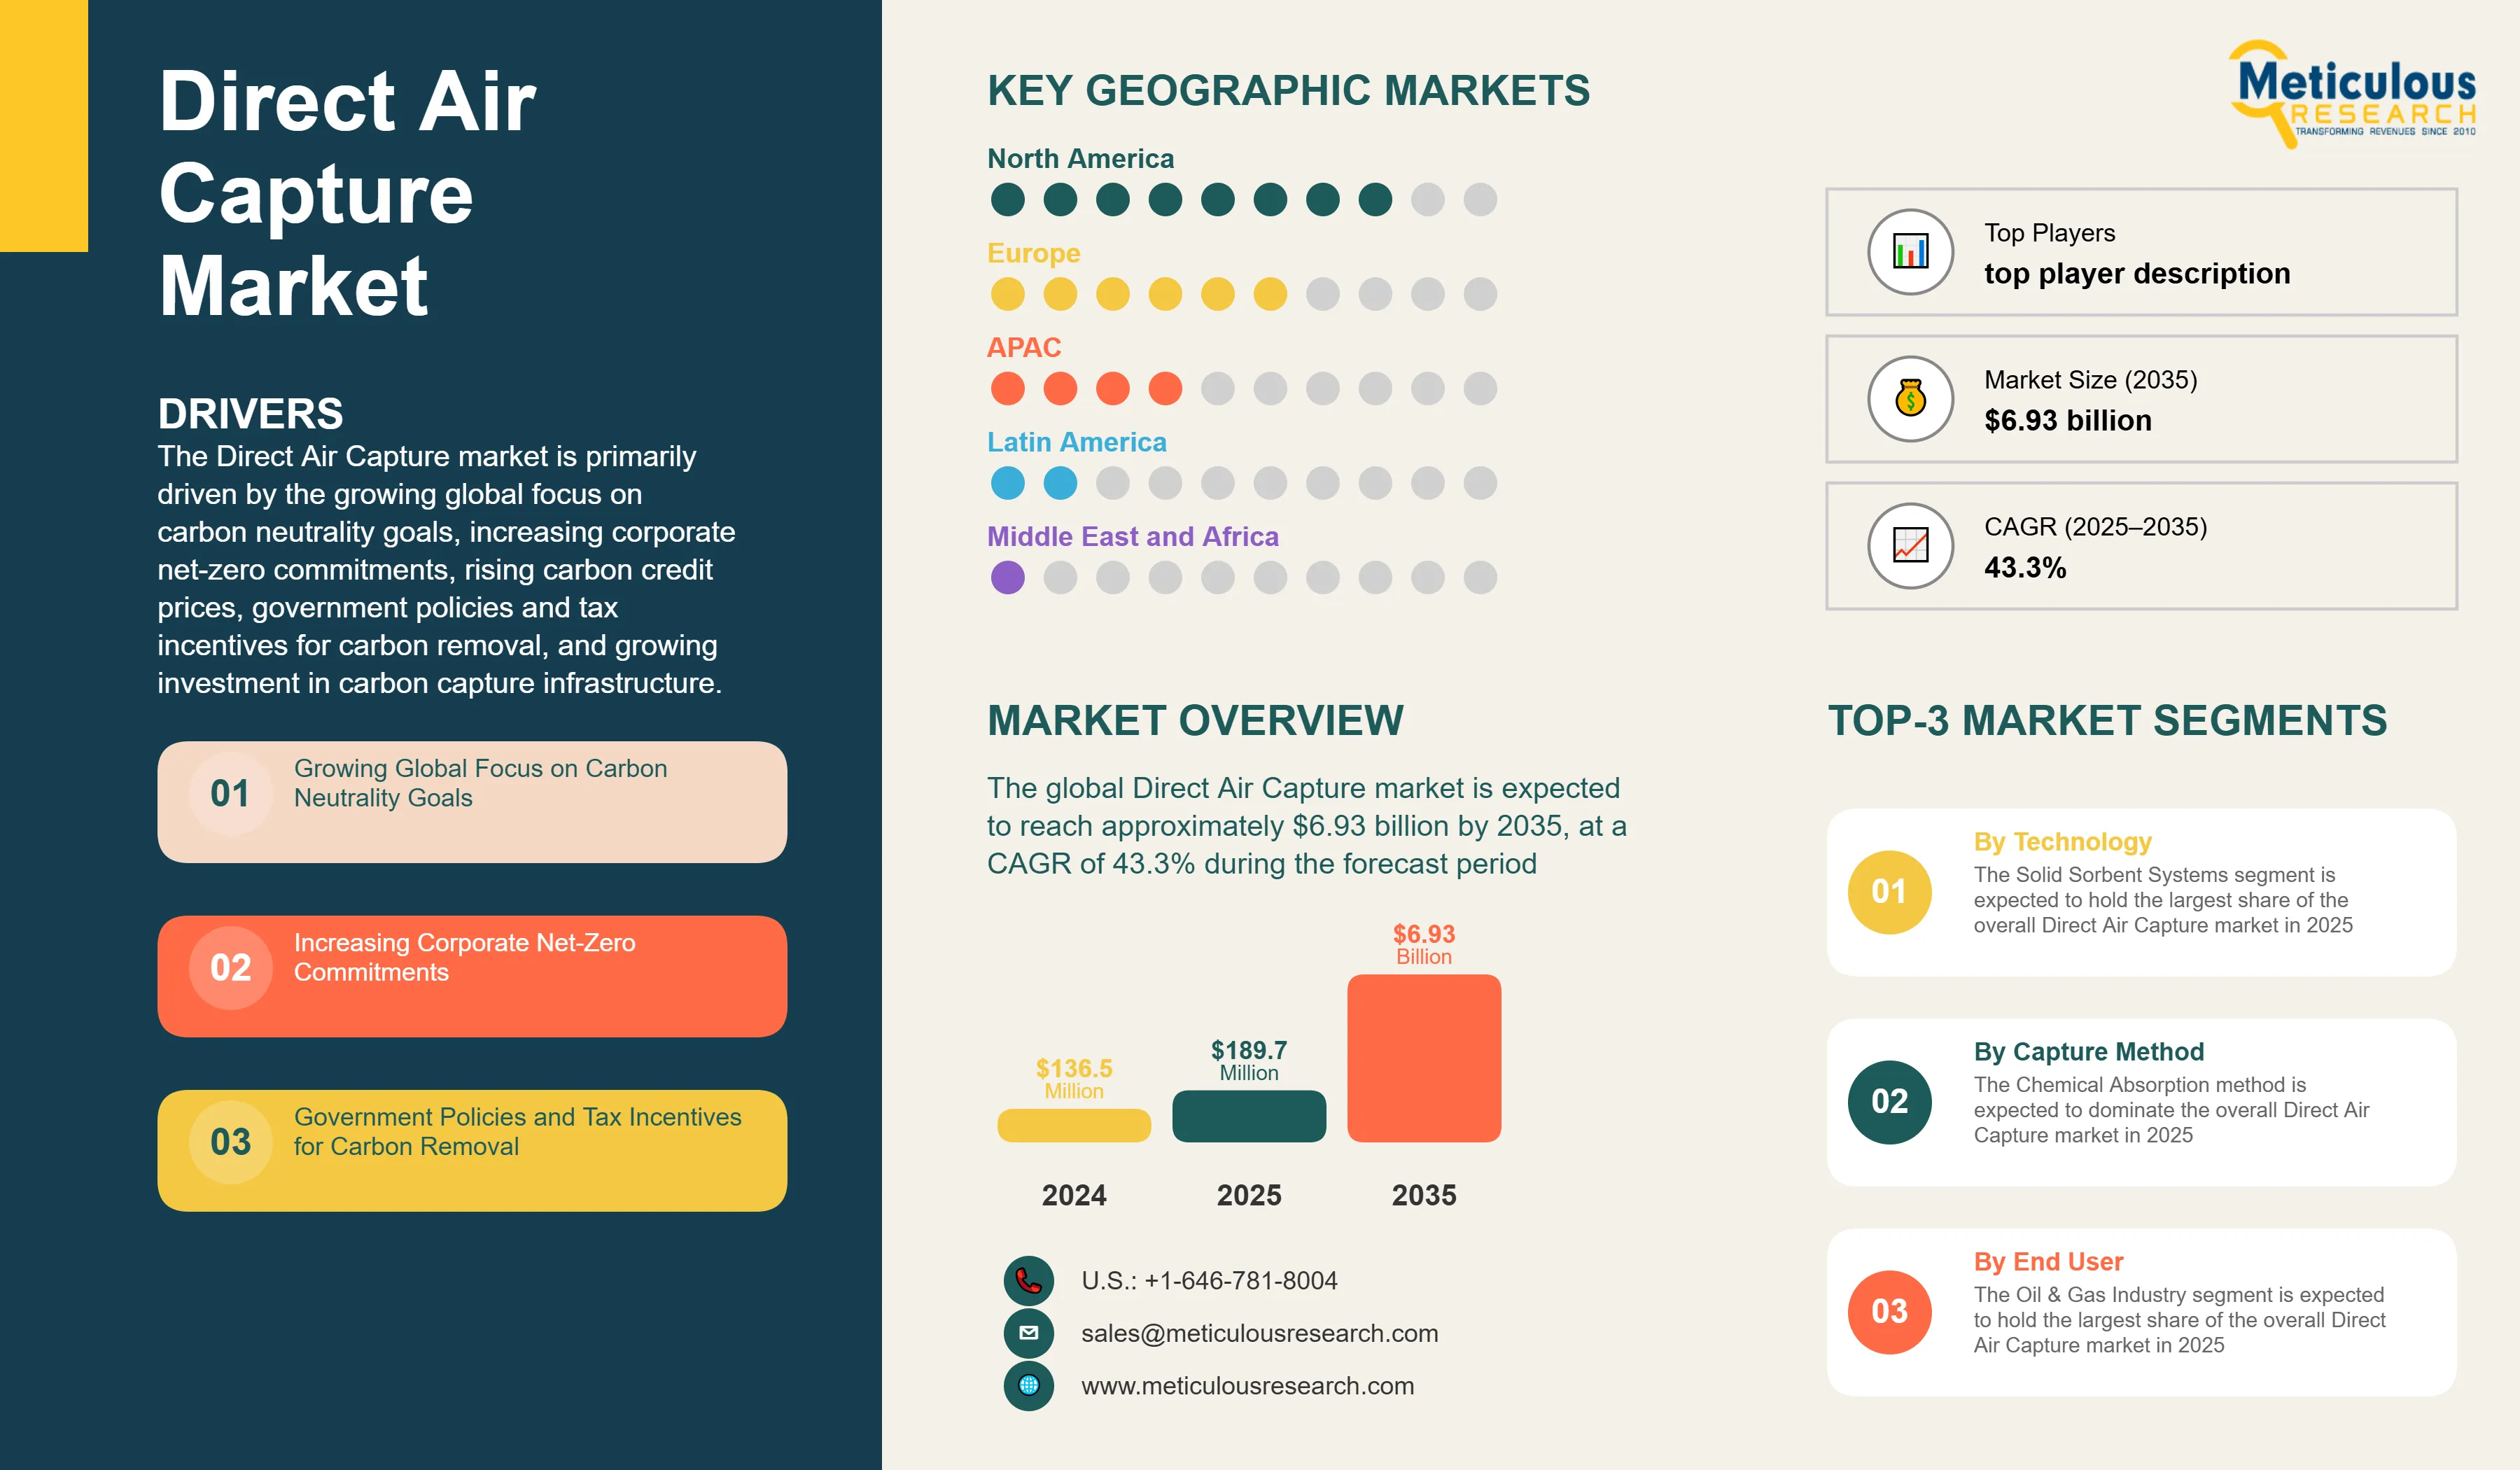
The Direct Air Capture market is primarily driven by the growing global focus on carbon neutrality goals, increasing corporate net-zero commitments, rising carbon credit prices, government policies and tax incentives for carbon removal, and growing investment in carbon capture infrastructure. The increasing strategic partnerships between technology providers and end users are accelerating innovation, while the integration of AI and IoT for process optimization is creating new operational efficiencies. Additionally, the development of modular and scalable DAC systems, growth in carbon removal credit markets, and carbon utilization in value-added products are further driving market growth, especially in North America and Europe regions.
Key Challenges
Despite significant growth potential, the overall Direct Air Capture market faces challenges including high capital and operational costs, technical challenges in scaling operations, energy intensity of the direct air capture process, and limited commercial-scale deployment. Infrastructure development constraints, particularly renewable energy integration for low-carbon operation, represent significant barriers to widespread adoption. The storage capacity and long-term monitoring requirements must be addressed. Additionally, maintaining cost competitiveness with other carbon reduction strategies and ensuring the availability of specialized sorbent materials present additional barriers, potentially slowing down market adoption in different regions across the globe.
Growth Opportunities
The Direct Air Capture market offers several high-growth opportunities. Carbon utilization in value-added products presents a significant opportunity to create economic value from captured CO2. The integration with renewable energy sources can solve energy intensity concerns in DAC operations. Carbon storage in geological formations provides permanent CO2 sequestration capabilities, while advancements in sorbent technologies improve efficiency and reduce operational costs. Additionally, the emergence of carbon removal credit markets and specialized applications in industrial decarbonization presents untapped market potential, as organizations increasingly seek innovative solutions to meet net-zero commitments.
Market Segmentation Highlights
By Technology
The Solid Sorbent Systems segment is expected to hold the largest share of the overall Direct Air Capture market in 2025, due to their lower energy requirements, operational simplicity, and proven scalability in commercial applications. Liquid Solvent Systems represent the second-largest segment as they offer higher CO2 capture rates and established industrial process integration. However, Membrane-Based Systems are projected to grow at the fastest CAGR through 2035 as this technology offers continuous operation capabilities and lower energy consumption, making them increasingly attractive for large-scale DAC deployment.
By Capture Method
The Chemical Absorption method is expected to dominate the overall Direct Air Capture market in 2025, driven by its high CO2 selectivity and mature technology readiness for commercial deployment. However, Membrane Separation is expected to grow at the fastest CAGR during the forecast period as this technology offers selective CO2 permeation with minimal chemical inputs and reduced operational complexity. Cryogenic Separation maintains a specialized share in applications requiring ultra-pure CO2 streams.
By End User
The Oil & Gas Industry segment is expected to hold the largest share of the overall Direct Air Capture market in 2025, driven by enhanced oil recovery applications and corporate commitments to carbon neutrality. However, the Chemical Industry is projected to grow at the highest CAGR during the forecast period as chemical manufacturers increasingly integrate captured CO2 as feedstock for sustainable chemical production. Transportation also shows strong growth potential as the sector seeks carbon removal solutions to offset hard-to-abate emissions.
By Geography
North America is expected to hold the largest share of the global Direct Air Capture market in 2025, followed by Europe. Supportive policy frameworks, including tax credits, substantial government funding for carbon removal projects, and strong industrial commitment to net-zero targets, drive this leadership position. The United States represents the largest market in North America, while Switzerland leads in Europe due to pioneering commercial DAC facilities and a favorable regulatory environment. However, the Asia-Pacific region, particularly China, Japan, and Australia, is projected to witness the highest CAGR during the forecast period 2025-2035, driven by increasing climate commitments, growing industrial decarbonization needs, and significant investments in carbon capture infrastructure. The Middle East region shows promising growth potential as countries like the UAE and Saudi Arabia leverage their energy resources and industrial capabilities to develop large-scale DAC projects.
Competitive Landscape
The global Direct Air Capture market features a diverse competitive landscape with established engineering firms competing alongside specialized carbon capture companies and renewable energy developers.
The competitive landscape is categorized into technology innovators focusing on breakthrough DAC solutions and industrial integrators developing scalable commercial systems, with each group employing distinctive strategies to maintain competitive advantage. Leading providers are focusing on integrated solutions that combine renewable energy generation with DAC facilities and developing specialized carbon utilization applications while navigating evolving regulatory frameworks.
The key players operating in the global Direct Air Capture market are Carbon Engineering Ltd., Climeworks AG, Global Thermostat LLC, Heirloom Carbon Technologies, Inc., Carbfix ehf., Svante Inc., Storegga Geotechnologies Limited (Pale Blue Dot Energy Limited), Sustaera Inc., Prometheus Fuels, Carbon Collect Limited, Carbyon, Soletair Power, Noya Inc., Mission Zero Technologies Limited, and Verdox, Inc., among others.
|
Particulars |
Details |
|
Number of Pages |
275 |
|
Format |
PDF & Excel |
|
Forecast Period |
2025–2035 |
|
Base Year |
2024 |
|
CAGR (Value) |
42.1% |
|
Market Size (Value)in 2025 |
$165.7 million |
|
Market Size (Value) in 2035 |
$8.9 billion |
|
Segments Covered |
By Technology
By Capture Method
By End User
|
|
Countries Covered |
North America
Europe
Asia-Pacific
Latin America
Middle East & Africa
|
|
Key Companies |
Carbon Engineering Ltd., Climeworks AG, Global Thermostat LLC, Heirloom Carbon Technologies, Inc., Carbfix ehf., Svante Inc., Storegga Geotechnologies Limited (Pale Blue Dot Energy Limited), Sustaera Inc., Prometheus Fuels, Carbon Collect Limited, Carbyon, Soletair Power, Noya Inc., Mission Zero Technologies Limited, and Verdox, Inc., among others. |
The global Direct Air Capture market was valued at $136.5 million in 2024. This market is expected to reach approximately $6.93 billion by 2035, growing from an estimated $189.7 million in 2025, at a CAGR of 43.3% during the forecast period of 2025–2035.
The global Direct Air Capture market is expected to grow at a CAGR of 43.3% during the forecast period of 2025–2035.
The global Direct Air Capture market is expected to reach approximately $6.93 billion by 2035, growing from an estimated $189.7 million in 2025, at a CAGR of 43.3% during the forecast period of 2025–2035.
The key companies operating in this market include Carbon Engineering Ltd., Climeworks AG, Global Thermostat LLC, Heirloom Carbon Technologies, Inc., Carbfix ehf., Svante Inc., Storegga Geotechnologies Limited (Pale Blue Dot Energy Limited), Sustaera Inc., Prometheus Fuels, Carbon Collect Limited, Carbyon, Soletair Power, Noya Inc., Mission Zero Technologies Limited, and Verdox, Inc., among others.
Major trends shaping the market include strategic partnerships between technology providers and end users, integration of AI and IoT for process optimization, development of modular and scalable DAC systems, and growth in carbon removal credit markets.
• In 2025, the Solid Sorbent Systems segment is expected to dominate the overall Direct Air Capture market by technology type.
• Based on capture method, Chemical Absorption is expected to hold the largest share of the overall Direct Air Capture market in 2025.
• Based on end user, the Oil & Gas Industry segment is expected to hold the largest share of the global Direct Air Capture market in 2025.
• Power Generation is expected to be the second-largest end-user segment in 2025.
• Membrane-Based Systems are projected to grow at the highest CAGR in the technology segment through 2035.
• Membrane Separation is expected to grow at the highest CAGR during the forecast period among capture methods.
• Chemical Industry applications are projected to grow at the highest CAGR during the forecast period.
North America is expected to hold the largest share of the global Direct Air Capture market in 2025, followed by Europe. This is driven by supportive policy frameworks including tax credits, substantial government funding for carbon removal projects, and strong industrial commitment to net-zero targets. However, the Asia-Pacific region is projected to grow at the highest CAGR of 47.7% during the forecast period.
The growth of this market is driven by growing global focus on carbon neutrality goals, increasing corporate net-zero commitments, rising carbon credit prices, government policies and tax incentives for carbon removal, and growing investment in carbon capture infrastructure.
1. Market Definition & Scope
1.1. Market Definition
1.2. Market Ecosystem
1.3. Currency & Pricing
1.4. Key Stakeholders
2. Research Methodology
2.1. Research Approach
2.2. Process of Data Collection and Validation
2.2.1. Secondary Research
2.2.2. Primary Research/Interviews with Key Opinion Leaders
2.3. Market Sizing and Forecast
2.3.1. Market Size Estimation Approach
2.3.2. Bottom-up Approach
2.3.3. Top-down Approach
2.3.4. Growth Forecast Approach
2.3.5. Assumptions for the Study
3. Executive Summary
3.1. Market Overview
3.2. Segmental Analysis
3.2.1. Direct Air Capture Market, by Technology
3.2.2. Direct Air Capture Market, by Capture Method
3.2.3. Direct Air Capture Market, by End User
3.2.4. Direct Air Capture Market, by Geography
3.3. Competitive Landscape
4. Market Insights
4.1. Market Overview
4.2. Factors Affecting Market Growth
4.2.1. Drivers
4.2.1.1. Growing Global Focus on Carbon Neutrality Goals
4.2.1.2. Increasing Corporate Net-Zero Commitments
4.2.1.3. Rising Carbon Credit Prices
4.2.1.4. Government Policies and Tax Incentives for Carbon Removal
4.2.1.5. Growing Investment in Carbon Capture Infrastructure
4.2.2. Restraints
4.2.2.1. High Capital and Operational Costs
4.2.2.2. Technical Challenges in Scaling Operations
4.2.2.3. Energy Intensity of Direct Air Capture Process
4.2.2.4. Limited Commercial-Scale Deployment
4.2.3. Opportunities
4.2.3.1. Carbon Utilization in Value-Added Products
4.2.3.2. Integration with Renewable Energy Sources
4.2.3.3. Carbon Storage in Geological Formations
4.2.3.4. Advancements in Sorbent Technologies
4.2.4. Trends
4.2.4.1. Strategic Partnerships Between Technology Providers and End Users
4.2.4.2. Integration of AI and IoT for Process Optimization
4.2.4.3. Development of Modular and Scalable DAC Systems
4.2.4.4. Growth in Carbon Removal Credit Markets
4.2.5. Challenges
4.2.5.1. Renewable Energy Integration for Low-Carbon Operation
4.2.5.2. Storage Capacity and Long-term Monitoring Requirements
4.2.5.3. Cost Competitiveness with Other Carbon Reduction Strategies
4.3. Porter's Five Forces Analysis
4.3.1. Bargaining Power of Suppliers
4.3.2. Bargaining Power of Buyers
4.3.3. Threat of Substitutes
4.3.4. Threat of New Entrants
4.3.5. Degree of Competition
4.4. Impact of Sustainability on the Direct Air Capture Market
4.4.1. Carbon Removal Targets and Compliance
4.4.2. Sustainable Operation Practices
4.4.3. Life Cycle Assessment of Direct Air Capture Systems
4.4.4. Energy Source Considerations
5. Direct Air Capture Market Assessment—by Technology
5.1. Solid Sorbent Systems
5.2. Liquid Solvent Systems
5.3. Membrane-Based Systems
5.4. Other Technologies
6. Direct Air Capture Market Assessment—by Capture Method
6.1. Chemical Absorption
6.2. Physical Adsorption
6.3. Membrane Separation
6.4. Cryogenic Separation
7. Direct Air Capture Market Assessment—by End User
7.1. Oil & Gas Industry
7.2. Power Generation
7.3. Chemical Industry
7.4. Transportation
7.5. Construction Materials
7.6. Agriculture
7.7. Food and Beverage Industry
7.8. Other End Users
8. Direct Air Capture Market Assessment—by Geography
8.1. Overview
8.2. North America
8.2.1. U.S.
8.2.2. Canada
8.3. Europe
8.3.1. Germany
8.3.2. United Kingdom
8.3.3. Switzerland
8.3.4. Norway
8.3.5. Iceland
8.3.6. Netherlands
8.3.7. Rest of Europe (RoE)
8.4. Asia-Pacific
8.4.1. Japan
8.4.2. Australia
8.4.3. China
8.4.4. South Korea
8.4.5. India
8.4.6. Singapore
8.4.7. Rest of Asia-Pacific (RoAPAC)
8.5. Latin America
8.5.1. Brazil
8.5.2. Chile
8.5.3. Mexico
8.5.4. Rest of Latin America (RoLATAM)
8.6. Middle East & Africa
8.6.1. United Arab Emirates (UAE)
8.6.2. Saudi Arabia
8.6.3. Qatar
8.6.4. Oman
8.6.5. Rest of Middle East & Africa (RoMEA)
9. Competitive Landscape
9.1. Overview
9.2. Key Growth Strategies
9.3. Competitive Benchmarking
9.4. Competitive Dashboard
9.4.1. Industry Leaders
9.4.2. Market Differentiators
9.4.3. Vanguards
9.4.4. Emerging Players
9.5. Market Share/Ranking Analysis, by Key Players, 2024
10. Company Profiles Business Overview, Financial Overview, Product Portfolio, Strategic Developments, and SWOT Analysis )
10.1. Carbon Engineering Ltd.
10.2. Climeworks AG
10.3. Global Thermostat LLC
10.4. Heirloom Carbon Technologies, Inc.
10.5. Carbfix ehf.
10.6. Svante Inc.
10.7. Storegga Geotechnologies Limited (Pale Blue Dot Energy Limited)
10.8. Sustaera Inc.
10.9. Prometheus Fuels
10.10. Carbon Collect Limited
10.11. Carbyon
10.12. Soletair Power
10.13. Noya Inc.
10.14. Mission Zero Technologies Limited
10.15. Verdox, Inc.
11. Appendix
11.1. Available Customizations
11.2. Related Reports
List of Tables
Global Market Overview
Table 1: Global Direct Air Capture Market, 2023–2035 (USD Million)
Table 2: Global Direct Air Capture Market, by Technology, 2023–2035 (USD Million)
Table 3: Global Direct Air Capture Market, by Capture Method, 2023–2035 (USD Million)
Table 4: Global Direct Air Capture Market, by End User, 2023–2035 (USD Million)
Table 5: Global Direct Air Capture Market, by Region/Country, 2023–2035 (USD Million) Technology Segment
Table 6: Global Solid Sorbent Systems Direct Air Capture Market, by Region/Country, 2023–2035 (USD Million)
Table 7: Global Liquid Solvent Systems Direct Air Capture Market, by Region/Country, 2023–2035 (USD Million)
Table 8: Global Membrane-Based Systems Direct Air Capture Market, by Region/Country, 2023–2035 (USD Million)
Table 9: Other Technologies Market, by Region/Country, 2023–2035 (USD Million) Capture Method Segment
Table 10: Global Chemical Absorption Market, by Region/Country, 2023–2035 (USD Million)
Table 11: Global Physical Adsorption Market, by Region/Country, 2023–2035 (USD Million)
Table 12: Global Membrane Separation Market, by Region/Country, 2023–2035 (USD Million)
Table 13: Global Cryogenic Separation Market, by Region/Country, 2023–2035 (USD Million) End User Segment
Table 14: Global Direct Air Capture Market for Oil & Gas Industry, by Region/Country, 2023–2035 (USD Million)
Table 15: Global Direct Air Capture Market for Power Generation, by Region/Country, 2023–2035 (USD Million)
Table 16: Global Direct Air Capture Market for Chemical Industry, by Region/Country, 2023–2035 (USD Million)
Table 17: Global Direct Air Capture Market for Transportation, by Region/Country, 2023–2035 (USD Million)
Table 18: Global Direct Air Capture Market for Construction Materials, by Region/Country, 2023–2035 (USD Million)
Table 19: Global Direct Air Capture Market for Agriculture, by Region/Country, 2023–2035 (USD Million)
Table 20: Global Direct Air Capture Market for Food and Beverage Industry, by Region/Country, 2023–2035 (USD Million)
Table 21: Global Direct Air Capture Market for Other End Users, by Region/Country, 2023–2035 (USD Million) North America Market
Table 22: North America Direct Air Capture Market, 2023–2035 (USD Million)
Table 23: North America Direct Air Capture Market, by Technology, 2023–2035 (USD Million)
Table 24: North America Direct Air Capture Market, by Capture Method, 2023–2035 (USD Million)
Table 25: North America Direct Air Capture Market, by End User, 2023–2035 (USD Million)
Table 26: North America Direct Air Capture Market, by Country, 2023–2035 (USD Million) U.S. Market
Table 27: U.S. Direct Air Capture Market, 2023–2035 (USD Million)
Table 28: U.S. Direct Air Capture Market, by Technology, 2023–2035 (USD Million)
Table 29: U.S. Direct Air Capture Market, by Capture Method, 2023–2035 (USD Million)
Table 30: U.S. Direct Air Capture Market, by End User, 2023–2035 (USD Million) Canada Market
Table 31: Canada Direct Air Capture Market, 2023–2035 (USD Million)
Table 32: Canada Direct Air Capture Market, by Technology, 2023–2035 (USD Million)
Table 33: Canada Direct Air Capture Market, by Capture Method, 2023–2035 (USD Million)
Table 34: Canada Direct Air Capture Market, by End User, 2023–2035 (USD Million) Europe Market
Table 35: Europe Direct Air Capture Market, 2023–2035 (USD Million)
Table 36: Europe Direct Air Capture Market, by Technology, 2023–2035 (USD Million)
Table 37: Europe Direct Air Capture Market, by Capture Method, 2023–2035 (USD Million)
Table 38: Europe Direct Air Capture Market, by End User, 2023–2035 (USD Million)
Table 39: Europe Direct Air Capture Market, by Country, 2023–2035 (USD Million) Germany Market
Table 40: Germany Direct Air Capture Market, 2023–2035 (USD Million)
Table 41: Germany Direct Air Capture Market, by Technology, 2023–2035 (USD Million)
Table 42: Germany Direct Air Capture Market, by Capture Method, 2023–2035 (USD Million)
Table 43: Germany Direct Air Capture Market, by End User, 2023–2035 (USD Million) United Kingdom Market
Table 44: United Kingdom Direct Air Capture Market, 2023–2035 (USD Million)
Table 45: United Kingdom Direct Air Capture Market, by Technology, 2023–2035 (USD Million)
Table 46: United Kingdom Direct Air Capture Market, by Capture Method, 2023–2035 (USD Million)
Table 47: United Kingdom Direct Air Capture Market, by End User, 2023–2035 (USD Million) Switzerland Market
Table 48: Switzerland Direct Air Capture Market, 2023–2035 (USD Million)
Table 49: Switzerland Direct Air Capture Market, by Technology, 2023–2035 (USD Million)
Table 50: Switzerland Direct Air Capture Market, by Capture Method, 2023–2035 (USD Million)
Table 51: Switzerland Direct Air Capture Market, by End User, 2023–2035 (USD Million) Norway Market
Table 52: Norway Direct Air Capture Market, 2023–2035 (USD Million)
Table 53: Norway Direct Air Capture Market, by Technology, 2023–2035 (USD Million)
Table 54: Norway Direct Air Capture Market, by Capture Method, 2023–2035 (USD Million)
Table 55: Norway Direct Air Capture Market, by End User, 2023–2035 (USD Million) Iceland Market
Table 56: Iceland Direct Air Capture Market, 2023–2035 (USD Million)
Table 57: Iceland Direct Air Capture Market, by Technology, 2023–2035 (USD Million)
Table 58: Iceland Direct Air Capture Market, by Capture Method, 2023–2035 (USD Million)
Table 59: Iceland Direct Air Capture Market, by End User, 2023–2035 (USD Million) Netherlands Market
Table 60: Netherlands Direct Air Capture Market, 2023–2035 (USD Million)
Table 61: Netherlands Direct Air Capture Market, by Technology, 2023–2035 (USD Million)
Table 62: Netherlands Direct Air Capture Market, by Capture Method, 2023–2035 (USD Million)
Table 63: Netherlands Direct Air Capture Market, by End User, 2023–2035 (USD Million) Rest of Europe Market
Table 64: Rest of Europe Direct Air Capture Market, 2023–2035 (USD Million)
Table 65: Rest of Europe Direct Air Capture Market, by Technology, 2023–2035 (USD Million)
Table 66: Rest of Europe Direct Air Capture Market, by Capture Method, 2023–2035 (USD Million)
Table 67: Rest of Europe Direct Air Capture Market, by End User, 2023–2035 (USD Million) Asia-Pacific Market
Table 68: Asia-Pacific Direct Air Capture Market, 2023–2035 (USD Million)
Table 69: Asia-Pacific Direct Air Capture Market, by Technology, 2023–2035 (USD Million)
Table 70: Asia-Pacific Direct Air Capture Market, by Capture Method, 2023–2035 (USD Million)
Table 71: Asia-Pacific Direct Air Capture Market, by End User, 2023–2035 (USD Million)
Table 72: Asia-Pacific Direct Air Capture Market, by Country, 2023–2035 (USD Million) Japan Market
Table 73: Japan Direct Air Capture Market, 2023–2035 (USD Million)
Table 74: Japan Direct Air Capture Market, by Technology, 2023–2035 (USD Million)
Table 75: Japan Direct Air Capture Market, by Capture Method, 2023–2035 (USD Million)
Table 76: Japan Direct Air Capture Market, by End User, 2023–2035 (USD Million) Australia Market
Table 77: Australia Direct Air Capture Market, 2023–2035 (USD Million)
Table 78: Australia Direct Air Capture Market, by Technology, 2023–2035 (USD Million)
Table 79: Australia Direct Air Capture Market, by Capture Method, 2023–2035 (USD Million)
Table 80: Australia Direct Air Capture Market, by End User, 2023–2035 (USD Million) China Market
Table 81: China Direct Air Capture Market, 2023–2035 (USD Million)
Table 82: China Direct Air Capture Market, by Technology, 2023–2035 (USD Million)
Table 83: China Direct Air Capture Market, by Capture Method, 2023–2035 (USD Million)
Table 84: China Direct Air Capture Market, by End User, 2023–2035 (USD Million) South Korea Market
Table 85: South Korea Direct Air Capture Market, 2023–2035 (USD Million)
Table 86: South Korea Direct Air Capture Market, by Technology, 2023–2035 (USD Million)
Table 87: South Korea Direct Air Capture Market, by Capture Method, 2023–2035 (USD Million)
Table 88: South Korea Direct Air Capture Market, by End User, 2023–2035 (USD Million) India Market
Table 89: India Direct Air Capture Market, 2023–2035 (USD Million)
Table 90: India Direct Air Capture Market, by Technology, 2023–2035 (USD Million)
Table 91: India Direct Air Capture Market, by Capture Method, 2023–2035 (USD Million)
Table 92: India Direct Air Capture Market, by End User, 2023–2035 (USD Million) Singapore Market
Table 93: Singapore Direct Air Capture Market, 2023–2035 (USD Million)
Table 94: Singapore Direct Air Capture Market, by Technology, 2023–2035 (USD Million)
Table 95: Singapore Direct Air Capture Market, by Capture Method, 2023–2035 (USD Million)
Table 96: Singapore Direct Air Capture Market, by End User, 2023–2035 (USD Million) Rest of Asia-Pacific Market
Table 97: Rest of Asia-Pacific Direct Air Capture Market, 2023–2035 (USD Million)
Table 98: Rest of Asia-Pacific Direct Air Capture Market, by Technology, 2023–2035 (USD Million)
Table 99: Rest of Asia-Pacific Direct Air Capture Market, by Capture Method, 2023–2035 (USD Million)
Table 100: Rest of Asia-Pacific Direct Air Capture Market, by End User, 2023–2035 (USD Million) Latin America Market
Table 101: Latin America Direct Air Capture Market, 2023–2035 (USD Million)
Table 102: Latin America Direct Air Capture Market, by Technology, 2023–2035 (USD Million)
Table 103: Latin America Direct Air Capture Market, by Capture Method, 2023–2035 (USD Million)
Table 104: Latin America Direct Air Capture Market, by End User, 2023–2035 (USD Million)
Table 105: Latin America Direct Air Capture Market, by Country, 2023–2035 (USD Million) Brazil Market
Table 106: Brazil Direct Air Capture Market, 2023–2035 (USD Million)
Table 107: Brazil Direct Air Capture Market, by Technology, 2023–2035 (USD Million)
Table 108: Brazil Direct Air Capture Market, by Capture Method, 2023–2035 (USD Million)
Table 109: Brazil Direct Air Capture Market, by End User, 2023–2035 (USD Million) Chile Market
Table 110: Chile Direct Air Capture Market, 2023–2035 (USD Million)
Table 111: Chile Direct Air Capture Market, by Technology, 2023–2035 (USD Million)
Table 112: Chile Direct Air Capture Market, by Capture Method, 2023–2035 (USD Million)
Table 113: Chile Direct Air Capture Market, by End User, 2023–2035 (USD Million) Mexico Market
Table 114: Mexico Direct Air Capture Market, 2023–2035 (USD Million)
Table 115: Mexico Direct Air Capture Market, by Technology, 2023–2035 (USD Million)
Table 116: Mexico Direct Air Capture Market, by Capture Method, 2023–2035 (USD Million)
Table 117: Mexico Direct Air Capture Market, by End User, 2023–2035 (USD Million) Rest of Latin America Market
Table 118: Rest of Latin America Direct Air Capture Market, 2023–2035 (USD Million)
Table 119: Rest of Latin America Direct Air Capture Market, by Technology, 2023–2035 (USD Million)
Table 120: Rest of Latin America Direct Air Capture Market, by Capture Method, 2023–2035 (USD Million)
Table 121: Rest of Latin America Direct Air Capture Market, by End User, 2023–2035 (USD Million) Middle East & Africa Market
Table 122: Middle East & Africa Direct Air Capture Market, 2023–2035 (USD Million)
Table 123: Middle East & Africa Direct Air Capture Market, by Technology, 2023–2035 (USD Million)
Table 124: Middle East & Africa Direct Air Capture Market, by Capture Method, 2023–2035 (USD Million)
Table 125: Middle East & Africa Direct Air Capture Market, by End User, 2023–2035 (USD Million)
Table 126: Middle East & Africa Direct Air Capture Market, by Country, 2023–2035 (USD Million) United Arab Emirates (UAE) Market
Table 127: UAE Direct Air Capture Market, 2023–2035 (USD Million)
Table 128: UAE Direct Air Capture Market, by Technology, 2023–2035 (USD Million)
Table 129: UAE Direct Air Capture Market, by Capture Method, 2023–2035 (USD Million)
Table 130: UAE Direct Air Capture Market, by End User, 2023–2035 (USD Million) Saudi Arabia Market
Table 131: Saudi Arabia Direct Air Capture Market, 2023–2035 (USD Million)
Table 132: Saudi Arabia Direct Air Capture Market, by Technology, 2023–2035 (USD Million)
Table 133: Saudi Arabia Direct Air Capture Market, by Capture Method, 2023–2035 (USD Million)
Table 134: Saudi Arabia Direct Air Capture Market, by End User, 2023–2035 (USD Million) Qatar Market
Table 135: Qatar Direct Air Capture Market, 2023–2035 (USD Million)
Table 136: Qatar Direct Air Capture Market, by Technology, 2023–2035 (USD Million)
Table 137: Qatar Direct Air Capture Market, by Capture Method, 2023–2035 (USD Million)
Table 138: Qatar Direct Air Capture Market, by End User, 2023–2035 (USD Million) Oman Market
Table 139: Oman Direct Air Capture Market, 2023–2035 (USD Million)
Table 140: Oman Direct Air Capture Market, by Technology, 2023–2035 (USD Million)
Table 141: Oman Direct Air Capture Market, by Capture Method, 2023–2035 (USD Million)
Table 142: Oman Direct Air Capture Market, by End User, 2023–2035 (USD Million) Rest of Middle East & Africa Market
Table 143: Rest of Middle East & Africa Direct Air Capture Market, 2023–2035 (USD Million)
Table 144: Rest of Middle East & Africa Direct Air Capture Market, by Technology, 2023–2035 (USD Million)
Table 145: Rest of Middle East & Africa Direct Air Capture Market, by Capture Method, 2023–2035 (USD Million)
Table 146: Rest of Middle East & Africa Direct Air Capture Market, by End User, 2023–2035 (USD Million)
List of Figures
Figure 1: Global Direct Air Capture Market Size, 2023–2035 (USD Million)
Figure 2: Global Direct Air Capture Market Growth, Y-o-Y % Growth, 2025-2035
Figure 3: Global Direct Air Capture Market, by Technology, 2025 vs. 2032 (%)
Figure 4: Global Direct Air Capture Market, by Capture Method, 2025 vs. 2032 (%)
Figure 5: Global Direct Air Capture Market, by End User, 2025 vs. 2032 (%)
Figure 6: Global Direct Air Capture Market, by Region/Country, 2025 vs. 2032 (%)
Figure 7: Impact Assessment of Market Drivers on Global Direct Air Capture Market (2025-2032)
Figure 8: Impact Assessment of Market Restraints on Global Direct Air Capture Market (2025-2032)
Figure 9: Impact Assessment of Market Opportunities on Global Direct Air Capture Market (2025-2032)
Figure 10: Porter's Five Forces Analysis: Global Direct Air Capture Market
Figure 11: Direct Air Capture Capacity by Region, 2024
Figure 12: Key Regulatory Frameworks for Carbon Capture by Region
Figure 13: Investment Trends in Direct Air Capture Technology, 2022-2025
Figure 14: Carbon Removal Cost Comparison by Technology
Figure 15: Direct Air Capture Technology Evolution, 2020-2030
Figure 16: Carbon Intensity Reduction Potential: Direct Air Capture vs. Other CDR Methods
Figure 17: Global Carbon Removal Market Growth Timeline, 2023–2035
Figure 18: North America Direct Air Capture Market Snapshot, 2025-2035 (USD Million)
Figure 19: North America Direct Air Capture Market Share, by Country, 2025 vs. 2035 (%)
Figure 20: Europe Direct Air Capture Market Snapshot, 2025-2035 (USD Million)
Figure 21: Europe Direct Air Capture Market Share, by Country, 2025 vs. 2035 (%)
Figure 22: Asia-Pacific Direct Air Capture Market Snapshot, 2025-2035 (USD Million)
Figure 23: Asia-Pacific Direct Air Capture Market Share, by Country, 2025 vs. 2035 (%)
Figure 24: Latin America Direct Air Capture Market Snapshot, 2025-2035 (USD Million)
Figure 25: Latin America Direct Air Capture Market Share, by Country, 2025 vs. 2035 (%)
Figure 26: Middle East & Africa Direct Air Capture Market Snapshot, 2025-2035 (USD Million)
Figure 27: Middle East & Africa Direct Air Capture Market Share, by Country, 2025 vs. 2035 (%)


Published Date: Apr-2026
Published Date: Apr-2026
Published Date: May-2026
Subscribe to get the latest industry updates