Resources
About Us
Sugar-free Products Market by Type (Beverages, Food Products, Tabletop, Others); Sweetening Type (Sugar Substitute-sweetened Sugar-free Products, Naturally Sweetened); Distribution Channel (Supermarkets & Hypermarkets, Others) - Global Forecast to 2036
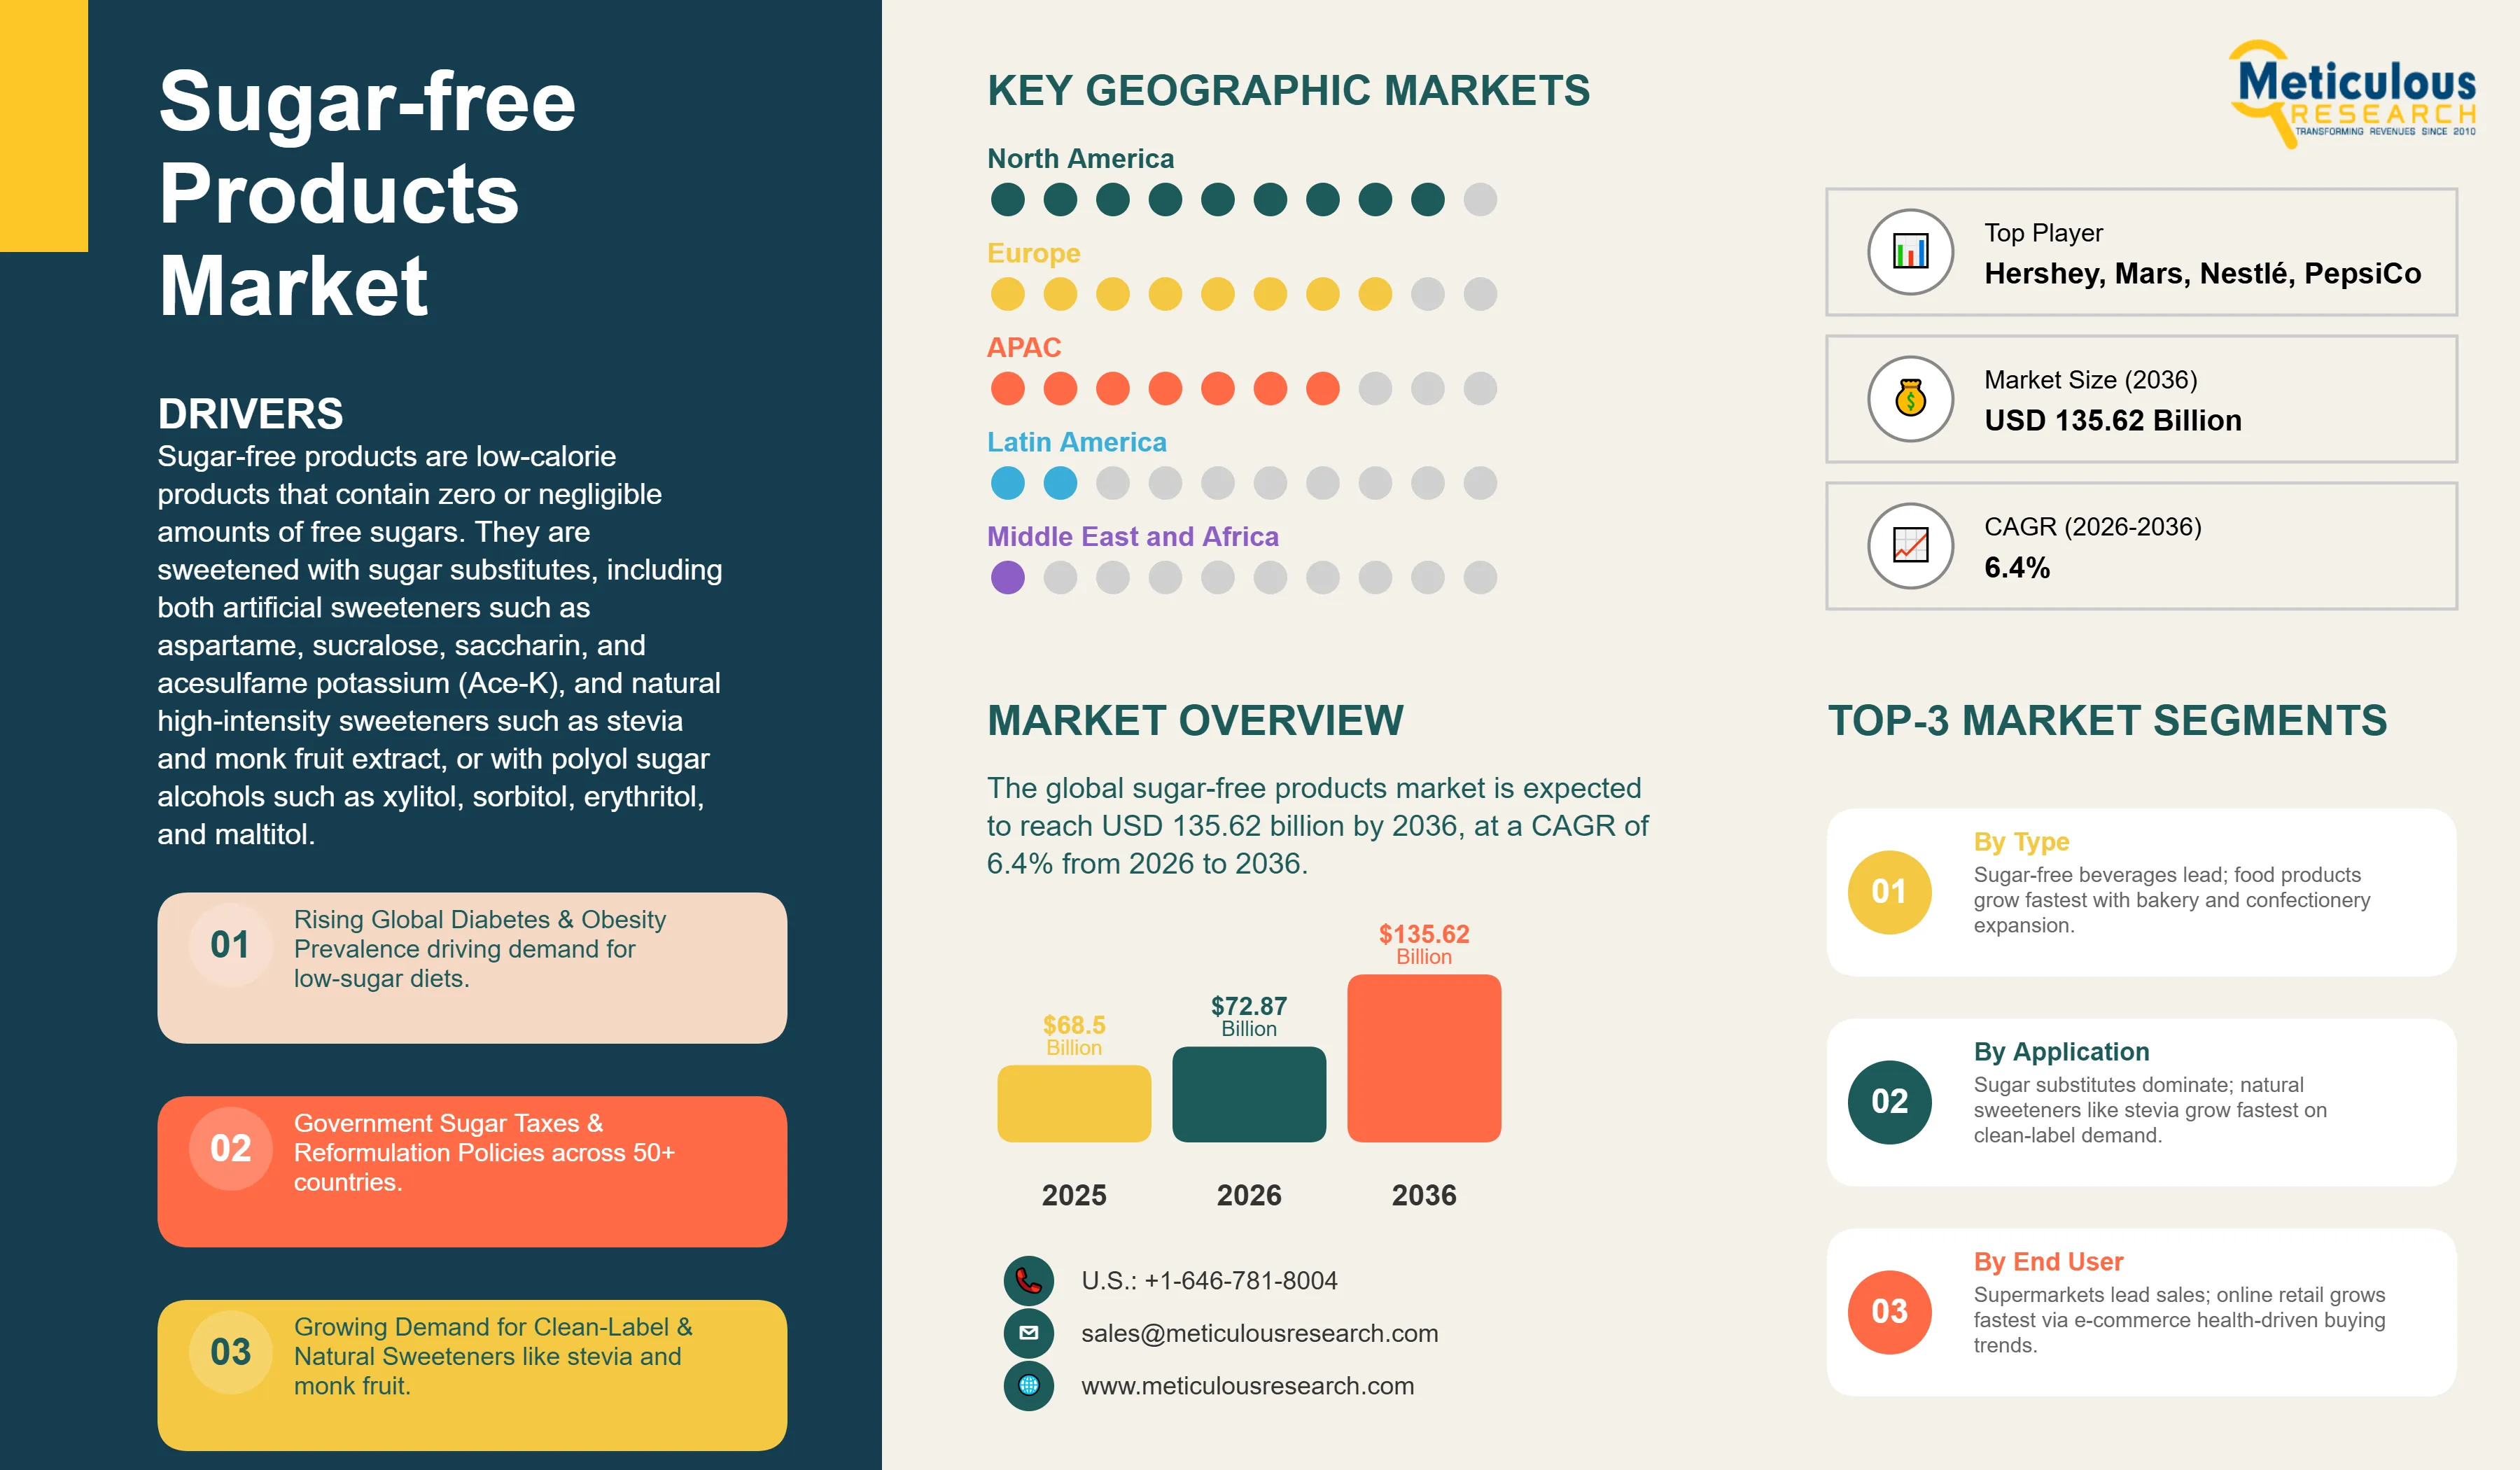
Report ID: MRFB - 104649 Pages: 215 Mar-2026 Formats*: PDF Category: Food and Beverages Delivery: 24 to 48 Hours Download Free Sample ReportThe global sugar-free products market was valued at USD 68.50 billion in 2025. This market is expected to reach USD 135.62 billion by 2036 from USD 72.87 billion in 2026, at a CAGR of 6.4% from 2026 to 2036.
Sugar-free products are low-calorie products that contain zero or negligible amounts of free sugars. They are sweetened with sugar substitutes, including both artificial sweeteners such as aspartame, sucralose, saccharin, and acesulfame potassium (Ace-K), and natural high-intensity sweeteners such as stevia and monk fruit extract, or with polyol sugar alcohols such as xylitol, sorbitol, erythritol, and maltitol. Sugar-free products are positioned as a healthy alternative to sugar-containing products, offering a similar taste profile while helping reduce caloric intake and supporting the management of blood glucose levels.
The growth of this market is driven by the rising global incidence of diabetes and obesity, the increasing demand for low-calorie and reduced-sugar food and beverage products, and the expanding use of sugar taxes and sugar reduction policies by governments in more than 50 countries. Furthermore, the growing market for GLP-1-friendly functional food and beverage products, the rising consumer focus on health and wellness, and the increasing availability of natural high-intensity sweeteners as clean-label alternatives to artificial sweeteners are expected to offer significant opportunities for market growth. However, the higher prices of sugar-free products compared to conventional sugar-containing products, growing consumer skepticism about the health effects of certain artificial sweeteners, and the WHO’s 2023 recommendation against the use of non-sugar sweeteners for weight control present challenges to the growth of this market.
 Click here to: Get Free Sample Pages of this Report
Sugar-free products encompass a broad range of food and beverage categories formulated without the addition of free sugars, including sugar-free beverages (carbonated soft drinks, energy drinks, sports drinks, ready-to-drink teas and coffees, juices, and water enhancers); sugar-free food products (bakery products, confectionery including chocolate, gums and mints, sweets and candies, and dairy products); sugar-free nutrition and health supplements (protein bars, meal replacement products, and dietary supplements); tabletop sweeteners; and other sugar-free products. These products are sweetened with a range of alternative sweetening systems including high-intensity artificial sweeteners, natural high-intensity sweeteners, and sugar alcohols, used individually or in combination to achieve the desired taste profile, mouthfeel, and functional properties.
The rising global prevalence of diabetes is a key driver of the sugar-free products market. According to the International Diabetes Federation (IDF), approximately 537 million adults aged 20 to 79 years were living with diabetes globally, representing nearly 1 in 10 adults. This number is projected to rise to over 780 million by 2045. Diabetes accounts for millions of deaths annually and results in global health expenditures approaching USD 1 trillion. Approximately 44% of adults living with diabetes remain undiagnosed. The growing global diabetes burden is driving demand for sugar-free food and beverage products that support blood glucose management and healthier dietary patterns.
In addition to diabetes, the rising global prevalence of obesity and the growing consumer focus on weight management, metabolic health, and overall wellness are driving demand for sugar-free products. The rapid expansion of the GLP-1 receptor agonist drug market is beginning to reshape food and beverage purchasing behavior, particularly in developed markets. A growing share of adults in the U.S. are using GLP-1 medications, contributing to reduced consumption of sugar-sweetened beverages, confectionery, and calorie-dense packaged snacks. In response, food manufacturers are actively reformulating and repositioning products to align with evolving dietary needs.
In early 2025, Conagra Brands introduced “GLP-1 friendly” labeling across select Healthy Choice frozen meals, highlighting higher protein and nutrient-dense formulations. In April 2025, Nestlé S.A. launched science-backed protein beverages designed to support hunger management and muscle retention among GLP-1 users, while Danone S.A. expanded its high-protein Oikos portfolio to address similar consumer needs. Retailers have also begun adapting their assortments; in early 2026, Marks & Spencer introduced a nutrient-dense product range tailored to consumers using weight-management medications. These developments signal a growing convergence between pharmaceutical weight management trends and functional, sugar-free food and beverage innovation.
Growing Consumer Preference for Natural High-Intensity Sweeteners and Clean-Label Formulations
A significant trend in the sugar-free products market is the growing consumer preference for products sweetened with natural high-intensity sweeteners, particularly stevia (Stevia rebaudiana leaf extracts) and monk fruit (luo han guo) extract, as alternatives to artificial sweeteners. Rising demand for clean-label products formulated with ingredients perceived as natural and minimally processed is driving reformulation efforts by major food and beverage manufacturers. Global beverage and packaged food companies are increasingly incorporating stevia-based blends and monk fruit extracts into zero-sugar and reduced-sugar portfolios to meet regulatory sugar reduction targets and evolving consumer preferences. Numerous sugar-free confectionery, dairy, and beverage products incorporating stevia glycosides reflect the mainstream adoption of natural high-intensity sweeteners across developed and emerging markets.
The growing availability of next-generation stevia ingredients with improved taste profiles, including rebaudioside M (Reb M) and rebaudioside D (Reb D) glycosides with reduced bitterness and a more sucrose-like sensory profile, is accelerating the replacement of artificial sweeteners in a wider range of applications. Major ingredient suppliers such as Cargill (EverSweet), PureCircle (an Ingredion company), and Roquette have invested significantly in the commercial-scale production of high-purity steviol glycosides. In particular, fermentation-derived Reb M production is improving cost efficiency and supply scalability, driving broader adoption of stevia in sugar-free beverages, dairy products, and packaged foods during the forecast period.
Rising Demand for GLP-1-Friendly Sugar-free Products and Functional Food and Beverage Innovation
The rapid expansion of GLP-1 receptor agonist medication use for weight management and diabetes is creating a strong demand for sugar-free, nutrient-dense food and beverage products. According to recent research, approximately 23% of U.S. households now include someone using a GLP-1 medication, and these households are projected to represent a significant proportion of U.S. food and beverage unit sales by 2030, reflecting evolving purchasing behaviors linked to health-oriented diets. Surveys indicate that around 12% of U.S. adults currently take GLP-1 drugs such as Ozempic or Wegovy, with adoption particularly high among older adults. Emerging real-world studies show that households with GLP-1 users reduce overall grocery spending, particularly on snacks, sweets, and sugar-rich products, and shift toward higher-protein, nutrient-dense items. This trend is prompting food manufacturers to develop sugar-free, high-protein, and functional offerings tailored to the nutritional needs of this growing consumer segment.
|
Report Coverage |
Details |
|
Market Size by 2036 |
USD 135.62 Billion |
|
Market Size in 2025 |
USD 68.50 Billion |
|
Market Size in 2026 |
USD 72.87 Billion |
|
Market Growth Rate (2026–2036) |
CAGR of 6.4% |
|
Dominating Region |
North America |
|
Fastest Growing Region |
Asia-Pacific |
|
Base Year |
2025 |
|
Forecast Period |
2026 to 2036 |
|
Segments Covered |
By Type: Sugar-free Beverages (Carbonated Soft Drinks, Energy & Sports Drinks, Ready-to-Drink Tea & Coffee, Functional Beverages, Others); Sugar-free Food Products (Bakery Products, Confectionery, Dairy Products, Snacks, Others); Nutrition & Health Supplements; Tabletop Sweeteners; Other Sugar-free Products. By Sweetening Type: Artificial Sweeteners (Sucralose, Aspartame, Acesulfame Potassium, Saccharin, Neotame); Natural Sweeteners (Stevia, Monk Fruit, Allulose, Rare Sugars); Polyols (Sorbitol, Xylitol, Erythritol, Maltitol); Other Sweeteners. By Distribution Channel: Supermarkets & Hypermarkets, Convenience Stores, Online Retail, Specialty Stores, Other Distribution Channels. By Geography: North America, Europe, Asia-Pacific, Latin America, Middle East & Africa. |
|
Regions Covered |
North America, Europe, Asia-Pacific, Latin America, Middle East & Africa |
Why Does the Sugar-free Beverages Segment Dominate the Sugar-free Products Market?
Based on type, in 2026, the sugar-free beverages segment is expected to account for the largest share of the global sugar-free products market. The large market share of this segment is mainly attributed to the health benefits of sweeteners in beverages, including support for weight control and the prevention of type 2 diabetes, the increasing number of product developments and launches of sugar-free beverages by leading global beverage manufacturers, and the increasing demand for natural health and sports drinks with enhanced nutritional value. Diet and zero-sugar carbonated soft drink variants from The Coca-Cola Company, PepsiCo Inc., and other major beverage manufacturers account for a substantial share of the sugar-free beverages segment, driven by well-established distribution networks and strong consumer brand recognition.
The sugar-free food products segment is expected to register the fastest CAGR during the forecast period. The faster growth of this segment is driven by increasing consumer awareness of the sugar content of packaged food products, the growing availability of sugar-free bakery, confectionery, and dairy products at accessible price points, and the expansion of sugar-free product ranges by leading food manufacturers in categories including chocolate, gums and mints, cookies and biscuits, and dairy desserts. The growing availability of improved natural sweetener ingredients that enable better taste, texture, and shelf stability in baked goods and confectionery is supporting product development in this segment.
Why Does the Sugar Substitute-sweetened Segment Dominate?
Based on sweetening type, in 2026, the sugar substitute-sweetened sugar-free products segment is expected to account for the largest share of the global sugar-free products market. The large market share of this segment is attributed to the low caloric value, broad regulatory approval, established supply chains, and taste performance of sugar substitutes including sucralose, aspartame, acesulfame potassium, and stevia across a wide range of food and beverage applications. Sugar substitute-sweetened sugar-free products include the majority of diet and zero-sugar carbonated beverages, sugar-free confectionery, and sugar-free dairy products available globally.
However, the naturally sweetened sugar-free products segment is expected to register the fastest CAGR during the forecast period. The faster growth of this segment is driven by the growing consumer preference for natural, clean-label sweetener ingredients, the increasing availability of high-purity stevia glycosides and monk fruit extract at commercially viable price points, and the growing adoption of allulose and rare sugars in sugar-free product formulations. The trend toward natural sweeteners is particularly pronounced in premium consumer segments and in markets where consumer awareness of ingredient labels is high, including North America and Western Europe.
How is North America Maintaining Dominance in the Sugar-free Products Market?
Based on geography, in 2026, North America is expected to account for the largest share of the global sugar-free products market. The major share of this regional market is attributed to the high prevalence of obesity and diabetes in the U.S. and Canada, the well-established food and beverage industry infrastructure, strong consumer demand for sugar-free and reduced-calorie products, the presence of leading global food and beverage manufacturers, and the early and widespread adoption of sugar-free product varieties across multiple categories.
Which Factors Support the Growth of the Asia-Pacific Sugar-free Products Market?
Asia-Pacific is expected to register the fastest CAGR during the forecast period of 2026 to 2036. The high growth rate in Asia-Pacific is driven by the changing lifestyles, the rising trend of consuming healthy food and food ingredients, the increasing awareness about the health benefits of consuming sugar-free products, rapid urbanization, and the growing diabetic and obese population in the region. According to the IDF Diabetes Atlas 11th Edition (2025), China is estimated to have the largest absolute number of adults with diabetes globally. India also has one of the world’s largest diabetic populations. Government taxes imposed on sugar-sweetened products in several Asia-Pacific countries are further contributing to the growth of the sugar-free products market in the region, alongside rising consumer health consciousness and disposable incomes.
The report provides a detailed competitive landscape based on an extensive assessment of the key growth strategies adopted by leading market players in the global sugar-free products market. The key players profiled in this report include The Coca-Cola Company (U.S.), PepsiCo, Inc. (U.S.), Nestlé S.A. (Switzerland), Mars, Incorporated (U.S.), Mondelez International, Inc. (U.S.), The Hershey Company (U.S.), The Kraft Heinz Company (U.S.), Lindt & Sprüngli AG (Switzerland), Keurig Dr Pepper, Inc. (U.S.), Danone S.A. (France), Abbott Laboratories (U.S.), Reckitt Benckiser Group plc (U.K.), Perfetti Van Melle Group B.V. (Netherlands), Ferrero International S.A. (Luxembourg), Glanbia plc (Ireland), and Zydus Wellness Ltd. (India), among others. These companies are actively engaged in product reformulation, portfolio expansion, strategic acquisitions, and innovation in natural sweeteners, functional nutrition, and clean-label positioning to strengthen their presence in the evolving sugar-free products market.
Sugar-free Products Market, by Type
Sugar-free Products Market, by Sweetening Type
Sugar-free Products Market, by Distribution Channel
Sugar-free Products Market, by Geography
The sugar-free products market is expected to reach USD 135.62 billion by 2036, at a CAGR of 6.4% from 2026 to 2036.
Based on type, the sugar-free food products segment is expected to register the fastest growth rate during the forecast period and provide significant opportunities for players operating in this market.
Based on sweetening type, the naturally sweetened sugar-free products segment is expected to register the highest CAGR during the forecast period, driven by growing consumer preference for natural, clean-label sweetener ingredients including stevia and monk fruit extract.
Rising global incidence of diabetes and obesity; increasing demand for low-calorie food products; sugar taxes imposed on drinks containing sugar; growing GLP-1 medication user population driving demand for GLP-1-friendly sugar-free products; and increasing availability of natural high-intensity sweetener ingredients.
Higher prices of sugar-free products compared to conventional alternatives; growing consumer skepticism about artificial sweeteners following the IARC Group 2B classification of aspartame (July 2023); and the WHO’s 2023 recommendation against the use of non-sugar sweeteners for weight control.
The major players operating in the global sugar-free products market include The Coca-Cola Company (U.S.), PepsiCo, Inc. (U.S.), Nestlé S.A. (Switzerland), Mars, Incorporated (U.S.), Mondelez International, Inc. (U.S.), The Hershey Company (U.S.), The Kraft Heinz Company (U.S.), Lindt & Sprüngli AG (Switzerland), Keurig Dr Pepper, Inc. (U.S.), Danone S.A. (France), Abbott Laboratories (U.S.), Reckitt Benckiser Group plc (U.K.), Perfetti Van Melle Group B.V. (Netherlands), Ferrero International S.A. (Luxembourg), Glanbia plc (Ireland), and Zydus Wellness Ltd. (India), among others.
Asia-Pacific is expected to register significant market growth during the forecast period of 2026 to 2036.


Published Date: Jan-2025
Published Date: Nov-2024
Published Date: Jun-2024
Published Date: Jan-2024
Please enter your corporate email id here to view sample report.
Subscribe to get the latest industry updates