Resources
About Us
Phycocyanin Market Size, Share, Forecast, & Trends Analysis by Form (Powder, Liquid), Grade (Food-grade, Reagent grade, Cosmetic-grade Phycocyanin), Category (Non-Organic, Organic), Application (Food & Beverages, Pharmaceuticals) – Global Forecast to 2036
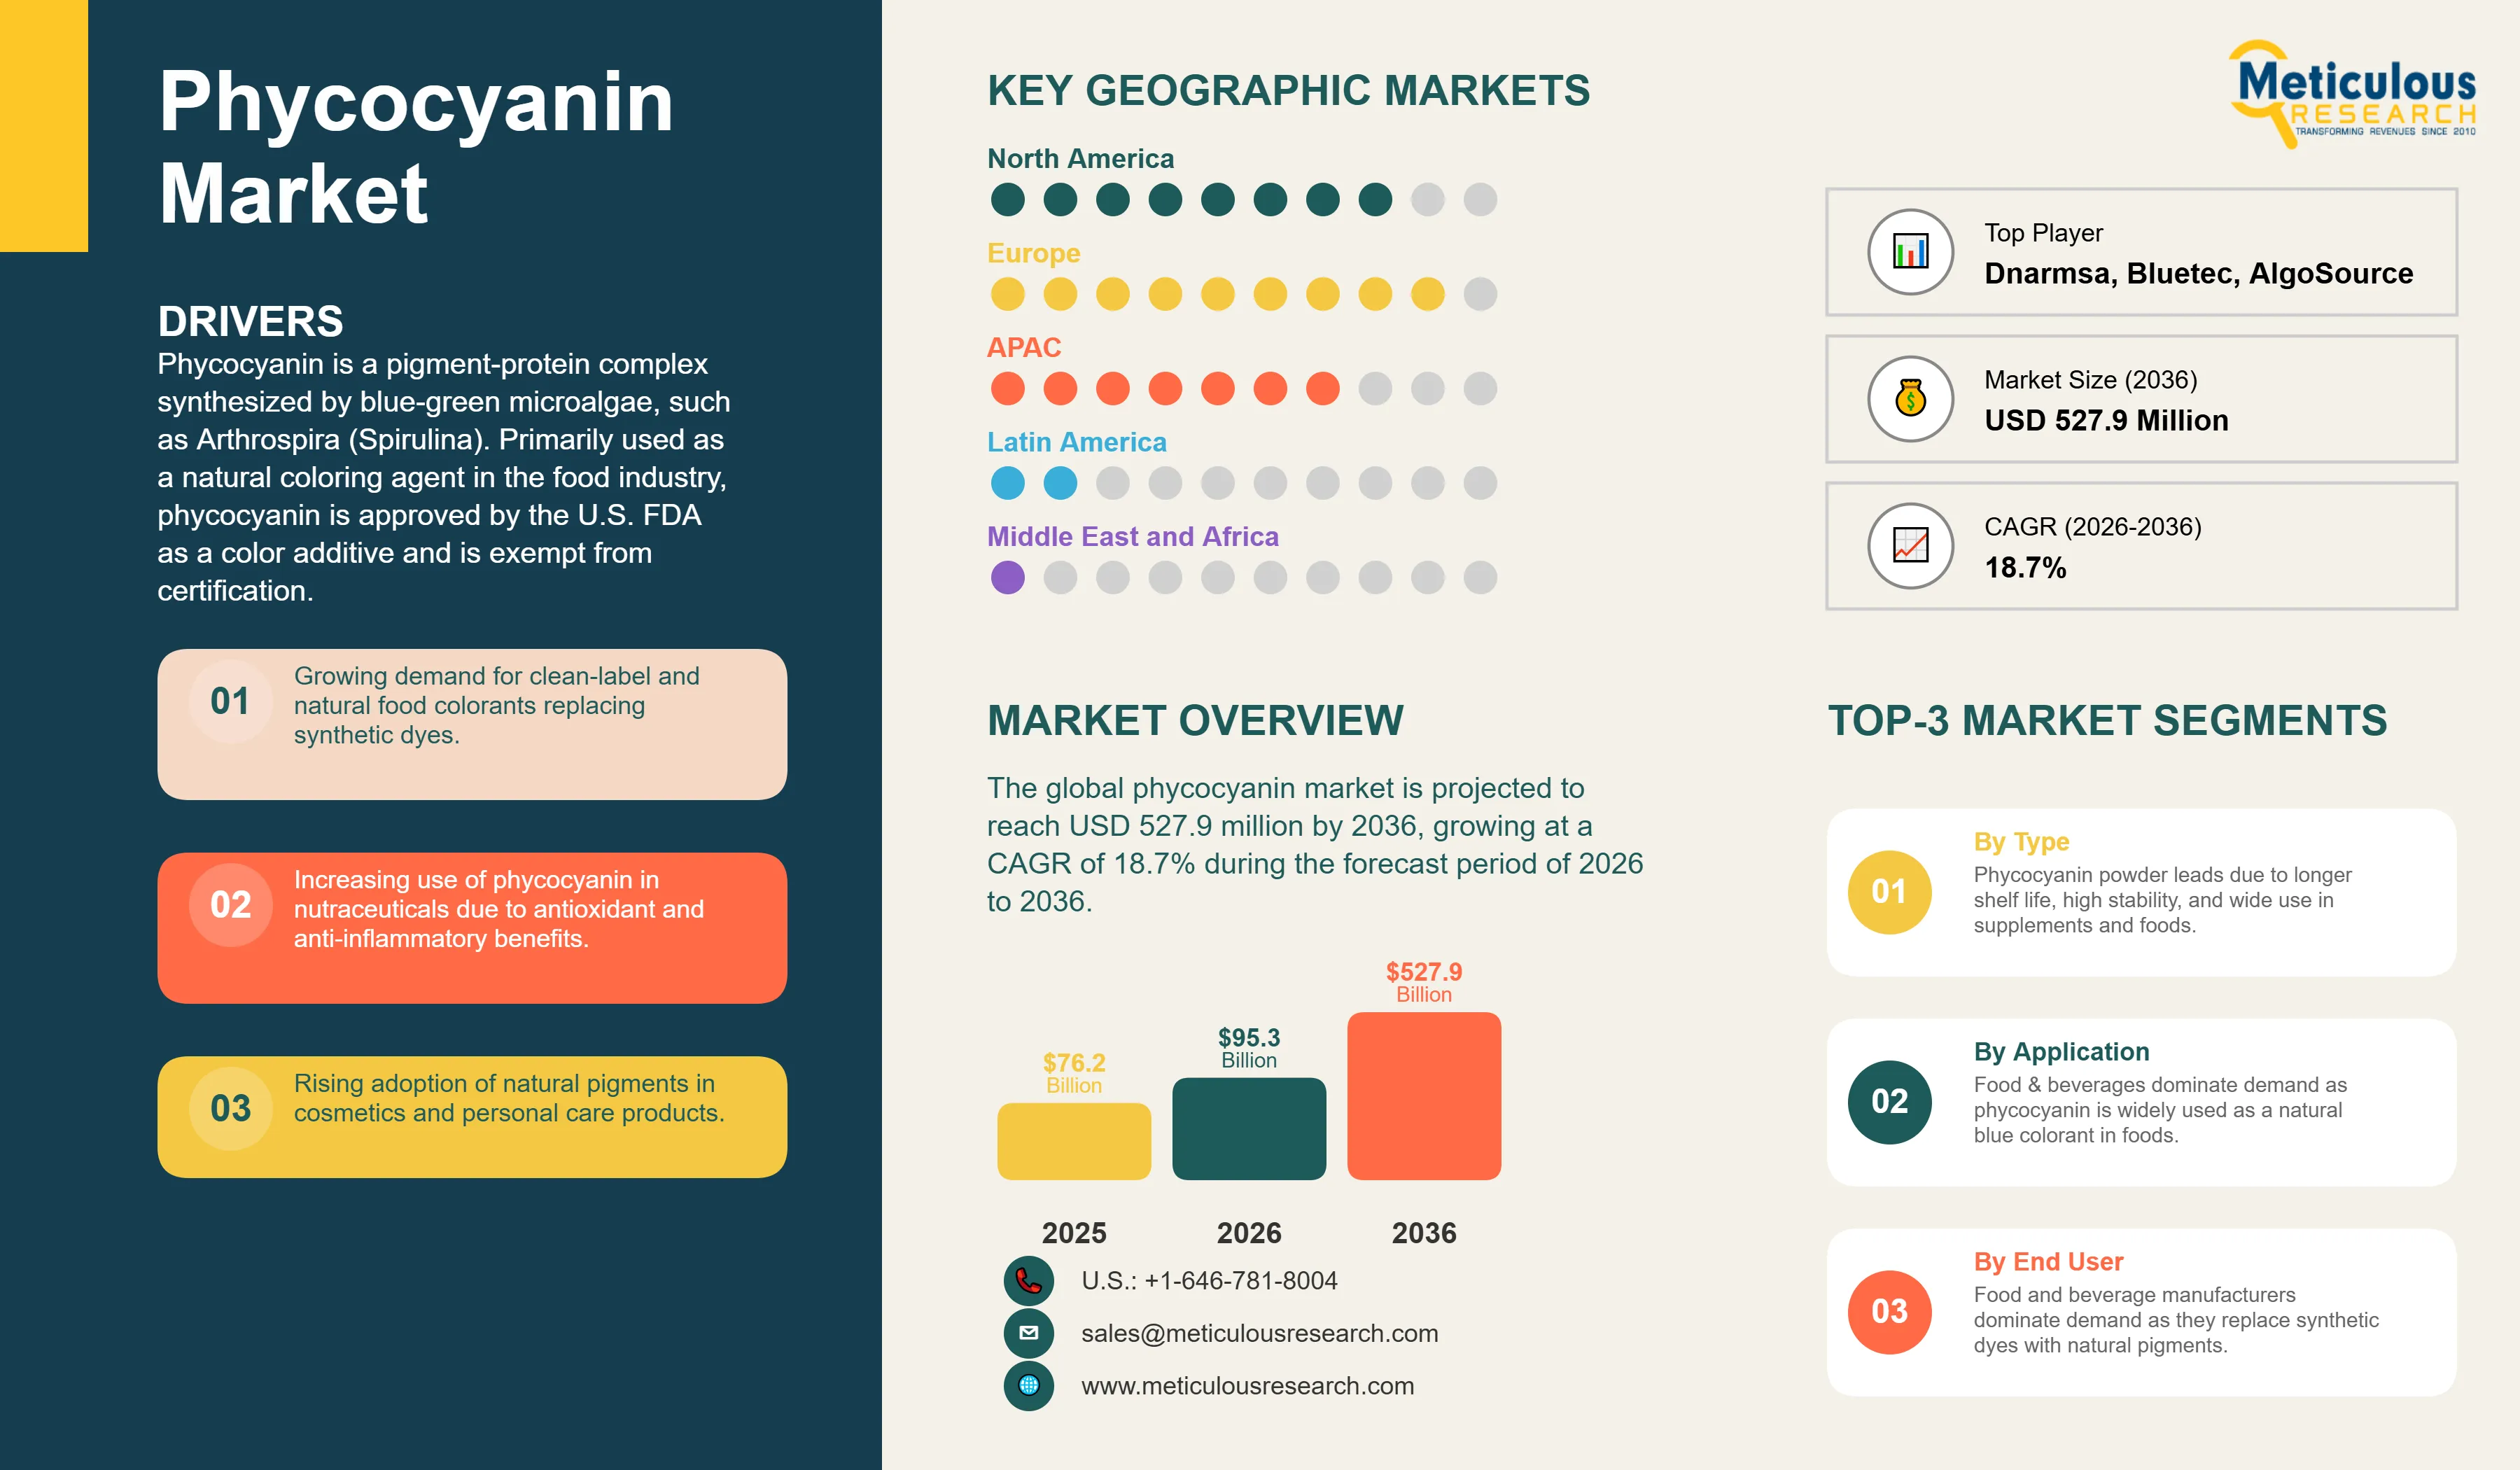
Report ID: MRFB - 104430 Pages: 194 Mar-2026 Formats*: PDF Category: Food and Beverages Delivery: 24 to 48 Hours Download Free Sample ReportThe global phycocyanin market was valued at USD 76.2 million in 2025. This market is projected to reach USD 527.9 million by 2036 from an estimated USD 95.3 million in 2026, growing at a CAGR of 18.7% during the forecast period of 2026 to 2036.
In terms of volume, the market is projected to reach 6,842 tons by 2036 from an estimated 1,098 tons in 2026, growing at a CAGR of 20.1% during the forecast period.
Phycocyanin is a pigment-protein complex synthesized by blue-green microalgae, such as Arthrospira (Spirulina). Primarily used as a natural coloring agent in the food industry, phycocyanin is approved by the U.S. FDA as a color additive and is exempt from certification. This natural pigment demonstrates antioxidant activity both in vivo and in vitro, qualifying it as a nutraceutical compound. It is commonly used as a dietary supplement and exhibits antioxidant, anticancer, and anti-inflammatory pharmacological properties. Additionally, phycocyanin is widely utilized as a natural blue dye in commercial applications within the food and cosmetics industries.
The phycocyanin market has witnessed meaningful regulatory and commercial developments in recent years. Spirulina-derived phycocyanin has gained increasing regulatory acceptance as a natural blue colorant in major food markets, including the U.S. and Europe, supporting its growing use in food and beverage applications. The growing demand for clean-label ingredients and natural food colorants has accelerated the commercialization of phycocyanin across confectionery, dairy, beverage, and nutraceutical products. Several spirulina producers such as Fuqing King Dnarmsa Spirulina Co., Ltd. and Zhejiang Binmei Biotechnology Co., Ltd., have continued expanding their production capacity and product offerings to support the growing demand for spirulina extracts and phycocyanin-based ingredients. At the same time, leading food and beverage manufacturers are increasingly incorporating spirulina-derived colorants into product formulations as part of broader clean-label and sustainability initiatives. These developments are expected to continue driving strong demand for phycocyanin over the forecast period.
Click here to: Get Free Sample Pages of this Report
Rising Clean-Label Movement and Shift Away from Synthetic Colorants
The increasing global clean-label movement is one of the most significant trends driving the phycocyanin market. Consumers across North America, Europe, and Asia-Pacific are increasingly scrutinizing ingredient labels and expressing strong preferences for natural, recognizable, and plant-derived ingredients over synthetic chemical additives. According to the International Food Information Council (IFIC) Food & Health Survey, nearly seven in ten consumers consider ingredient transparency an important factor when purchasing food products, reflecting the growing demand for clean-label formulations.
Growing consumer concerns regarding artificial food colors and the broader shift toward natural and minimally processed foods are encouraging food and beverage manufacturers to reformulate products using natural colorant alternatives. In response to this trend, regulatory authorities have expanded the approved uses of natural colorants. For example, spirulina extract (the primary commercial source of phycocyanin) is listed by the U.S. Food and Drug Administration (FDA) as a color additive exempt from certification and is permitted for use in various food products such as candies, chewing gum, beverages, yogurts, and frozen desserts under 21 CFR §73.530.
As noted by the Food and Agriculture Organization (FAO) and Codex Alimentarius, the limited availability of natural blue colorants has historically constrained natural product formulation, making spirulina-derived pigments valuable for food manufacturers seeking natural alternatives to synthetic dyes.
Increasing Applications in Cosmetics and Personal Care
The cosmetics and personal care segment is projected to register strong growth in the phycocyanin market during the forecast period, driven by the increasing demand for natural, plant-derived, and sustainably sourced ingredients in beauty formulations. Consumers are increasingly seeking cosmetic products formulated with natural and vegan ingredients, encouraging manufacturers to replace synthetic pigments with naturally derived alternatives.
The deep blue pigmentation of phycocyanin, combined with its antioxidant and anti-inflammatory bioactivity, makes it well-suited for premium and wellness-positioned cosmetic products. Scientific studies published in the Journal of Applied Phycology and other peer-reviewed journals have shown that spirulina-derived compounds possess strong antioxidant properties that may help protect skin cells from oxidative stress, supporting their use in skincare and cosmetic formulations.
The growth of this segment is also driven by the broader expansion of the global cosmetics industry. According to the Personal Care Products Council, the cosmetics and personal care sector generates over USD 500 billion in global retail sales annually, creating significant opportunities for innovative natural ingredients such as phycocyanin.
Furthermore, regulatory frameworks governing cosmetic ingredients, mainly the European Union Cosmetics Regulation (EC No. 1223/2009), emphasize ingredient safety and transparency, encouraging the use of naturally derived pigments in cosmetic formulations. As a result, cosmetic-grade phycocyanin is increasingly incorporated into products such as lipsticks, eyeliners, eye shadows, hair color formulations, and skincare products.
The global phycocyanin market was valued at USD 76.2 million in 2025. This market is projected to reach USD 527.9 million by 2036 from an estimated USD 95.3 million in 2026, growing at a CAGR of 18.7% during the forecast period of 2026 to 2036.
In terms of volume, the market is projected to reach 6,842 tons by 2036 from an estimated 1,098 tons in 2026, growing at a CAGR of 20.1% during the forecast period.
|
Report Coverage |
Details |
|
Market Size (Value) by 2036 |
USD 527.9 Million |
|
Market Size (Volume) by 2036 |
~6,842 Tons |
|
Market Size (Value) in 2025 |
USD 76.2 Million |
|
Market Size (Value) in 2026 |
USD 95.3 Million |
|
Market Growth Rate (Value) |
CAGR of 18.7% (2026–2036) |
|
Market Growth Rate (Volume) |
CAGR of 20.1% (2026–2036) |
|
Dominating Region |
Europe |
|
Fastest Growing Region |
Asia-Pacific |
|
Dominating Form Segment |
Phycocyanin Powder |
|
Fastest Growing Form Segment |
Liquid Phycocyanin |
|
Dominating Grade Segment |
Food-Grade Phycocyanin |
|
Fastest Growing Grade Segment |
Cosmetic-Grade Phycocyanin |
|
Dominating Application Segment |
Food & Beverages |
|
Fastest Growing Application |
Cosmetics |
|
Dominating Category |
Non-Organic |
|
Fastest Growing Category |
Organic Phycocyanin |
|
Base Year |
2025 |
|
Forecast Period |
2026 to 2036 |
|
Segments Covered |
By Form: Phycocyanin Powder; Liquid Phycocyanin By Grade: Food-Grade; Cosmetic-Grade; Reagent- & Analytical-Grade By Category: Organic; Non-Organic By Application: Food & Beverages; Pharmaceuticals & Nutraceuticals; Cosmetics; Diagnostics & Biomedical |
|
Countries Covered |
North America (U.S., Canada); Europe (France, Germany, U.K., Italy, Spain, Netherlands, Denmark, Sweden, Rest of Europe); Asia-Pacific (China, India, Japan, Australia, Thailand, Rest of Asia-Pacific); Latin America (Brazil, Mexico, Rest of Latin America); Middle East & Africa (Egypt, Saudi Arabia, South Africa, UAE, Rest of MEA) |
|
Key Companies |
AlgoSource S.A., Bluetec Naturals Co., Ltd., DIC Corporation, E.I.D. – Parry (India) Limited, Fuqing King Dnarmsa Spirulina Co., Ltd., GNT Group B.V., Hangzhou OuQi Food Co., Ltd., Inner Mongolia Rejuve Biotech Co., Ltd., Japan Algae Co., Ltd., Jiangshan Comp Spirulina Co., Ltd., Pond Technologies Inc., Qingdao Haizhijiao Biotechnology Co., Ltd., Qingdao ZolanBio Co., Ltd., SPIFORM, Tianjin Norland Biotech Co., Ltd., Wellisen Nutraceuticals, Xi’an Fengzu Biological Technology Co., Ltd. (FZBIOTECH), Yunnan Green A Biological Project Co., Ltd., and Zhejiang Binmei Biotechnology Co., Ltd |
Why Does the Phycocyanin Powder Segment Dominate the Market?
Based on form, the phycocyanin powder segment is expected to account for the largest share of the global phycocyanin market in 2026. The large share of the powdered form is primarily driven by the significantly greater number of powdered phycocyanin providers compared to liquid phycocyanin suppliers, reflecting both the commercial maturity of the powder format and its compatibility with a wide range of downstream processing and formulation applications. Powdered phycocyanin offers several advantages over liquid forms: a substantially longer shelf life (typically 1–2 years for properly stored powder versus months for liquid formulations), greater ease of handling and transportation without cold chain requirements, enhanced stability to light, heat, and oxygen at ambient storage conditions, and high flexibility in dosing and formulation incorporation across powdered food, supplement, and cosmetic applications. The powdered form also facilitates effective nutrient delivery in applications such as protein powder blends, health supplement capsules, and tablet coatings. Its compatibility with standard dry-blending and powder mixing operations in food manufacturing makes it the default commercial format for most food and nutraceutical applications.
The liquid phycocyanin market is expected to grow at the fastest CAGR during the forecast period, driven by the growing application of liquid phycocyanin in premium dietary supplement formulations (liquid drops, shots, concentrated beverages), personal care and cosmetic products (serums, toners, liquid color preparations), and ready-to-use colorant formulations for beverage and food service applications. Liquid formats offer advantages of more precise dosing, immediate bioavailability in beverage applications, and flexibility in formulating stable liquid color solutions for food and cosmetic use.
Why Does the Food-Grade Phycocyanin Segment Lead by Grade?
Based on grade, the food-grade phycocyanin segment is expected to account for the largest share of the global phycocyanin market in 2026. Food-grade phycocyanin is processed and certified to meet the safety and purity standards required for direct human consumption in food products, including requirements for heavy metal content, microbial contamination limits, pesticide residues, and phycocyanin purity concentration. The rapidly growing global food and beverage industry, increasing use of phycocyanin as an alternative to synthetic colors, growing awareness of adverse effects of synthetic colors among consumers, and rising demand for clean-label brands emphasizing natural colors are collectively driving the dominant market share of this segment.
The cosmetic-grade phycocyanin segment is expected to grow at the fastest CAGR during the forecast period, driven by the growing natural cosmetics market, increasing regulatory restrictions on synthetic colorants in cosmetic formulations, and growing consumer demand for vegan and cruelty-free cosmetic products.
Why Does the Food & Beverages Segment Dominate the Phycocyanin Market?
Based on application, the food & beverages segment is expected to account for the largest share of the global phycocyanin market in 2026. The dominance of this segment is primarily attributed to the widespread use of phycocyanin as a natural blue colorant in food formulations and the large scale of the global food and beverage industry. Phycocyanin, derived mainly from spirulina (Arthrospira species), is widely used by food manufacturers as a natural alternative to synthetic blue dyes. The ingredient is permitted for use in several food applications in major markets, such as the U.S., where spirulina extract is approved by the U.S. Food and Drug Administration (FDA) as a color additive exempt from certification for use in products such as confectionery, chewing gum, ice cream, frozen desserts, yogurts, beverages, and other processed foods.
Increasing regulatory scrutiny of artificial food colorants and growing consumer demand for clean-label ingredients are driving food manufacturers to replace synthetic dyes with natural alternatives. As a result, phycocyanin is increasingly incorporated into confectionery products, dairy products, beverages, frozen desserts, bakery items, breakfast cereals, and functional food products. The continued shift toward natural food ingredients and plant-based formulations is expected to drive strong demand for food-grade phycocyanin during the forecast period.
The cosmetics and personal care segment is projected to grow at the fastest CAGR during the forecast period. The growth of this segment is driven by rising demand for natural and plant-derived ingredients in beauty and personal care products. Phycocyanin possesses antioxidant and anti-inflammatory properties, which make it suitable for use in skincare and cosmetic formulations such as creams, serums, masks, and color cosmetics.
Geographical Analysis: Europe Leads; Asia-Pacific Fastest Growing
Based on geography, Europe is expected to account for the largest share of the global phycocyanin market in 2026. This is primarily driven by strong regulatory and consumer momentum supporting natural food ingredients. The European Union’s Regulation (EC) No. 1333/2008 on food additives and ongoing safety reassessments conducted by the European Food Safety Authority (EFSA) have increased scrutiny of synthetic food colorants, encouraging food manufacturers to adopt natural alternatives. At the same time, Europe has one of the most developed markets for natural food colorants and functional food ingredients. According to FoodDrinkEurope, the European food and beverage industry generates over EUR 1.1 trillion in annual turnover, creating substantial demand for natural ingredient solutions such as phycocyanin.
The region also benefits from strong microalgae research and commercialization ecosystems, particularly in France, Germany, the Netherlands, Denmark, and Sweden, where public research institutions and biotechnology companies actively develop microalgae-derived ingredients for food, nutraceutical, and cosmetic applications. In addition, Europe hosts several leading natural color and microalgae ingredient producers, such as GNT Group B.V., AlgoSource, and SPIFORM, which contribute to the growth of this market. France, Germany, the U.K., Italy, the Netherlands, Denmark, and Sweden are the key European markets for phycocyanin.
North America is the second-largest regional market, driven by strong demand for natural food ingredients and a well-established nutraceutical and dietary supplement industry. The U.S. dominates regional consumption due to high consumer awareness of clean-label products and widespread use of natural ingredients in functional foods and beverages. Regulatory support also contributes to market growth; spirulina extract (a primary source of phycocyanin) is approved by the U.S. Food and Drug Administration (FDA) as a color additive exempt from certification under 21 CFR §73.530 for use in several food categories including confectionery, chewing gum, frozen desserts, and beverages. The U.S. also hosts several ingredient suppliers supporting the regional supply chain.
The Asia-Pacific phycocyanin market is expected to grow at the fastest CAGR during the forecast period, driven by growing microalgae cultivation capacity and increasing demand for natural food ingredients across emerging economies. China plays an important role in the global supply chain, as the country hosts numerous large-scale spirulina cultivation and processing facilities. According to the Food and Agriculture Organization (FAO) and microalgae industry analyses, China accounts for a significant share of global spirulina biomass production, supporting downstream phycocyanin extraction activities. In addition, the rapid growth of the food and beverage, nutraceutical, and cosmetics industries in China, India, Indonesia, and Thailand is increasing demand for natural pigments and functional ingredients. China, India, Japan, Australia, and Thailand are the key markets in the Asia-Pacific region.
Latin America and the Middle East & Africa phycocyanin markets are smaller but steadily growing markets. Growth in these regions is primarily driven by the increasing adoption of natural ingredients in food and beverage formulations and the gradual expansion of nutraceutical industries. Brazil and Mexico are the leading markets in Latin America, while Egypt, Saudi Arabia, South Africa, and the UAE are emerging markets in the Middle East & Africa.
The global phycocyanin market is characterized by the presence of a relatively concentrated group of spirulina cultivators and phycocyanin extraction specialists that supply ingredients for food, nutraceutical, cosmetic, and research applications. Key manufacturers operating in this market include AlgoSource S.A., Bluetec Naturals Co., Ltd., DIC Corporation, E.I.D. – Parry (India) Limited, Fuqing King Dnarmsa Spirulina Co., Ltd., GNT Group B.V., Hangzhou OuQi Food Co., Ltd., Inner Mongolia Rejuve Biotech Co., Ltd., Japan Algae Co., Ltd., Jiangshan Comp Spirulina Co., Ltd., Pond Technologies Inc., Qingdao Haizhijiao Biotechnology Co., Ltd., Qingdao ZolanBio Co., Ltd., SPIFORM, Tianjin Norland Biotech Co., Ltd., Wellisen Nutraceuticals, Xi’an Fengzu Biological Technology Co., Ltd. (FZBIOTECH), Yunnan Green A Biological Project Co., Ltd., and Zhejiang Binmei Biotechnology Co., Ltd. These companies are actively engaged in spirulina cultivation, phycocyanin extraction, and ingredient processing and collectively represent a significant portion of the global supply of natural phycocyanin used across food & beverage, nutraceutical, cosmetic, and research applications.
Phycocyanin Market Assessment—by Form
Phycocyanin Market Assessment—by Grade
Phycocyanin Market Assessment—by Category
Phycocyanin Market Assessment—by Application
Phycocyanin Market Assessment—by Geography
Phycocyanin is a natural blue pigment-protein complex primarily extracted from spirulina (Arthrospira species). It is widely used as a natural colorant and functional ingredient in food & beverages, nutraceuticals, cosmetics, and research applications due to its antioxidant and anti-inflammatory properties.
The global phycocyanin market was valued at USD 76.2 million in 2025 and is estimated at USD 95.3 million in 2026. The market is projected to reach USD 527.9 million by 2036, growing at a CAGR of 18.7% during the forecast period (2026–2036).
In terms of volume, the market is projected to grow from 1,098 tons in 2026 to 6,842 tons by 2036, at a CAGR of 20.1% during the forecast period.
The phycocyanin powder segment is expected to account for the largest share of the market in 2026 due to its longer shelf life, greater stability, and wide usage in food, nutraceutical, and cosmetic formulations.
The food & beverages segment is expected to account for the largest share of the market due to the increasing use of phycocyanin as a natural alternative to synthetic food colorants.
The cosmetics and personal care segment is expected to register the highest CAGR during the forecast period, driven by rising demand for natural and plant-derived cosmetic ingredients.
Europe is expected to account for the largest share of the global phycocyanin market in 2026 due to strong demand for natural food colorants and the presence of major natural color manufacturers.
The Asia-Pacific region is expected to record the highest CAGR during the forecast period due to the expansion of spirulina cultivation and increasing demand for natural ingredients in food, nutraceutical, and cosmetic products.
Key growth drivers include increasing demand for natural food colorants, growing adoption of phycocyanin in nutraceutical and dietary supplement applications, rising consumer preference for clean-label products, and expanding microalgae cultivation.
Key companies operating in the phycocyanin market include AlgoSource S.A., Bluetec Naturals Co., Ltd., DIC Corporation, E.I.D. – Parry (India) Limited, Fuqing King Dnarmsa Spirulina Co., Ltd., GNT Group B.V., Hangzhou OuQi Food Co., Ltd., Inner Mongolia Rejuve Biotech Co., Ltd., Japan Algae Co., Ltd., Jiangshan Comp Spirulina Co., Ltd., Pond Technologies Inc., Qingdao Haizhijiao Biotechnology Co., Ltd., Qingdao ZolanBio Co., Ltd., SPIFORM, Tianjin Norland Biotech Co., Ltd., Wellisen Nutraceuticals, Xi’an Fengzu Biological Technology Co., Ltd., Yunnan Green A Biological Project Co., Ltd., and Zhejiang Binmei Biotechnology Co., Ltd.


Published Date: Apr-2023
Published Date: Feb-2025
Published Date: Mar-2026
Published Date: Apr-2023
Published Date: Jan-2025
Please enter your corporate email id here to view sample report.
Subscribe to get the latest industry updates