Resources
About Us
Connected Logistics Market by Offering, Transportation Mode (Roadways, Railways), Application (Inventory Tracking, Real-Time Fleet Management, others), End-use Industry (Automotive, Healthcare & Pharmaceuticals, Others), and Geography - Global Forecast to 2029
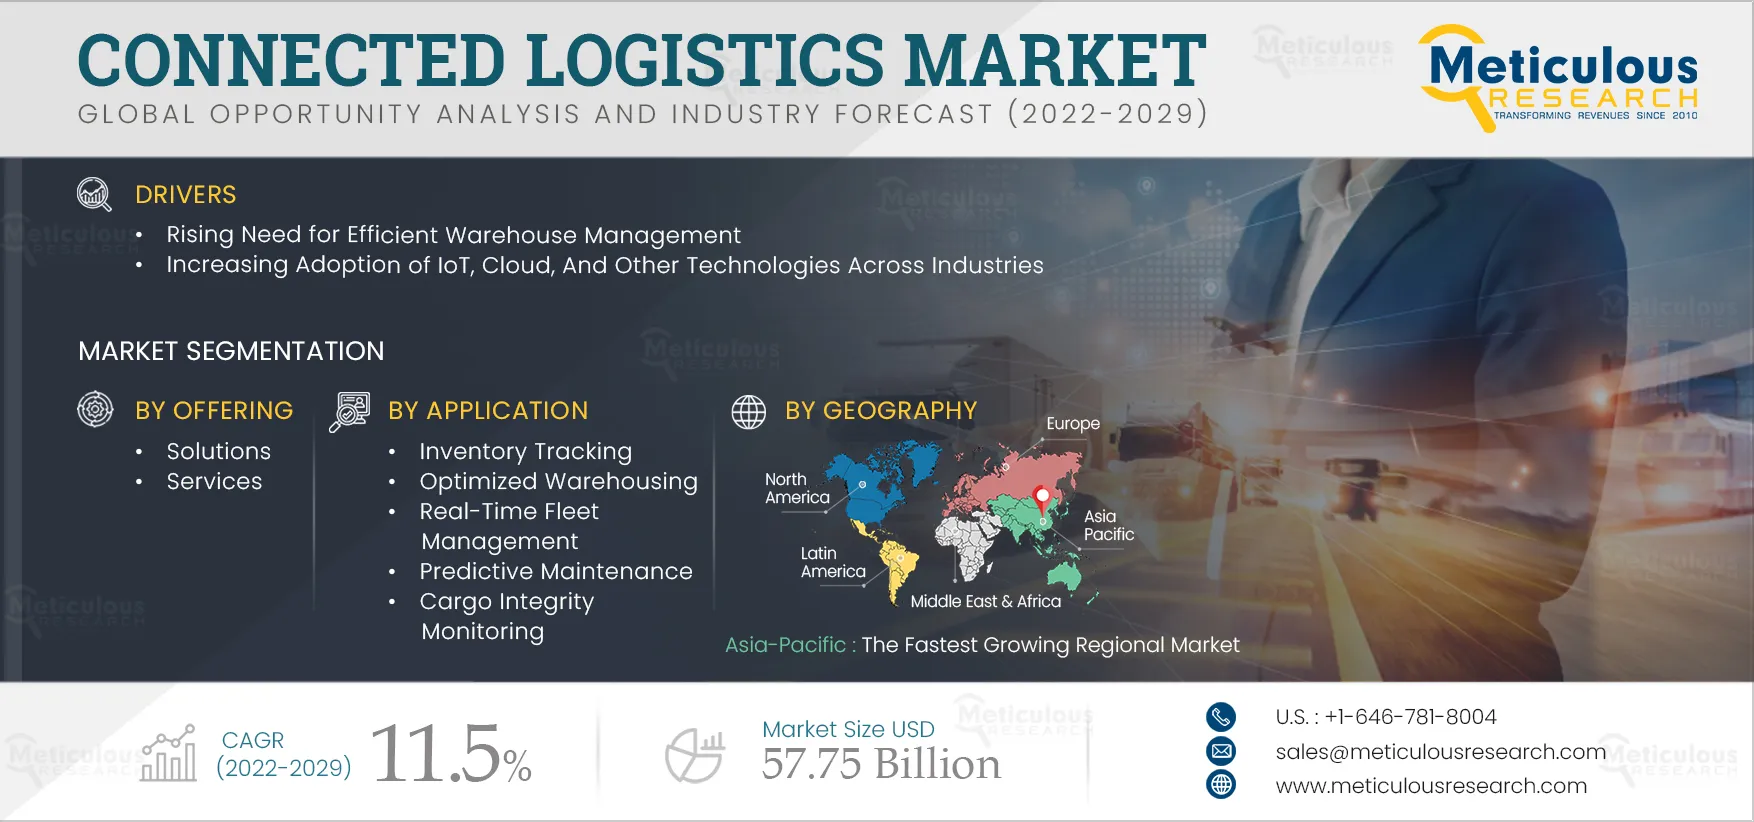
Report ID: MRICT - 104679 Pages: 257 Nov-2022 Formats*: PDF Category: Information and Communications Technology Delivery: 2 to 4 Hours Download Free Sample ReportThe Connected Logistics Market is expected to reach $57.75 billion by 2029, at a CAGR of 11.5% during the forecast period of 2022–2029. The growth of this market is driven by the rising need for efficient warehouse management and the increasing adoption of IoT, cloud, and other technologies across industries. However, the lack of standardization restrains the growth of this market. The incorporation of blockchain technology in freight management and the growing scope of leveraging connected logistics in developing regions are expected to create market growth opportunities. However, security issues in data management remain a challenge for market growth.
The COVID-19 pandemic impacted the worldwide economy. Governments worldwide imposed countrywide lockdowns to control the spread of the infection. The lockdown restrictions impacted manufacturing operations, with production facilities either completely shutting down or running at reduced capacities to ensure social distancing and employee safety. Most industries came to a standstill due to raw material & workforce shortages, supply chain disruptions, and restrictions on international trade. The pandemic impacted many businesses, including connected logistics.
In order to control the spread of COVID-19, countries worldwide have placed restrictions on domestic transit and/or closed border crossings for road freight transport services. The Maritime industry has largely proved resilient to the Covid 19 outbreak. Despite the crises, a vast majority of ports have succeeded in staying open to cargo operations. However, most of them remain closed for passenger traffic. Despite the disruptions at ports, the shipping industry has largely continued to operate worldwide, facilitating the movement of essential supplies and medicines needed to keep countries dealing with the global public health crisis.
Click here to: Get Free Sample Pages of this Report
Increasing Adoption of IoT, Cloud, and Other Technologies Across Industries is Expected to Drive Market Growth
The successful implementation of connected logistics solutions heavily depends on data communication, cloud, mobility, sensors, and the overall IoT architecture. Rapid advancements in these areas have enabled better connectivity, resulting in the development connected logistics ecosystems.
The need for better integration, improved process efficiency, real-time reporting, greater visibility, and improved communications drives the adoption of advanced technologies in the connected logistics market. Advances in IoT technology are also expected to support the growth of the connected logistics market. The Internet of Things allows linking individuals and devices across networks, helping improve route design, emergency preparedness, and security. For instance, in the U.S., more than 70% of all goods are transported by trucks. Thus, logistics companies need solutions that can help them manage their truck operations. Location & route management IoT solutions can help monitor the location of the trucks in real-time. Routes can also be monitored from remote locations using GPS tracking systems and geofencing techniques, which further helps logistics companies track cargo and ensure timely delivery. Moreover, the real-time notifications provided by these vehicle tracking solutions can alert users about events such as thunderstorms or accidents that may affect shipment status.
Using these technologies, manufacturing, transportation, utilities, and other industries can eliminate delays and other barriers and mitigate risks, streamlining business processes and ensuring customer satisfaction. Thus, the rising need for greater visibility and better inventory management has boosted the adoption of innovative technologies, driving the growth of the global connected logistics market.
In 2022, the Solutions Segment is Expected to Dominate the Connected Logistics Market
Based on offering, the connected logistics market is segmented into solutions and services. In 2022, the solutions segment is expected to account for the largest share of the global connected logistics market. The large share of this segment is mainly attributed to the rising need to remotely track & monitor inventories and the movement of goods in real-time, favorable government initiatives for improving the efficiency & efficacy of logistics, and the increasing adoption of eco-friendly automobile technologies.
However, the services segment is expected to grow at the highest CAGR during the forecasted period. The rise in demand for organizations’ growing need for real-time visibility into operations for diagnosing and troubleshooting problems before they impact the business or customer experience is driving the adoption of connected logistics services.
In 2022, the Railways Segment is Expected to Dominate the Connected Logistics Market
Based on transportation mode, the connected logistics market is broadly segmented into roadways, railways, airways, and maritime. In 2022, the roadways segment is expected to account for the largest share of the global connected logistics market. The growth of this segment is mainly attributed to the rising need for road safety, reduced traffic congestion, better & sustainable roadways, and increasing government initiatives and investments in infrastructure development. Also, the roadways segment is expected to grow at the highest CAGR during the forecast period.
Asia-Pacific to be the Fastest Growing Regional Market
Based on geography, the market is segmented into North America, Europe, Asia-Pacific, Latin America, and the Middle East & Africa. During the forecast period, Asia-Pacific is projected to register the highest CAGR due to the presence of rapidly developing economies, consistent technological advancements in transportation, heavy investments in megacity projects, and the perpetual ongoing process of modernizing local transportation networks for facilitating trade exchanges.
Key Players
The report includes a competitive landscape based on an extensive assessment of the key growth strategies adopted by the leading market participants in the connected logistics market between 2020 and 2022. The key players profiled in the connected logistics market report are International Business Machines Corporation (U.S.), SAP (Germany), Intel Corporation (U.S.), Cisco Systems, Inc. (U.S.), Freightgate Inc. (U.S.), ORBCOMM (U.S.), AT&T Intellectual Property (U.S.), Honeywell International Inc. (U.S.), Bosch Service Solutions GmbH (Germany), HCL Technologies Limited (Noida), Infosys Limited (Bengaluru), Eurotech S.p.A. (Italy), Microsoft (U.S.), Siemens (Germany), Oracle (U.S.), Zebra Technologies Corp. (U.S.), Cloud Logistics (U.S.), NEC Corporation (Japan), Accenture (Ireland), and Sigfox (France).
Scope of the report:
Connected Logistics Market, by Offering
Connected Logistics Market, by Transportation Mode
Connected Logistics Market, by Application
Connected Logistics Market, by End-use Industries
Connected Logistics Market, by Geography
Key questions answered in the report:
The global connected logistics market is projected to reach $57.75 billion by 2029 at a CAGR of 11.5% during the forecast period.
The growth of this market is attributed to the factors such as rising demand for efficient warehouse management; increasing adoption of IoT, cloud, and other technologies across various industries; rise in e-commerce, and the need to lower shipment costs.
The key players operating in the connected logistics market are International Business Machines Corporation (U.S.), SAP (Germany), Intel Corporation (U.S.), Cisco Systems, Inc. (U.S.), Freightgate Inc. (U.S.), ORBCOMM (U.S.), AT&T Intellectual Property (U.S.), Honeywell International Inc. (U.S.), Bosch Service Solutions GmbH (Germany), HCL Technologies Limited (Noida), Infosys Limited (Bengaluru), Eurotech S.p.A. (Italy), Microsoft (U.S.), Siemens (Germany), Oracle (U.S.), Zebra Technologies Corp. (U.S.), Cloud Logistics (U.S.), NEC Corporation (Japan), Accenture (Ireland), and Sigfox (France).


Published Date: Mar-2024
Published Date: Jan-2025
Published Date: Jul-2022
Please enter your corporate email id here to view sample report.
Subscribe to get the latest industry updates