Resources
About Us
Natural Sausage Casings Market by Source (Hog, Beef, Sheep), by Application (Fresh Sausages, Pre-cooked Sausages, Smoked Sausages, Cured Sausages), by Distribution Channel (Offline, Online) – Global Forecast to 2036
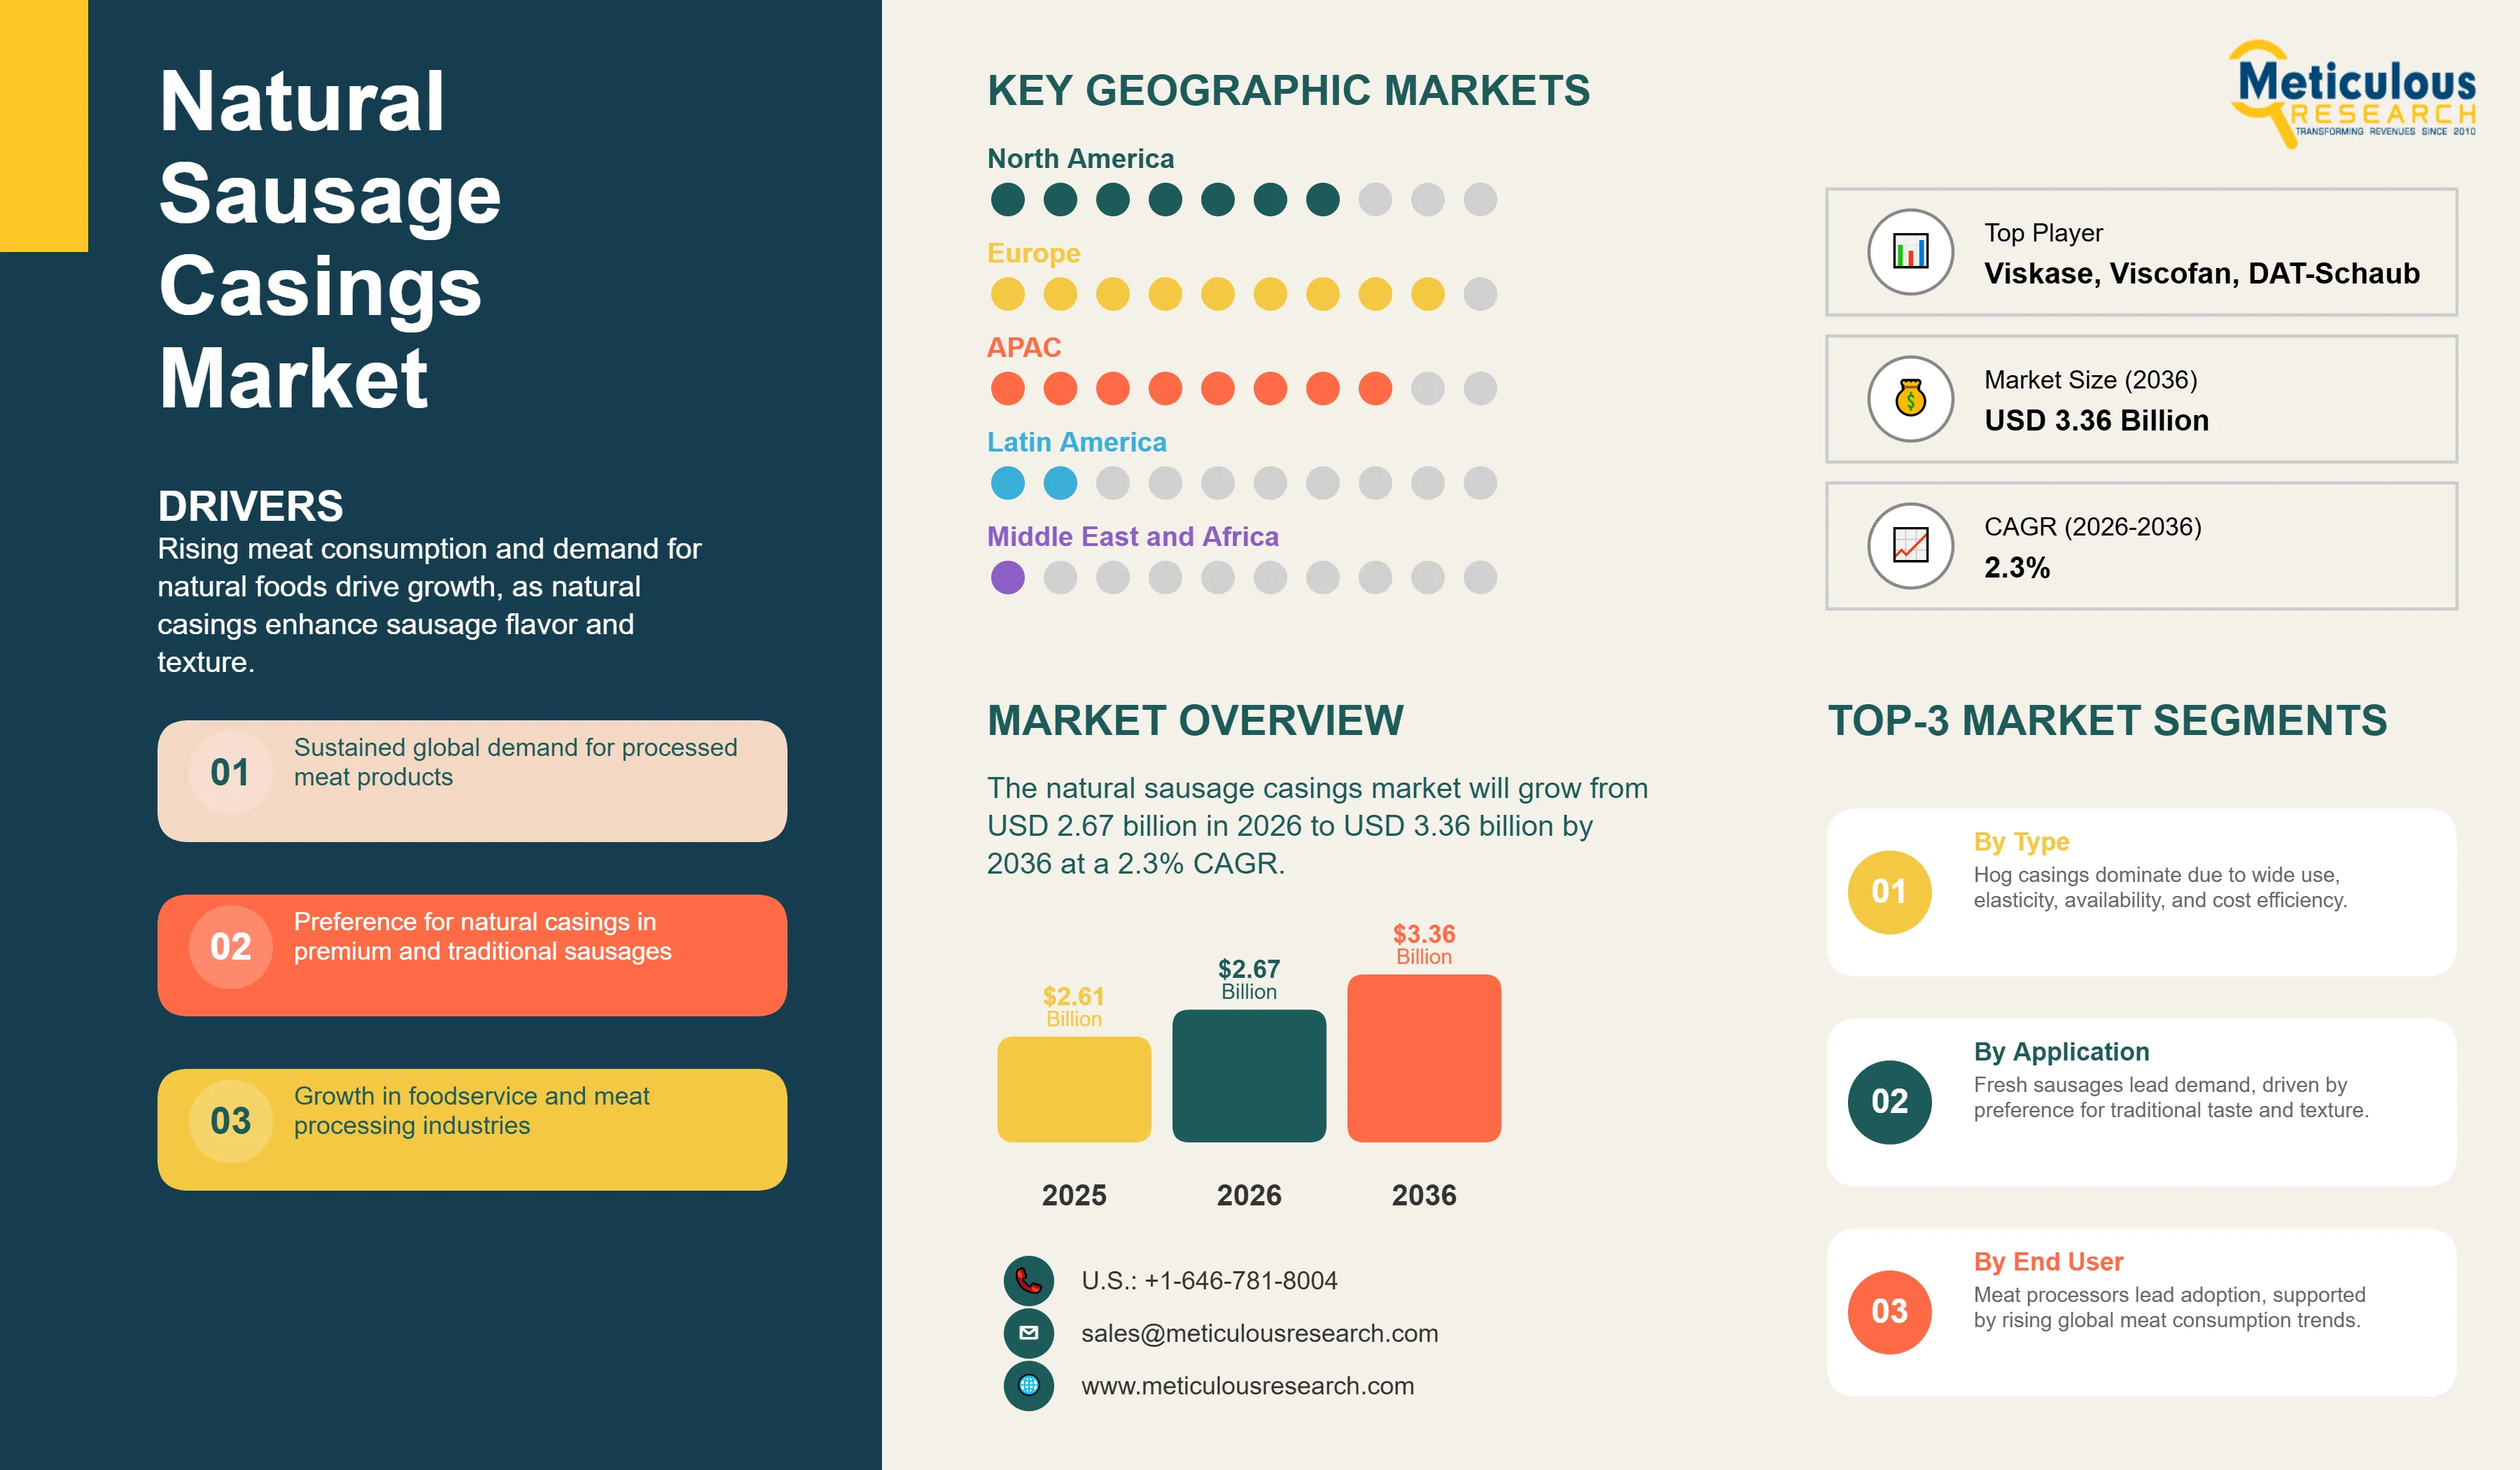
Report ID: MRFB - 104462 Pages: 172 Feb-2026 Formats*: PDF Category: Food and Beverages Delivery: 24 to 48 Hours Download Free Sample ReportThe global natural sausage casings market was valued at USD 2.61 billion in 2025. This market is expected to reach USD 3.36 billion by 2036 from USD 2.67 billion in 2026, growing at a CAGR of 2.3% from 2026 to 2036. The market growth is primarily driven by the rising global consumption of meat, growing consumer preference for natural and traditional food products, and the expansion of the processed meat industry. The unique texture and flavor that natural casings impart to sausages are highly valued by consumers, contributing to their continued demand.
 Click here to: Get Free Sample Pages of this Report
The global natural sausage casings market comprises casings derived from the submucosa of the small and large intestines of animals, primarily hogs, cattle, and sheep. These casings are highly valued for their natural permeability to smoke and moisture, which allows for the development of rich flavors and a desirable texture in sausages. The market is characterized by a strong preference for natural casings in traditional and artisanal sausage production, particularly in Europe and North America.
The demand for natural casings is closely linked to the global meat consumption trends. According to the USDA, the per capita availability of red meat and poultry in the U.S. is projected to be around 226 pounds in 2025, indicating a sustained demand for meat products. This, in turn, drives the demand for sausage casings. The market is also influenced by cultural preferences and culinary traditions, with many regional sausage varieties relying on specific types of natural casings to achieve their characteristic qualities.
Leading players in the market, such as DAT-Schaub Group and Viscofan, S.A., are focusing on expanding their global presence and investing in research and development to improve the quality and consistency of their products. The industry is also witnessing a growing trend towards sustainable and ethical sourcing of raw materials, with consumers becoming increasingly conscious of the environmental and animal welfare aspects of food production.
What are the Key Trends in the Natural Sausage Casings Market?
Growing Demand for Premium and Artisanal Sausages
There is a growing consumer trend towards premium and artisanal food products, including sausages. Consumers are increasingly seeking out high-quality, locally sourced, and uniquely flavored sausages, which often rely on natural casings to achieve their desired characteristics. This trend is driving the demand for specialty casings, such as sheep casings for fine sausages and beef rounds for traditional dry sausages.
Expansion of E-commerce and Online Distribution Channels
The rise of e-commerce and online food retail is creating new opportunities for the natural sausage casings market. Online platforms allow smaller producers and artisanal sausage makers to reach a wider customer base, driving the demand for smaller quantities of high-quality casings. This trend is also enabling consumers to purchase a wider variety of sausages and casings directly, further stimulating market growth.
|
Parameters |
Details |
|
Market Size by 2036 |
USD 3.36 Billion |
|
Market Size in 2026 |
USD 2.67 Billion |
|
Market Size in 2025 |
USD 2.61 Billion |
|
Revenue Growth Rate (2026-2036) |
CAGR of 2.3% |
|
Dominating Source |
Hog Casings |
|
Fastest Growing Source |
Sheep Casings |
|
Largest Application Segment |
Fresh Sausages |
|
Dominating Region |
Europe |
|
Fastest Growing Region |
Asia-Pacific |
|
Base Year |
2025 |
|
Forecast Period |
2026 to 2036 |
Drivers: Rising Global Meat Consumption and Urbanization
The increasing global population and rising disposable incomes, particularly in developing countries, are driving the demand for meat and meat products. Urbanization is also contributing to this trend, as urban consumers tend to have a higher consumption of processed and convenience foods, including sausages. According to the Food and Agriculture Organization (FAO), global meat production is projected to increase by 12% by 2028, which will directly impact the demand for sausage casings.
Opportunity: Growing Demand in Emerging Economies
Emerging economies in Asia-Pacific, Latin America, and the Middle East & Africa present significant growth opportunities for the natural sausage casings market. As these regions experience economic growth and dietary shifts, the demand for processed meat products is expected to increase. This provides an opportunity for market players to expand their presence and cater to the growing demand for natural and high-quality food products.
Why Do Hog Casings Dominate the Market?
Based on source, the hog casings segment is expected to account for the largest share of the market, in 2026. Hog casings are widely used in the production of a variety of sausages, including fresh, cooked, and smoked sausages. Their excellent elasticity, tensile strength, and permeability make them ideal for a wide range of applications. The high availability of hogs for slaughter and the relatively lower cost of hog casings compared to other natural casings also contribute to their market dominance.
How Does the Fresh Sausages Segment Lead the Market?
The fresh sausages segment is expected to account for the largest share of the market by application, in 2026. Fresh sausages are a popular food item in many parts of the world and are often made with natural casings to achieve a traditional and authentic taste and texture. The growing demand for fresh and minimally processed food products is driving the growth of this segment.
How is Europe Maintaining Its Leadership?
Europe is projected to account for the largest share of the global natural sausage casings market during the forecast period. This is mainly due to its long-standing cultural and culinary traditions of sausage production and consumption, which sustain consistent demand for natural casings used in premium and traditional sausage varieties. High per capita consumption of processed meat products, particularly in countries such as Germany, Italy, and Spain, supports stable demand from industrial and artisanal meat processors.
Europe also benefits from a well-developed meat processing industry, advanced slaughtering and by-product utilization systems, and stringent quality and food safety standards that favor the use of natural casings in high-quality and specialty products. Strong consumer preferences for traditional textures, taste profiles, and clean-label positioning further reinforce the dependence of this region on natural casings compared to synthetic alternatives, further driving the growth of this market.
Which Regions Are Experiencing Rapid Growth?
Asia-Pacific is expected to register the fastest growth in the global natural sausage casings market over the forecast period. This growth is supported by rising disposable incomes, urbanization, and evolving dietary patterns that increasingly incorporate protein-rich and convenience-oriented foods. The growing influence of Western-style processed meat products, including sausages, is contributing to higher demand for casing materials.
Key countries such as China, Australia, and New Zealand are witnessing rising meat consumption and expanding food processing sectors. In addition, the development of modern retail channels, foodservice expansion, and increasing local sausage manufacturing capacity are further supporting demand for natural sausage casings across the region.
The global natural sausage casings market is characterized by the presence of established casing processors and integrated meat industry suppliers. Key companies profiled in this report include DAT-Schaub Group (a subsidiary of Danish Crown A/S), Viscofan, S.A., Viskase Companies, Inc., Shenguan Holdings (Group) Limited, and World Casing Corporation, among others. These players compete on the basis of sourcing networks, processing expertise, product quality, and the ability to supply consistent and traceable natural casing materials to global meat processors.
The global natural sausage casings market is expected to grow from USD 2.67 billion in 2026 to USD 3.36 billion by 2036.
The global natural sausage casings market is expected to grow at a CAGR of 2.3% from 2026 to 2036.
The key players operating in the global natural sausage casings market include DAT-Schaub Group (a subsidiary of Danish Crown A/S), Viscofan, S.A., Viskase Companies, Inc., Shenguan Holdings (Group) Limited, and World Casing Corporation.
The main factors include the rising global consumption of meat, growing consumer preference for natural and traditional food products, and the expansion of the processed meat industry.
Europe will lead the global natural sausage casings market during the forecast period 2026 to 2036, while Asia-Pacific is expected to witness the fastest growth.


Published Date: Nov-2025
Published Date: May-2025
Published Date: Jul-2024
Published Date: May-2024
Published Date: Aug-2023
Please enter your corporate email id here to view sample report.
Subscribe to get the latest industry updates