Resources
About Us
Agricultural Biologicals Market Size, Share, Forecast, & Trends Analysis by Product Type (Biopesticides, Biostimulants, Biofertilizers), Source (Microbial, Biochemical, Semiochemicals), Formulation (Liquid, Dry), Mode of Application, Farming Type, and Crop Type — Global Forecast to 2036
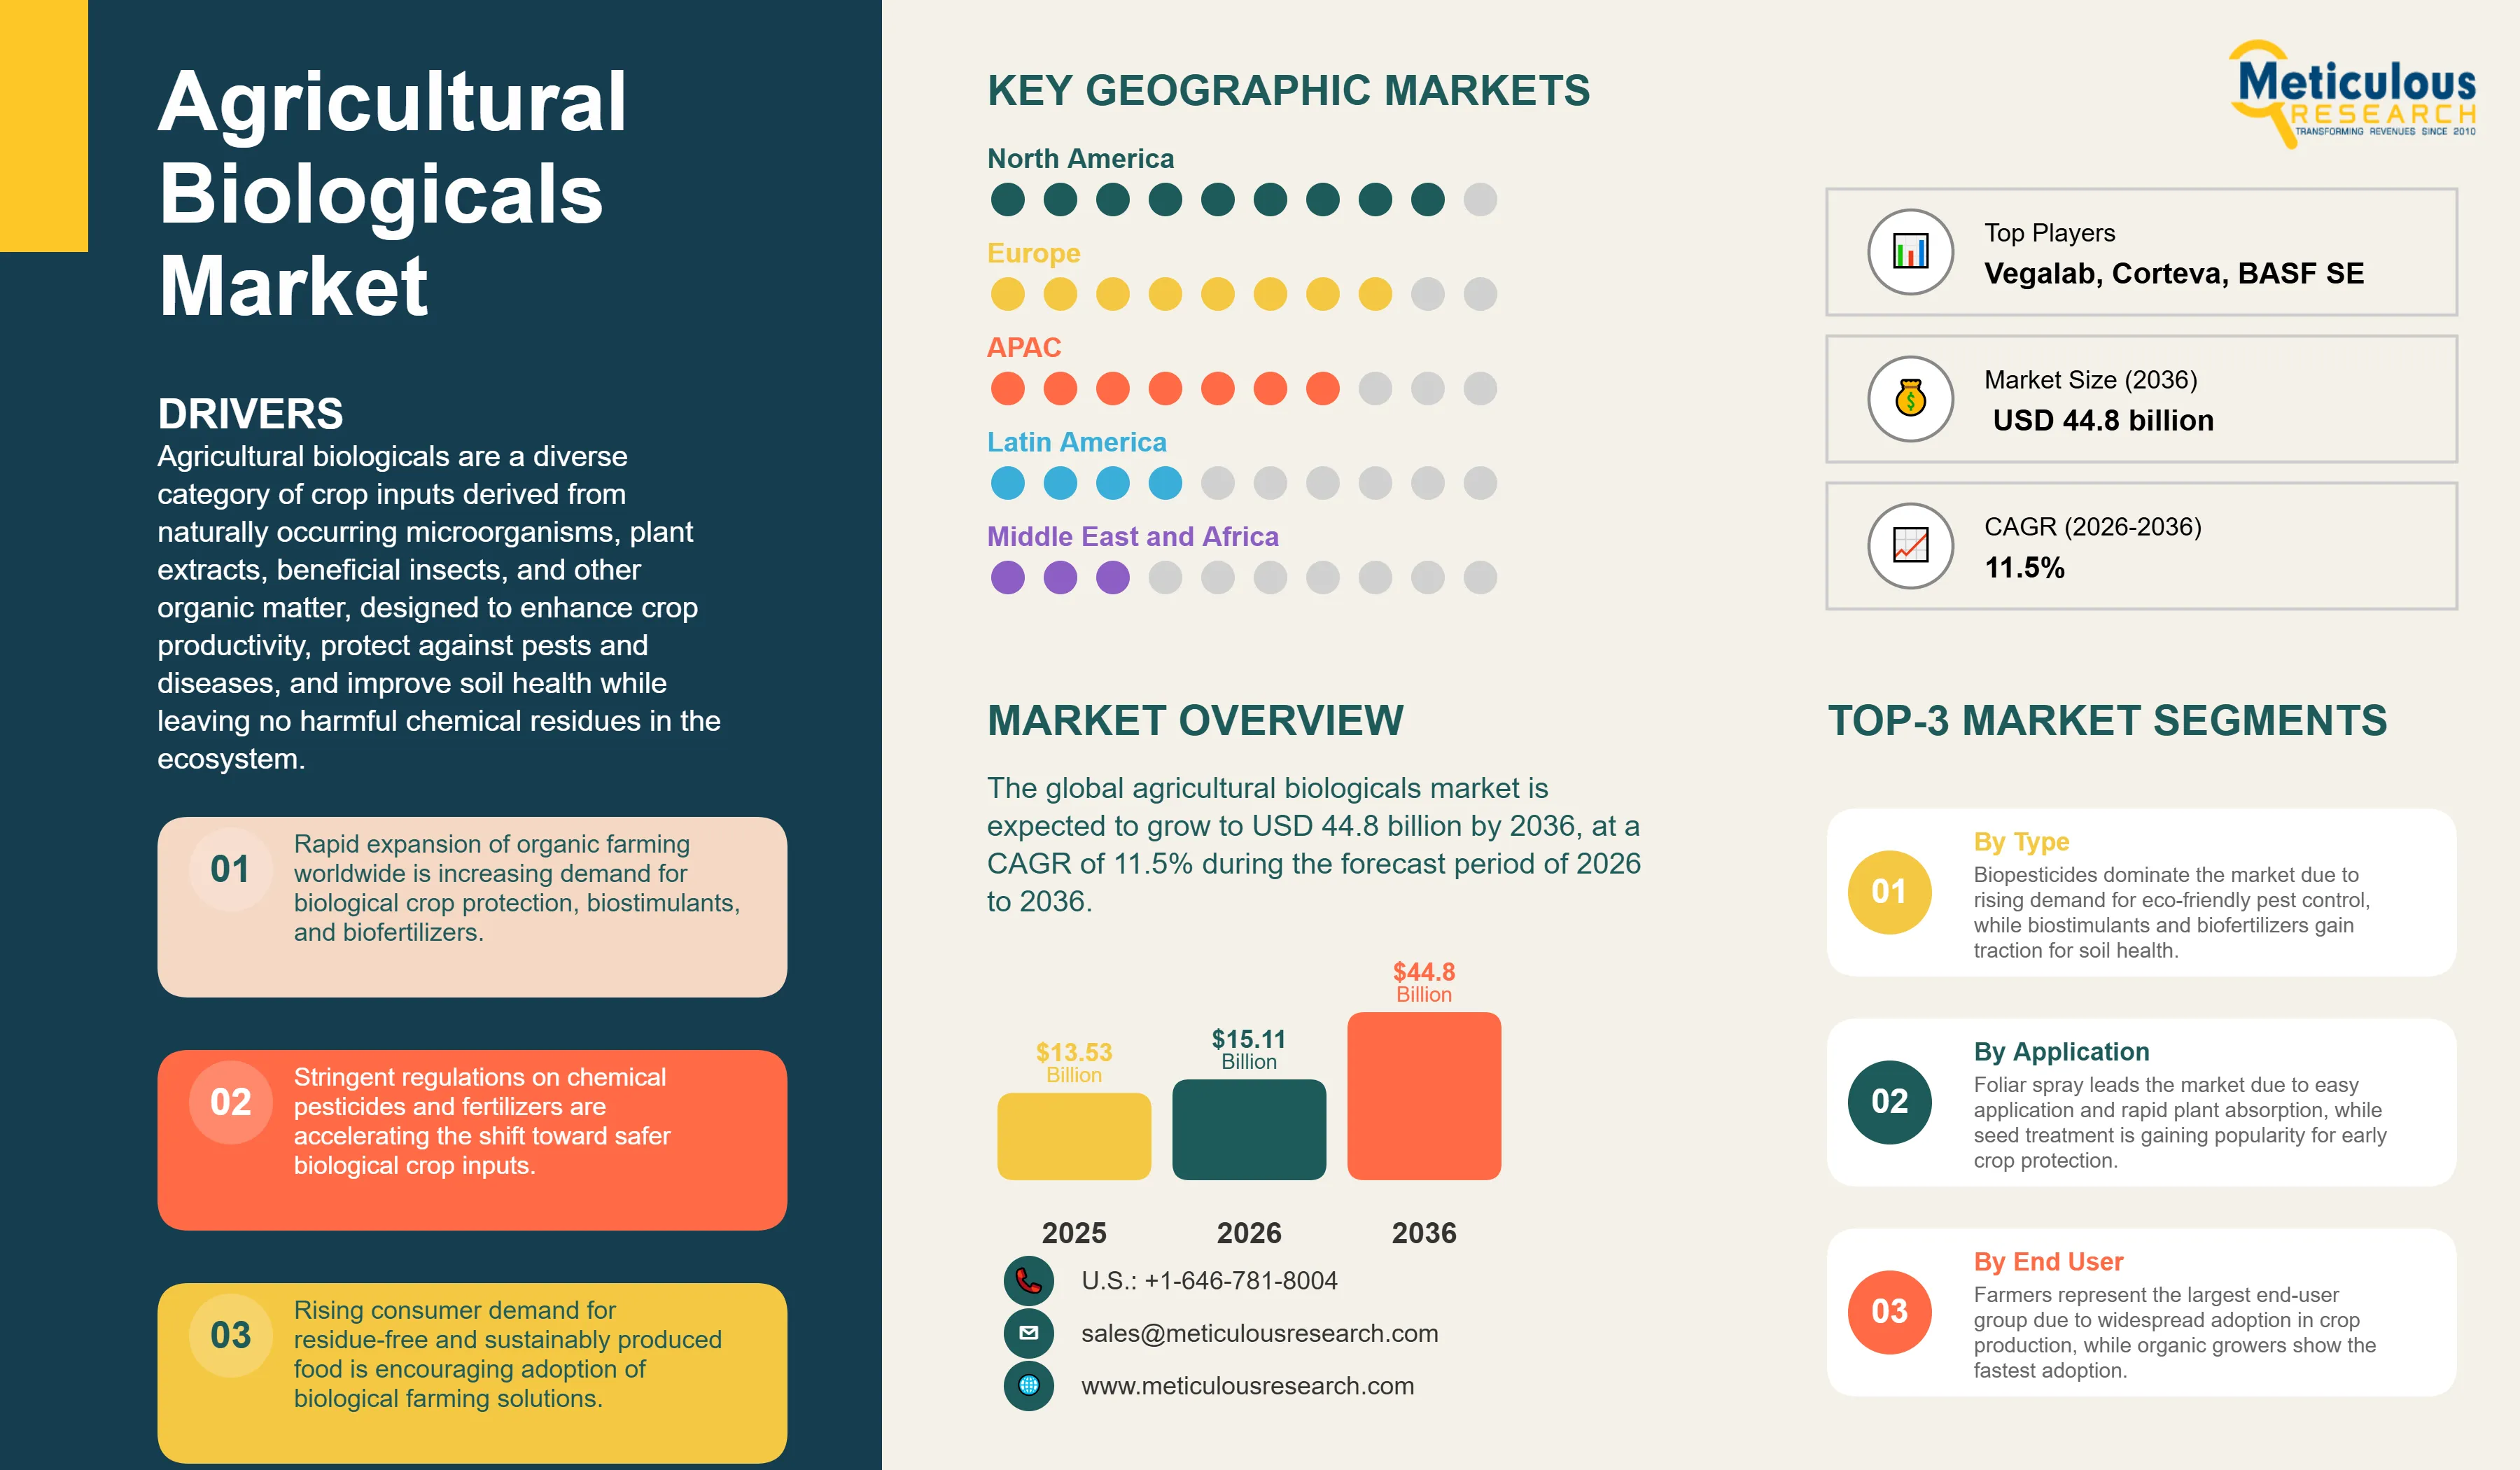
Report ID: MRAGR - 104628 Pages: 275 Mar-2026 Formats*: PDF Category: Agriculture Delivery: 24 to 48 Hours Download Free Sample ReportThe global agricultural biologicals market was valued at USD 13.53 billion in 2025 and is projected to reach USD 15.11 billion in 2026. The market is expected to grow to USD 44.8 billion by 2036, at a CAGR of 11.5% during the forecast period of 2026 to 2036.
Agricultural biologicals are a diverse category of crop inputs derived from naturally occurring microorganisms, plant extracts, beneficial insects, and other organic matter, designed to enhance crop productivity, protect against pests and diseases, and improve soil health while leaving no harmful chemical residues in the ecosystem. The category includes three principal product segments, namely biopesticides, biostimulants, and biofertilizers. Agricultural biologicals are widely recognized as critical enablers of sustainable agriculture, organic farming, and integrated pest management (IPM) systems, positioning them as essential tools in the global transition away from dependence on synthetic agrochemicals.
The agricultural biologicals market is primarily driven by the rapid expansion of organic farming worldwide. Organic agriculture is now practiced in more than 183 countries, with over 99 million hectares of agricultural land managed organically by at least 4.5 million farmers globally, thereby significantly increasing the demand for biologically derived crop protection and plant nutrition solutions.
In addition, the stringent regulations on synthetic pesticides and chemical fertilizers across major agricultural markets is driving the adoption of biological crop inputs. Growing consumer demand for residue-free and sustainably produced food products is further encouraging growers to adopt integrated pest management (IPM) practices and biological crop protection solutions. At the same time, climate change–induced crop stress, including drought, soil degradation, and nutrient imbalance, is driving the adoption of biostimulants and microbial-based plant health solutions that enhance crop resilience and improve nutrient-use efficiency.
The market is also witnessing increasing innovation and investment activity. Over 1,300 patents related to agricultural biologicals have been filed globally over the past five years, with around three-quarters focused on the development of novel biological crop solutions, showcasing the strong innovation momentum in this sector. In addition, a growing number of strategic collaborations, licensing agreements, and product development partnerships between large crop protection companies and specialized biologicals developers is further driving technological advancement and commercialization in the market.
Click here to: Get Free Sample Pages of this Report
The agricultural biologicals market includes all biological crop inputs derived from naturally occurring microorganisms, plant extracts, beneficial insects, and other organic matter that are used in crop production to improve yield, protect against pests and diseases, enhance soil health, and stimulate plant growth. The market is segmented by product type, source, formulation, mode of application, farming type, crop type, and geography. Market sizing includes both volume (metric tons) and value (USD) where applicable, with value data provided across all segments and volume data provided for product type and geography segments.
|
Market Size by 2036 |
USD 44.8 Billion |
|
Market Size in 2025 (Base Year) |
USD 13.53 Billion |
|
Market Size in 2026 |
USD 15.11 Billion |
|
Market Growth Rate (2026–2036) |
CAGR of 11.5% |
|
Dominating Region (2026) |
North America |
|
Fastest Growing Region |
Latin America |
|
Base Year |
2025 |
|
Forecast Period |
2026 to 2036 |
|
Segments Covered |
By Product Type: Biopesticides (Bioinsecticides, Biofungicides, Bionematicides, Bioherbicides, Other Biopesticides), Biostimulants, Biofertilizers By Source: Microbial (Bacteria, Fungi, Viruses, Other Microorganisms), Biochemical, Semiochemicals, Other Sources By Formulation: Liquid, Dry By Mode of Application: Foliar Spray, Seed Treatment, Soil Treatment, Post-harvest, Other Modes By Farming Type: Conventional Farming, Organic Farming By Crop Type: Fruits & Vegetables, Cereals & Grains (Corn, Wheat, Rice, Other Cereals & Grains), Oilseeds & Pulses, Other Crop Types By Geography: North America, Europe, Asia-Pacific, Latin America, Middle East & Africa |
|
Countries Covered |
North America (U.S., Canada); Europe (Germany, France, Italy, Spain, U.K., Netherlands, Rest of Europe); Asia-Pacific (China, India, Japan, Australia, South Korea, Indonesia, Philippines, Rest of Asia-Pacific); Latin America (Brazil, Mexico, Argentina, Chile, Rest of Latin America); Middle East & Africa |
|
Key Companies |
Bayer AG (Germany), BASF SE (Germany), Syngenta AG (Switzerland), Corteva, Inc. (U.S.), FMC Corporation (U.S.), UPL Limited (India), Novonesis Group (Denmark), Koppert B.V. (Netherlands), Valent BioSciences LLC (U.S.), Lallemand Inc. (Canada), Andermatt Group AG (Switzerland), Bioceres Crop Solutions Corp. (Argentina), Certis Biologicals LLC (U.S.), Gowan Company LLC (U.S.), Rovensa Next (Spain), IPL Biologicals Limited (India), Seipasa S.A. (Spain), W. Neudorff GmbH KG (Germany), Rizobacter S.A. (Argentina), Vegalab SA (Switzerland), and others |
Growth in Organic Farming and Rising Demand for Organic Food
The rapid expansion of organic farming worldwide is one of the key drivers of the agricultural biologicals market. Organic farming systems rely heavily on biological crop protection products, biofertilizers, and biostimulants for pest management, plant nutrition, and soil health improvement. As a result, the expansion of certified organic farmland directly increases demand for biological agricultural inputs.
According to the latest global organic agriculture statistics published by FiBL and IFOAM – Organics International, organic agriculture is practiced in 183 countries, with around 99 million hectares of agricultural land managed organically worldwide. In parallel, global retail sales of organic food and beverages reached €145 billion in 2024, highlighting strong consumer demand for organically produced food products.
Policy initiatives are also driving the transition toward sustainable farming systems. For example, the European Union’s Farm to Fork Strategy targets a 50% reduction in chemical pesticide use by 2030 and aims to expand organic farmland to 25% of total EU agricultural land, creating long-term demand for biological crop protection and plant nutrition products
Increasing Government Initiatives and Regulatory Frameworks Supporting Biologicals
Government policies and regulatory frameworks are increasingly driving the development and commercialization of agricultural biologicals. Several countries are streamlining regulatory approval processes for biological crop protection products while simultaneously tightening restrictions on synthetic pesticides.
In the U.S., the Environmental Protection Agency (EPA) Office of Pesticide Programs' Biopesticides and Pollution Prevention Division (BPPD) regulates biological pesticides, offering a dedicated pathway that enables faster registration, often under one year, compared to over three years for conventional chemical pesticides.
Emerging agricultural economies are also promoting the use of biological inputs. In India, government programs led by the Ministry of Agriculture and Farmers Welfare and the Department of Biotechnology (DBT) support biofertilizers and biopesticides through research grants, production incentives like Rs. 15,000/ha under PKVY, and laboratory infrastructure. Similarly, national initiatives in China, including the Ministry of Agriculture and Rural Affairs (MARA) approvals for new biopesticides and "zero growth" policies on chemical pesticides achieved ahead of 2020 targets, encourage the adoption of biological inputs in large-scale production.In Brazil, regulatory initiatives by the Ministry of Agriculture and Livestock (MAPA), including the Bioinputs Law and 162 biological registrations in 2025 (14.5 months average approval), have accelerated approvals for biological crop protection products in one of the world’s largest agricultural economies.
Expansion of Microbial-Based Crop Inputs
Microbial technologies are becoming a central focus of innovation in the agricultural biologicals market. Microbial pesticides, biofertilizers, and plant-beneficial microorganisms are increasingly used to improve crop protection, nutrient uptake, and soil health. Regulatory authorities are approving a growing number of biological active ingredients each year. For example, the U.S. Environmental Protection Agency (EPA) continues to expand approvals of microbial and biochemical pesticides through its Biopesticides and Pollution Prevention Division, reflecting the increasing commercialization of biological crop protection technologies. Biological pesticides are the rapidly growing segment of registered crop protection products in the U.S.
Advances in microbial strain discovery, genomics, and fermentation technologies are also enabling companies to develop more effective and scalable biological solutions. These technologies are improving product consistency, shelf stability, and field performance, thereby driving the adoption of microbial-based agricultural inputs globally.
Increasing Integration of Biologicals into Integrated Pest Management (IPM) Programs
Agricultural biologicals are increasingly being incorporated into integrated pest management (IPM) strategies, where biological inputs are used alongside synthetic crop protection products to improve pest resistance management and reduce chemical residues. IPM programs are widely promoted by international organizations such as the Food and Agriculture Organization (FAO) as a key component of sustainable crop protection, emphasizing biological controls like predators, parasites, pathogens, and biopesticides.
The growing adoption of biological inputs within IPM systems is mainly evident in major agricultural regions such as North America, Europe, and Latin America. Farmers are increasingly adopting biological seed treatments, microbial soil amendments, and foliar biostimulants as complementary tools to conventional crop protection products.
Why Does the Biopesticides Segment Dominate the Agricultural Biologicals Market?
Biopesticides is expected to account for the largest share of the global agricultural biologicals market in 2026. The largest share of this segment is primarily attributed to the universal need for crop protection across all agricultural systems, the growing regulatory and market pressure to reduce reliance on synthetic pesticides, and the proven commercial efficacy of established microbial biopesticide products. Bacillus thuringiensis (Bt) formulations remain the highest-volume biopesticide globally, with application across caterpillar and beetle pest management in vegetables, fruits, corn, and cotton. Bioinsecticides (including Bt-based, entomopathogenic fungal, and baculovirus products) dominate within biopesticides, followed by biofungicides (Trichoderma, Bacillus subtilis, and other biocontrol agents), which are growing rapidly in response to the increasing prevalence of fungicide resistance in key foliar pathogens.
Bionematicides are one of the highest-growth sub-segments, primarily driven by the regulatory restrictions of chemical nematicides and the agronomic importance of nematode management in high-value fruit, vegetable, and specialty crop production.
The biostimulants segment is expected to grow at the highest CAGR among the three product types during the forecast period, driven by the growing importance of abiotic stress management (drought, heat, salinity) in the context of climate change, the expansion of organic farming, and the increasing scientific understanding of plant-microbiome interactions. Seaweed-based biostimulants, protein hydrolysate-based products, humic and fulvic acid formulations, and microbial biostimulants (including mycorrhizal fungi and plant growth-promoting rhizobacteria) are all experiencing strong commercial growth.
The EU’s Fertilizing Products Regulation (FPR), which created a harmonized EU-wide regulatory framework for biostimulants upon entering into force in July 2022, has significantly improved market access for innovative biostimulant products across Europe. Yara’s launch of its YaraAmplix biostimulant portfolio in 2024 illustrates the entry of major conventional fertilizer companies into the biostimulant space.
Biofertilizers: Rapid Growth in Emerging Markets
The biofertilizers market is expected to grow significantly in Asia-Pacific and Latin America, where the economics of biological nitrogen fixation and phosphate solubilization are most compelling, given high synthetic fertilizer prices, small farm sizes, and government programs supporting adoption of biofertilizer. Rhizobium-based biofertilizers for legume production is the highest-volume category within biofertilizers globally, with substantial markets in soybean production across Brazil, Argentina, and the U.S. Mycorrhizal biofertilizers market is also gaining traction in specialty crops, organic farming, and land restoration programs. In India, government subsidies and the National Mission for Sustainable Agriculture continue to drive biofertilizer penetration into smallholder farming systems.
Microbials: Largest and Fastest-Growing Source Segment
The microbial source segment is expected to account for the largest share of the global agricultural biologicals market in 2026, and is also projected to grow at the highest CAGR from 2026 to 2036. This is mainly due to their broad applicability across all three product categories (biopesticides, biostimulants, biofertilizers), their superior selectivity and safety profile compared to chemical alternatives, minimal pre-harvest interval and re-entry period requirements, and compatibility with organic certification standards. Key microbial active ingredients include Bacillus thuringiensis, Bacillus subtilis, Bacillus firmus, Trichoderma species, Beauveria bassiana, Metarhizium anisopliae, Rhizobium species, Azotobacter species, Pseudomonas fluorescens, and mycorrhizal fungi. AI-enabled strain discovery and CRISPR-based microbial engineering are continuously expanding the functional and commercial performance of the microbial segment.
Liquid Formulations: Largest Share and Highest CAGR
The liquid formulations segment is expected to account for the largest share of the agricultural biologicals market in 2026, driven by their superior compatibility with modern irrigation technologies (drip and sprinkler systems), more uniform and easy application characteristics, longer effective duration (up to 6 months versus up to 3 months for dry formulations), and better compatibility with foliar spray application equipment. Liquid formulations are well-suited for fermentation-derived microbial products where maintaining cell viability in liquid suspension allows for more flexible handling and application timing. The liquid segment is also expected to grow at the highest CAGR during the forecast period, driven by the ongoing expansion of drip and sprinkler irrigation infrastructure in major agricultural markets and the growing preference among commercial growers for liquid biological inputs that can be tank-mixed with conventional crop protection products.
Foliar Spray: Largest Market Share in 2026
Foliar spray is expected to account for the largest share of the global agricultural biologicals market in 2026, driven by the advantages of foliar spray technique, including uniform biochemical distribution across the plant canopy, efficient use of biopesticide active ingredients, minimal to no wastage of biological materials, and compatibility with standard spray application equipment already owned by most commercial growers. The foliar spray segment is mainly dominant for biofungicide, bioinsecticide, and biostimulant applications in high-value fruit, vegetable, and specialty crop production, where frequent applications through the growing season justify the efficiency and precision of liquid foliar delivery.
Seed Treatment: Fastest-Growing Mode of Application
The seed treatment segment is projected to grow at the highest CAGR among all modes of application during the forecast period, mainly due to the accelerating regulatory phase-out of neonicotinoid seed treatment insecticides across major markets creating replacement demand for biological alternatives; the agronomic advantages of biological seed treatments (rhizosphere colonization for nutrition support, systemic resistance induction, early-season protection, enhanced germination and seedling vigor); the adoption of precision coating and film-forming seed treatment technologies that maximize biological active ingredient adhesion and uniform distribution on seed surfaces; and the growing farmer preference for “one-step” seed treatments that deliver multiple biological benefits simultaneously.
Fruits & Vegetables: Largest Crop Type Segment
The fruits & vegetables crop type segment is expected to account for the largest share of the global agricultural biologicals market in 2026, driven by the high value per hectare of horticultural crops, the stringent MRL requirements for fresh produce in premium export markets, the diversity of pest and disease pressures in horticultural production requiring multiple biological tools, and the growing consumer demand for organic and residue-free fresh produce globally.
Cereals & Grains: High-Growth Segment with Large Volume Opportunity
The cereals & grains segment is emerging as one of the highest-value growth opportunities for agricultural biologicals. The growth of biologicals market for cereals & grains is mainly attributed to the huge global acreage under major cereal crops (corn, wheat, rice, barley, sorghum) and the rapidly improving cost-effectiveness of biological inputs for large-scale commodity production.
North America: Largest Regional Market
North America is expected to account for the largest share of the global agricultural biologicals market in 2026. The U.S. is the dominant national market, driven by the world’s most advanced and well-funded commercial biologicals industry, strong EPA regulatory support for biopesticide registration (including expedited review timelines), high organic food market penetration, extensive use of biological inputs in high-value horticultural and specialty crop production, and a well-developed distribution infrastructure.
Latin America: Fastest-Growing Regional Market for Agricultural Biologicals
Latin America is projected to grow at the highest CAGR during the forecast period, driven by the unique combination of massive agricultural scale with Brazil alone is the world’s largest exporter of soybeans, corn, beef, sugar, and coffee; rapid growth in the adoption of domestic biologicals within commodity crop production systems; supportive regulatory frameworks; and the dynamics of intense competition among global and regional biological companies vying for dominant positions in the world’s most strategically important emerging biologicals market. Brazil is the largest agricultural biologicals market in Latin America and one of the fastest-growing globally. Recent regulatory developments illustrate continued support for innovation, including the May 2024 approval by Brazil’s Ministry of Agriculture and Livestock (MAPA) of three bio-insecticidal and bio-nematicidal products developed by Bioceres Crop Solutions using its Burkholderia-based platform.
The report includes a competitive landscape based on an extensive assessment of product portfolio offerings, geographic presence, and key strategic developments adopted by leading market participants in the global agricultural biologicals market between 2024 and 2026. The key players profiled in the report include Bayer AG (Germany), BASF SE (Germany), Syngenta AG (Switzerland), Corteva, Inc. (U.S.), FMC Corporation (U.S.), UPL Limited (India), Sumitomo Chemical Co., Ltd. (Japan), Novonesis Group (Denmark), Koppert Biological Systems (Netherlands), Valent BioSciences LLC (U.S.), Lallemand Inc. (Canada), Andermatt Group AG (Switzerland), Bioceres Crop Solutions Corp. (Argentina), Certis Biologicals LLC (U.S.), Gowan Company LLC (U.S.), Rovensa Next (Spain), IPL Biologicals Limited (India), Seipasa S.A. (Spain), W. Neudorff GmbH KG (Germany), Rizobacter S.A. (Argentina), Vegalab SA (Switzerland), and Som Phytopharma India Limited (India) among others.
Agricultural Biologicals Market, by Product Type
Agricultural Biologicals Market, by Source
Agricultural Biologicals Market, by Formulation
Agricultural Biologicals Market, by Mode of Application
Agricultural Biologicals Market, by Farming Type
Agricultural Biologicals Market, by Crop Type
Agricultural Biologicals Market, by Geography
Agricultural biologicals are naturally derived crop inputs, including biopesticides, biostimulants, and biofertilizers, used to manage pests and diseases, improve soil health, and enhance crop productivity. This study provides market insights and forecasts by product type and geography (value and volume) and by source, formulation, mode of application, farming type, and crop type (value).
The global agricultural biologicals market is projected to reach USD 44.8 billion by 2036 from USD 15.11 billion in 2026, growing at a CAGR of 11.5% during the forecast period of 2026–2036.
The biopesticides segment is expected to account for the largest share of the agricultural biologicals market in 2026. The biostimulants segment is projected to register the highest growth rate during the forecast period.
The seed treatment segment is expected to register the highest CAGR during the forecast period, driven by increasing adoption of biological seed treatments.
Key growth drivers include the expansion of organic farming, increasing demand for residue-free food, regulatory restrictions on synthetic agrochemicals, and the growing adoption of sustainable agricultural practices.
Major restraints include limited farmer awareness, complex regulatory approval processes, higher product costs compared to conventional agrochemicals, and performance variability under different environmental conditions.
Key players include Bayer AG, BASF SE, Syngenta AG, Corteva, Inc., FMC Corporation, UPL Limited, Sumitomo Chemical Co., Ltd., Novonesis Group, Koppert Biological Systems, Valent BioSciences LLC, Lallemand Inc., Andermatt Group AG, Bioceres Crop Solutions Corp., Certis Biologicals LLC, Gowan Company LLC, Rovensa Next, IPL Biologicals Limited, Seipasa S.A., W. Neudorff GmbH KG, Rizobacter S.A., Vegalab SA, and Som Phytopharma India Limited.
Latin America is expected to register the highest CAGR during the forecast period, followed by Asia-Pacific.


Published Date: Mar-2026
Published Date: Mar-2026
Published Date: Feb-2026
Published Date: Feb-2026
Published Date: Mar-2024
Please enter your corporate email id here to view sample report.
Subscribe to get the latest industry updates