Resources
About Us
Real-World Data Market Size, Share & Trends Analysis by Source (EMR/EHR/Clinical Data, Claims & Billing Data, Pharmacy Data, Genomics Data, Patient-Generated/Wearable Data), Application, End User, and Geography — Global Opportunity Analysis and Industry Forecast (2026–2036)
Report ID: MRHC - 104611 Pages: 170 Apr-2026 Formats*: PDF Category: Healthcare Delivery: 24 to 48 Hours Download Free Sample ReportThe global real-world data market was valued at USD 1,326.6 million in 2026 and is projected to reach USD 2,493.0 million by 2036, growing at a CAGR of 6.5% during the forecast period 2026–2036.
 Click here to: Get Free Sample Pages of this Report
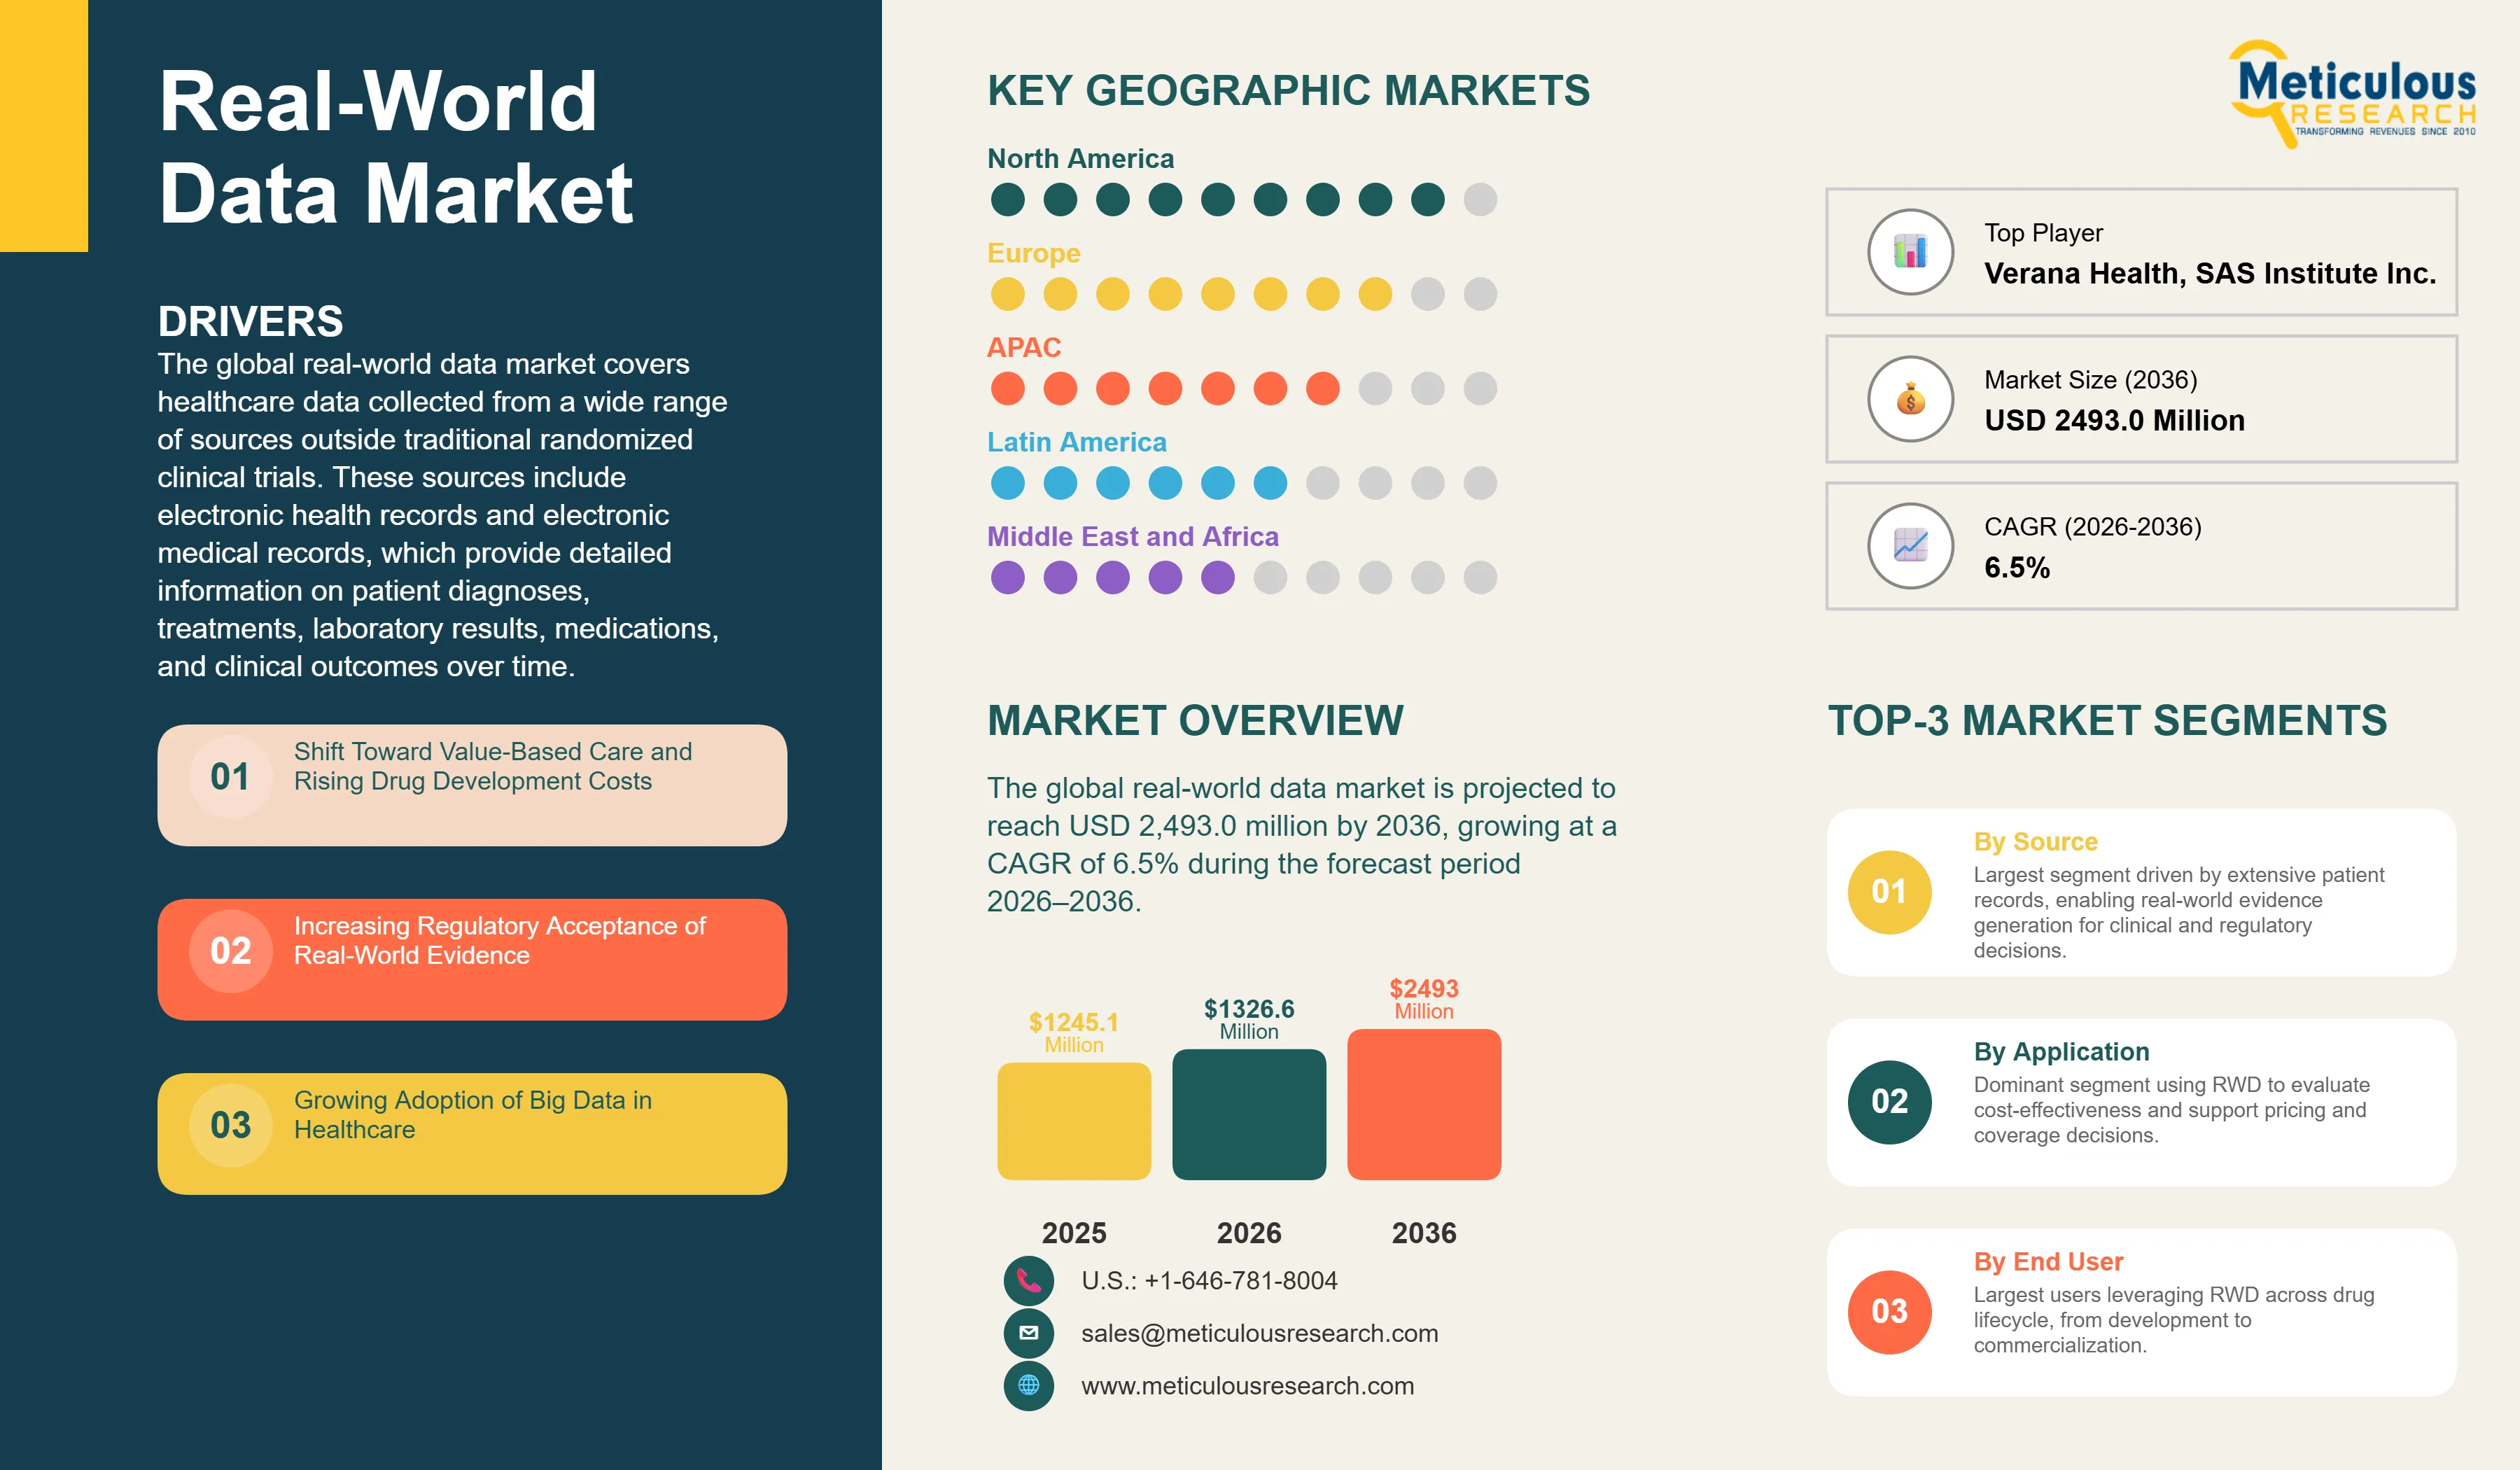
The global real-world data market covers healthcare data collected from a wide range of sources outside traditional randomized clinical trials. These sources include electronic health records and electronic medical records, which provide detailed information on patient diagnoses, treatments, laboratory results, medications, and clinical outcomes over time. Other key sources include medical claims and billing databases, pharmacy dispensing data, disease and product registries, genomics data, patient-generated health data from wearable devices and remote monitoring technologies, and unstructured clinical information such as physician notes, pathology reports, and medical images.
Together, these different types of data help generate real-world evidence that is now widely used across the pharma lifecycle from drug development and regulatory approvals to safety monitoring, health assessments, and everyday clinical decision making.
The growth of the overall real-world data market is primarily driven by the ongoing shift from traditional fee for service models toward value based care, which requires reliable data on patient outcomes and healthcare utilization. Rising drug development costs are also helping pharmaceutical companies to integrate real-world data across the product lifecycle, from early research through post market surveillance. At the same time, regulatory agencies are progressively recognizing the value of real-world evidence in supporting drug approvals, label expansions, and reimbursement decisions. Furthermore, the rapid growth of healthcare data, driven by prevalent adoption of electronic health records, connected medical devices, genomics technologies, and digital health platforms, is creating large datasets that can be analyzed to generate valuable clinical insights.
However, the growth of this market is restrained by strict data privacy regulations, limited data interoperability between healthcare systems, data quality concerns, and differences in regulatory requirements across regions. These challenges continue to pose barriers for organizations seeking to fully leverage real-world data for healthcare research and decision-making.
On the other hand, the integration of artificial intelligence and advanced analytics presents significant growth opportunities for market contributors by improving the ability to analyze large healthcare datasets and extract meaningful clinical insights. Emerging regulatory initiatives supporting data sharing and patient centric research are also expected to expand the use of real-world evidence substantially during the forecast period. Additionally, the growing focus on personalized medicine and the increasing clinical and commercial importance of underserved therapeutic areas are anticipated to further drive market growth.
A major trend shaping this market is the growing role of decentralized and patient centric data collection models, which are broadening the geographic and demographic reach of real-world evidence generation and supporting more representative analyses of treatment outcomes across diverse patient populations.
Drivers: Shift Toward Value-Based Care and Rising Drug Development Costs
A key driver of the real-world data market is the global healthcare industry's transition from volume-based to value-based care. In this paradigm, reimbursement is tied to patient outcomes and the overall value of care delivered. RWE is critical for all stakeholders to demonstrate and assess the real-world effectiveness and economic impact of a given therapy, enabling payers to make informed coverage decisions and providers to optimize treatment pathways. Concurrently, the biopharmaceutical industry is grappling with soaring R&D costs and lengthy development timelines. RWD offers a powerful solution to improve the efficiency of this process, from optimizing clinical trial design and recruitment to supporting regulatory submissions with supplementary evidence, thereby accelerating time-to-market and reducing costs.
Opportunity: Personalized Medicine and Underserved Therapeutic Areas
The growing emphasis on personalized medicine presents a significant opportunity for the real-world data market. RWD allows researchers to analyze the effectiveness of treatments in specific patient subpopulations defined by genetic markers, lifestyle factors, or comorbidities. This enables the development of targeted therapies and tailored treatment strategies that can improve outcomes for individuals. Furthermore, RWD is invaluable for studying rare diseases and other underserved therapeutic areas where conducting large-scale RCTs is often not feasible. By aggregating data from a small number of geographically dispersed patients, researchers can generate meaningful evidence to support the development and approval of orphan drugs and other specialized treatments.
Shift Toward Value-Based Care Accelerating Real-World Evidence Adoption Across Healthcare Systems
Healthcare systems worldwide are undergoing a structural transition from volume based to value based care models, basically reshaping how clinical and economic evidence is generated, evaluated, and applied. This transition is creating sustained demand for real-world data across pharmaceutical companies, healthcare payers, and providers, as all stakeholders increasingly require evidence on patient outcomes, healthcare utilization, and treatment effectiveness derived from actual clinical practice rather than controlled trial settings.
Payers and health assessment agencies are increasingly looking for real-world performance data before approving coverage especially for expensive treatments like cancer therapies, rare disease drugs, and advanced biologics. At the same time, new pricing and reimbursement models, such as the U.S. Inflation Reduction Act and the EU HTA Regulation are pushing pharma companies to build stronger real-world evidence programs to support approvals, negotiations, and outcomes based deals. This growing association between commercial and regulatory expectations is likely to remain a key driver for growth of this market during the forecast period.
Growing Regulatory Acceptance of Real-World Evidence Across Major Geographies
Regulatory agencies across North America, Europe, and Asia Pacific are progressively expanding the scope of acceptable uses for real-world evidence in drug and device development. In the United States, the FDA's Real-World Evidence Program and the broader framework established under the 21st Century Cures Act have created a structured pathway for sponsors to incorporate real-world data into regulatory submissions, label expansion requests, and post marketing study commitments.
In Europe, the European Health Data Space Regulation and the EU Joint Clinical Assessment framework, effective since March 2025, mark a major shift in how real-world evidence is collected, shared, and evaluated across member states. These regulatory advancements are significantly reducing the friction associated with cross-border data access and are expected to increase the commercial adoption of real-world evidence in health technology assessment and reimbursement decisions. As regulatory frameworks in Japan, South Korea, and key Asia Pacific markets continue to evolve in parallel, the global regulatory environment is becoming increasingly supportive of real-world data as a core component of the clinical evidence ecosystem.
Integration of Artificial Intelligence and Advanced Analytics Transforming Real-World Data Capabilities
The rapid advancement of artificial intelligence and machine learning is transforming how healthcare organizations and analytics providers turn large, complex datasets into actionable insights. AI powered tools, like natural language processing can pull meaningful clinical information from unstructured sources such as doctor notes, radiology reports, and pathology records are boosting both the amount and quality of real-world data that can be analysed.
Predictive analytics and machine learning models are also being applied to patient stratification, forecast treatment outcomes, and spot safety signals after a drug hits the market, creating new use cases for real-world evidence generation that were not feasible with conventional analytical approaches. With AI tools combine with increasingly available, connected patient data from electronic health records, insurance claims, and genomics advanced analytics is becoming a key driver of next-generation real-world evidence programs for pharma companies, payers, and healthcare providers.
|
Parameters |
Details |
|
Market Size by 2036 |
USD 2,493.0 Million |
|
Market Size in 2026 |
USD 1,326.6 Million |
|
Revenue Growth Rate (2026–2036) |
CAGR of 6.5% |
|
Dominating Source |
EMR/EHR/Clinical Data |
|
Fastest Growing Source |
Pharmacy Data |
|
Dominating Application |
Market Access & Reimbursement/Payer Decisions |
|
Fastest Growing Application |
Drug Development & Approvals |
|
Dominating End User |
Pharmaceutical, Biotechnology & Medical Device Companies |
|
Dominating Geography |
North America |
|
Fastest Growing Geography |
Asia Pacific |
|
Base Year |
2025 |
|
Forecast Period |
2026 to 2036 |
Based on source, the global real-world data market is segmented into EMR/EHR/clinical data, claims and billing data, pharmacy data, product/disease registries data, genomics data, patient-generated/wearable data, and other sources. The large market share of this segment is attributed to the massive volumes of structured and longitudinal data generated across hospital networks globally, the accelerating adoption of interoperable EHR and EMR systems, and the widespread use of clinical data for real-world evidence generation across regulatory and commercial decision-making contexts.
However, the pharmacy data segment is projected to register the highest groth during the forecast period. The high growth of this segment is driven by increasing demand for insights related to medication utilization, treatment adherence, and real-world drug effectiveness. Pharmacy dispensing data provide detailed information on prescription fills, refill patterns, dosage adjustments, and medication persistence, which are critical for evaluating treatment outcomes and patient behavior in real-world settings. The growing focus on value based healthcare and outcomes-based reimbursement models is further driving demand for pharmacy data to assess the real-world performance of pharmaceutical products. The expansion of digital pharmacy platforms, specialty pharmacies, and integrated pharmacy benefit management systems is also improving data availability and enabling more comprehensive analysis of medication usage patterns.
Based on application, the global real-world data market is segmented into drug development and approvals, market access and reimbursement/payer decisions, post-market surveillance, medical device development and approvals, and clinical and regulatory decision-making. The large share of this segment is primarily because healthcare payers and insurance providers increasingly require real-world evidence to evaluate the clinical effectiveness, cost effectiveness, and long-term outcomes of therapies before granting coverage approvals. With the rising cost of innovative treatments, particularly in oncology, rare diseases, and advanced biologics, payers rely extensively on real-world data to support pricing negotiations, reimbursement decisions, and value-based payment models. Health technology assessment agencies and government healthcare programs similarly require evidence on treatment performance in real-world populations to ensure that healthcare spending delivers measurable patient outcomes. As a result, pharmaceutical companies frequently use real-world data to support payer submissions, coverage negotiations, and value-based contracts, which underpins the dominant market share of this segment.
The drug development and approvals segment is expected to account for the second largest share of the global real-world data market in 2026, driven by the accelerating integration of real-world evidence into pharmaceutical development pipelines, the expanding use of external control arms in regulatory submissions, and the growing recognition by the FDA and EMA of real-world evidence as a legitimate and increasingly required component of evidence packages for drug approvals and label expansions.
Based on end user, the global real-world data market is segmented into pharmaceutical, biotechnology, and medical device companies; healthcare payers; healthcare providers; and other end users including academic research institutions, patient advocacy groups, government regulators, and health technology assessment agencies. The leading market share of this segment is driven by the growing adoption of real-world data across the drug development lifecycle, from target identification and clinical trial design through post-market surveillance, as well as the mounting regulatory and commercial imperative to demonstrate real-world treatment value to payers and health technology assessment bodies.
Based on geography, the global real-world data market is segmented into North America, Europe, Asia Pacific, Latin America, and the Middle East and Africa. North America is projected to account for the largest share of the global real-world data market throughout the forecast period, driven by the advanced healthcare infrastructure of the United States and Canada, a high concentration of real-world data solution providers, and a progressive regulatory environment anchored by the FDA's Real-World Evidence Program and the 21st Century Cures Act.
Europe ranks as the second largest regional market and is experiencing a major shift in regulation and data governance with the launch of the European Health Data Space Regulation and the EU Joint Clinical Assessment framework in March 2025. These changes are expected to enhance cross border data access and speed up the use of real-world evidence in health technology assessments and reimbursement decisions across EU member states.
However, Asia Pacific is expected to grow at the fastest rate during the forecast period. The rapid growth of this region is propelled by healthcare digitization in China and India, expanding clinical trial activity across the region, and evolving regulatory frameworks in Japan, South Korea, and Taiwan. Latin America and the Middle East and Africa, while relatively smaller markets, are growing as real-world data gains increasing traction in supporting health technology assessments and post-market surveillance programs.
The competitive landscape of the global real-world data market is shaped by the depth and breadth of proprietary data assets, analytical capabilities, therapeutic area expertise, and the strength of relationships with pharmaceutical, payer, and provider organizations. Leading players are actively pursuing partnerships, agreements, and collaborations, along with product launches and platform enhancements, to strengthen their market positions and expand their real-world evidence service portfolios.
Some of the key players operating in the global real-world data market include IQVIA Inc. (U.S.), PPD Inc. (U.S.), Merative (U.S.), Optum Inc. (U.S.), ICON plc (Ireland), Syneos Health (U.S.), Aetion, Inc. (U.S.), Flatiron Health, Inc. (U.S.), Verana Health (U.S.), Oracle Corporation (U.S.), SAS Institute Inc. (U.S.), Parexel International Corporation (U.S.), and Elevance Health, Inc. (U.S.), among others.
The global real-world data market is expected to reach USD 2,493.0 million by 2036 from an estimated USD 1,326.6 million in 2026, at a CAGR of 6.5% during the forecast period 2026–2036.
In 2026, the EMR/EHR/clinical data segment is expected to hold the largest share of the global real-world data market, driven by massive data volumes generated across hospital networks and the widespread use of clinical data for real-world evidence generation.
The pharmacy data segment is expected to register the highest growth during the forecast period 2026–2036, driven by increasing demand for insights on medication utilization, treatment adherence, and real-world drug effectiveness.
In 2026, the market access and reimbursement/payer decisions segment is expected to hold the largest share of the global real-world data market.
In 2026, the pharmaceutical, biotechnology, and medical device companies segment is expected to hold the largest share of the global real-world data market.
The growth of this market is primarily driven by the structural shift toward value-based care, rising drug development costs encouraging real-world data adoption across the product lifecycle, increasing regulatory acceptance of real-world evidence by the FDA and EMA, and the rapid growth of healthcare data driven by widespread adoption of electronic health records, connected medical devices, genomics technologies, and digital health platforms.
Key players operating in the real-world data market include IQVIA Inc. (U.S.), PPD Inc. (U.S.), Merative (U.S.), Optum Inc. (U.S.), ICON plc (Ireland), Syneos Health (U.S.), Aetion, Inc. (U.S.), Flatiron Health, Inc. (U.S.), Verana Health (U.S.), Oracle Corporation (U.S.), SAS Institute Inc. (U.S.), Parexel International Corporation (U.S.), and Elevance Health, Inc. (U.S.).
Asia Pacific is expected to register the highest growth rate in the global real-world data market during the forecast period 2026–2036.


Published Date: Jun-2026
Published Date: Feb-2026
Published Date: Jul-2023
Please enter your corporate email id here to view sample report.
Subscribe to get the latest industry updates