Resources
About Us
Edible Insects Market by Product Type (Whole Insects, Insect Powder), Insect Type (Crickets, Mealworms, Black Soldier Flies, Buffalo Worms, Grasshoppers), Application (Food and Beverages, Feed and Pet Food), End User, & Geography - Global Forecast to 2035
Report ID: MRFB - 104460 Pages: 230 May-2025 Formats*: PDF Category: Food and Beverages Delivery: 24 to 48 Hours Download Free Sample ReportThis report examines the global market for edible insects, focusing on how solution providers are responding to the growing demand for sustainable protein sources, rising global population and food security concerns, and the changing demand of alternative protein markets worldwide. It offers a strategic evaluation of market dynamics, forecasts growth through 2035, and assesses competitive positioning at both global and regional/country levels.
Key Market Drivers & Trends
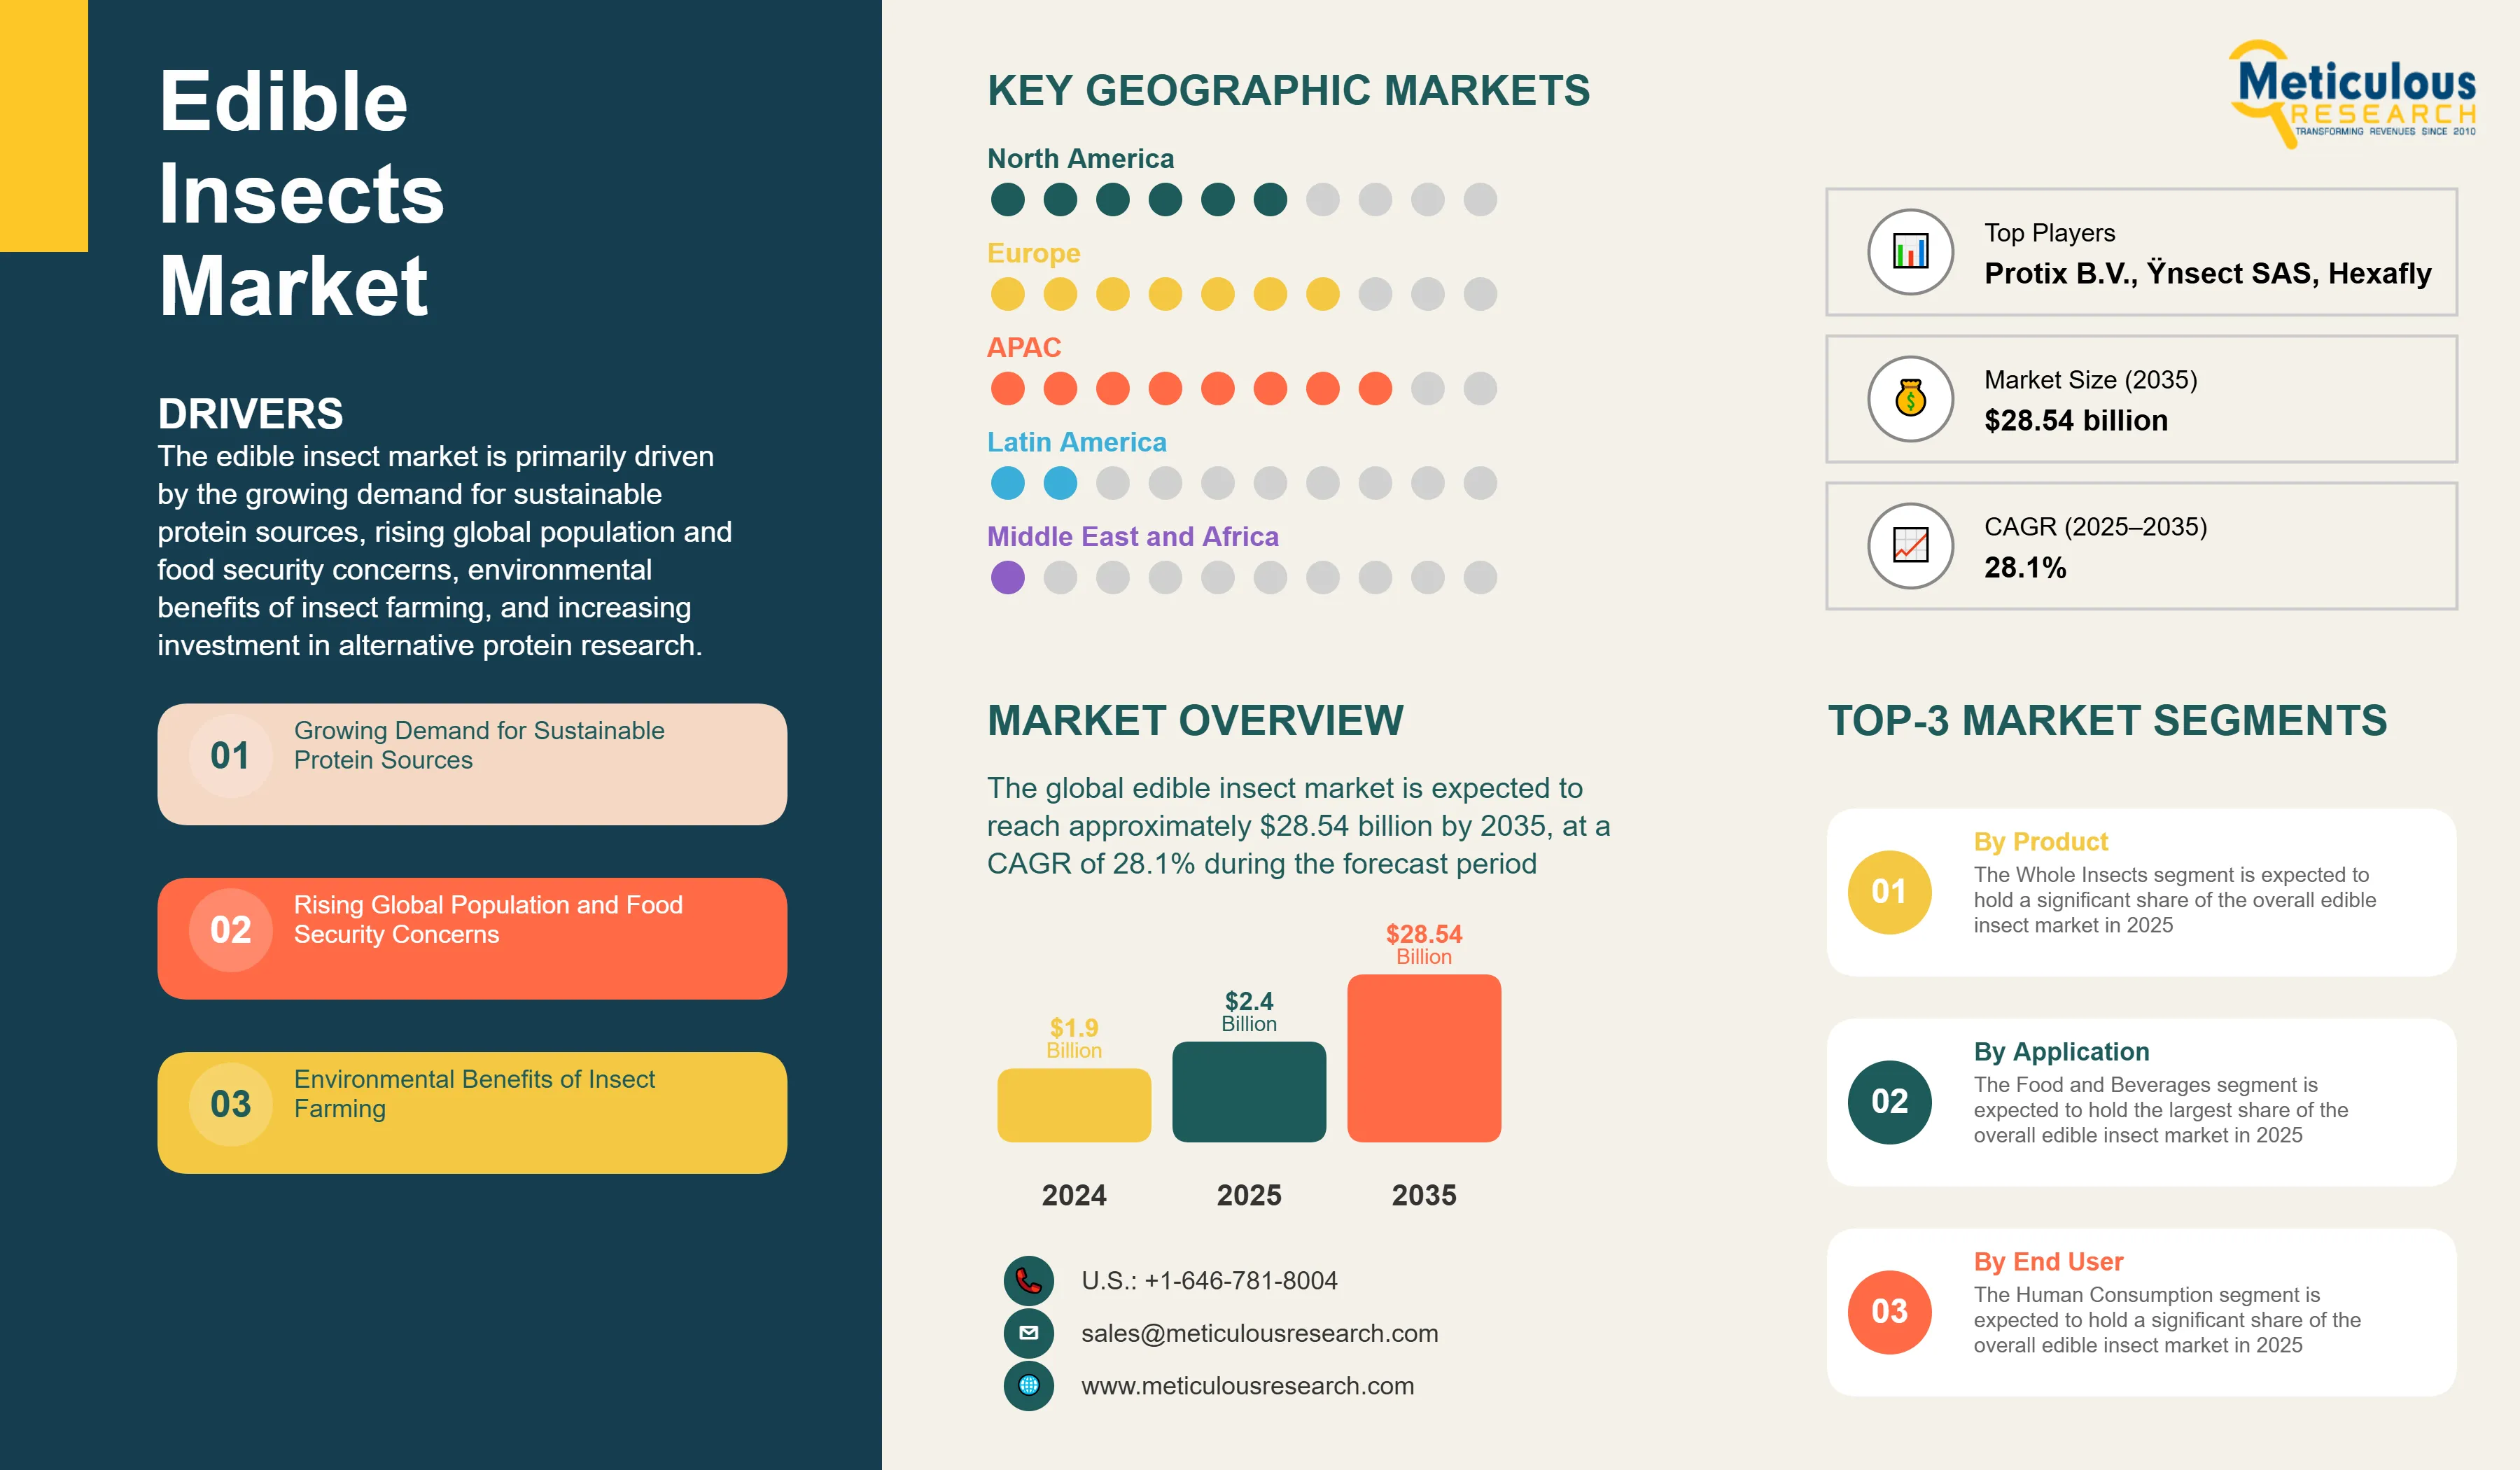
The edible insect market is primarily driven by the growing demand for sustainable protein sources, rising global population and food security concerns, environmental benefits of insect farming, and increasing investment in alternative protein research. The shift towards cricket-based protein products and powder and flour processing for food integration are reshaping the industry, while premium and organic insect products and automation in insect farming technologies are gaining significant traction. Additionally, growing acceptance in Western markets and integration with plant-based food industry are further driving market growth, especially in developed markets with advanced food processing infrastructure.
Key Challenges
Although the edible insect market holds substantial growth potential, it encounters several challenges such as cultural and psychological barriers to consumption, regulatory challenges and food safety concerns, and high production and processing costs. Furthermore, hurdles like limited consumer awareness and education, standardization of quality and safety protocols, and scaling production to meet growing demand pose significant barriers that could hinder market adoption in different parts of the world.
Growth Opportunities
The edible insect market presents numerous avenues for high growth. Expansion in pet food and animal feed markets offers substantial opportunities for market players looking to reach new customer bases. Integration with plant-based food industry provides another key opportunity, enhancing the accessibility of sustainable protein alternatives. Moreover, the development of processed and familiar food forms and emerging markets in Asia-Pacific and Africa are generating new revenue streams for solution providers as organizations seek efficient alternatives to traditional protein sources.
Market Segmentation Highlights and Insights
Click here to: Get Free Sample Pages of this Report
By Product
The Whole Insects segment is expected to hold a significant share of the overall edible insect market in 2025, due to its traditional consumption patterns and growing acceptance in Western markets. However, the Insect Powder segment is expected to grow at the fastest CAGR during the forecast period, driven by increasing food integration applications, technological advancements in processing, and the push for familiar food forms in protein bars and baked products.
By Insect Type
The Crickets segment is expected to dominate the overall edible insect market in 2025, primarily due to their high protein content, established farming practices, and widespread acceptance across different cultures. However, the Black Soldier Flies segment is expected to grow at the fastest CAGR through the forecast period, driven by their superior feed conversion efficiency, waste management applications, and increasing adoption in animal feed industries.
By Application
The Food and Beverages segment is expected to hold the largest share of the overall edible insect market in 2025, due to the growing consumer acceptance of alternative proteins and increased product innovation in processed foods. However, the Feed and Pet Food segment is expected to experience the fastest growth rate during the forecast period, driven by growing demand for sustainable animal nutrition, aquaculture feed applications, and the advantages insects offer in pet food formulations.
By End User
The Human Consumption segment is expected to hold a significant share of the overall edible insect market in 2025, due to the increasing awareness of nutritional benefits and growing acceptance of insect-based foods. However, the Animal Nutrition segment is expected to experience substantial growth during the forecast period, driven by expanding livestock industry, sustainable feed alternatives demand, and the advantages insects offer in animal feed applications.
By Geography
Asia-Pacific is expected to hold the largest share of the global edible insect market in 2025, driven by traditional consumption patterns, cultural acceptance, established insect farming practices, and significant investments in scaling production. Additionally, emerging markets in the region and growing food security concerns contribute significantly to market dominance. Europe follows as the second-largest market, bolstered by progressive regulatory frameworks and increasing focus on sustainable protein sources. However, North America is witnessing significant growth rate during the forecast period, primarily driven by expanding alternative protein market, growing consumer awareness, rising investment in insect farming technologies, and the advantages insects offer as sustainable protein sources.
Competitive Landscape
The global edible insect market is characterized by a diverse competitive environment, comprising established food processing companies, insect farming specialists, alternative protein solution providers, and innovative startups, each adopting unique approaches to advancing sustainable protein technologies.
Within this landscape, the companies are segmented into industry leaders, market differentiators, vanguards, and contemporary stalwarts, with each group implementing distinct strategies to sustain their competitive edge. Leading companies are prioritizing integrated solutions that merge cutting-edge farming technologies with comprehensive food processing capabilities, while also addressing sustainability challenges specific to various regions.
The key players operating in the global edible insect market are Protix B.V., Ÿnsect SAS, Innovafeed SAS, Aspire Food Group, Agronutris SAS, Enterra Feed Corporation, Beta Hatch Inc., HiProMine S.A., Entomo Farms, Kreca Ento-Feed BV, Nutrition Technologies Pte. Ltd., Hexafly Ltd., Micronutris SAS, EnviroFlight LLC, Next Millennium Farms Inc., Jimini's SAS, Eat Grub Ltd., Thailand Unique Co., Ltd., and C-fu Foods Ltd. among others.
|
Particulars |
Details |
|
Number of Pages |
230 |
|
Format |
PDF & Excel |
|
Forecast Period |
2025–2035 |
|
Base Year |
2024 |
|
CAGR (Value) |
28.1% |
|
Market Size (Value) in 2025 |
USD 2.4 Billion |
|
Market Size (Value) in 2035 |
USD 28.54 Billion |
|
Segments Covered |
Market Assessment, by System Type
Market Assessment, by Insect Type
Market Assessment, by Application
Market Assessment, by End User
|
|
Countries Covered |
North America (U.S., Canada), Europe (Netherlands, Belgium, France, Denmark, Finland, Germany, U.K., Spain, Poland, Ireland, Sweden, Italy, Other European Countries), Asia-Pacific (Thailand, China, South Korea, Vietnam, Japan, Australia, India, Malaysia, Singapore, Other APAC Countries), Latin America (Brazil, Mexico, Rest of Latin America), Middle East & Africa |
|
Key Companies |
Protix B.V. (Netherlands), Ÿnsect SAS (France), Innovafeed SAS, Aspire Food Group (Canada), Agronutris SAS, Enterra Feed Corporation, Beta Hatch Inc., HiProMine S.A., Entomo Farms, Kreca Ento-Feed BV, Nutrition Technologies Pte. Ltd., Hexafly Ltd., Micronutris SAS, EnviroFlight LLC, Next Millennium Farms Inc., Jimini's SAS, Eat Grub Ltd., Thailand Unique Co., Ltd., C-fu Foods Ltd., among others |
The global edible insect market was valued at $1.9 billion in 2024. This market is expected to reach approximately $28.54 billion by 2035, growing from an estimated $2.4 billion in 2025, at a CAGR of 28.1% during the forecast period of 2025–2035.
The global edible insect market is expected to grow at a CAGR of 28.1% during the forecast period of 2025–2035.
The global edible insect market is expected to reach approximately $28.54 billion by 2035, growing from an estimated $2.4 billion in 2025, at a CAGR of 28.1% during the forecast period of 2025–2035.
The key companies operating in this market include Protix B.V. (Netherlands), Ÿnsect SAS (France), Innovafeed SAS, Aspire Food Group (Canada), Agronutris SAS, Enterra Feed Corporation, Beta Hatch Inc., HiProMine S.A., Entomo Farms, Kreca Ento-Feed BV, and others.
Major trends shaping the market include cricket-based protein products leading market growth, powder and flour processing for food integration, premium and organic insect products, and automation in insect farming technologies.
• In 2025, the Whole Insect segment is expected to dominate the overall edible insect market by product type
• Based on insect type, the Crickets segment is expected to hold the largest share of the overall market in 2025
• Based on application, the Food and Beverages segment is expected to hold the largest share of the overall market in 2025
• Based on end user, the Human Consumption segment is expected to hold the largest share of the global market in 2025
Asia-Pacific is expected to hold the largest share of the global edible insect market in 2025, driven by traditional insect consumption practices, cultural acceptance of entomophagy, and established insect farming infrastructure in key countries. North America is witnessing the fastest growth rate during the forecast period, driven by rapid adoption of alternative proteins and increasing investment in food technology.
The growth of this market is driven by growing demand for sustainable protein sources, rising global population and food security concerns, environmental benefits of insect farming, and increasing investment in alternative protein research.


Published Date: Jan-2025
Published Date: Jan-2025
Published Date: Jan-2025
Published Date: Jan-2025
Published Date: Jun-2024
Please enter your corporate email id here to view sample report.
Subscribe to get the latest industry updates