Resources
About Us
This report examines the global market for dermoscopy and skin visualization devices, focusing on how solution providers are responding to the rising incidence of skin cancer and other dermatological conditions, the growing need for early diagnosis, and the changing demands of dermatological care worldwide. It offers a strategic evaluation of market dynamics, forecasts growth through 2035, and assesses competitive positioning at both global and regional/country levels.
Key Market Drivers & Trends and Insights
Click here to: Get Free Sample Pages of this Report
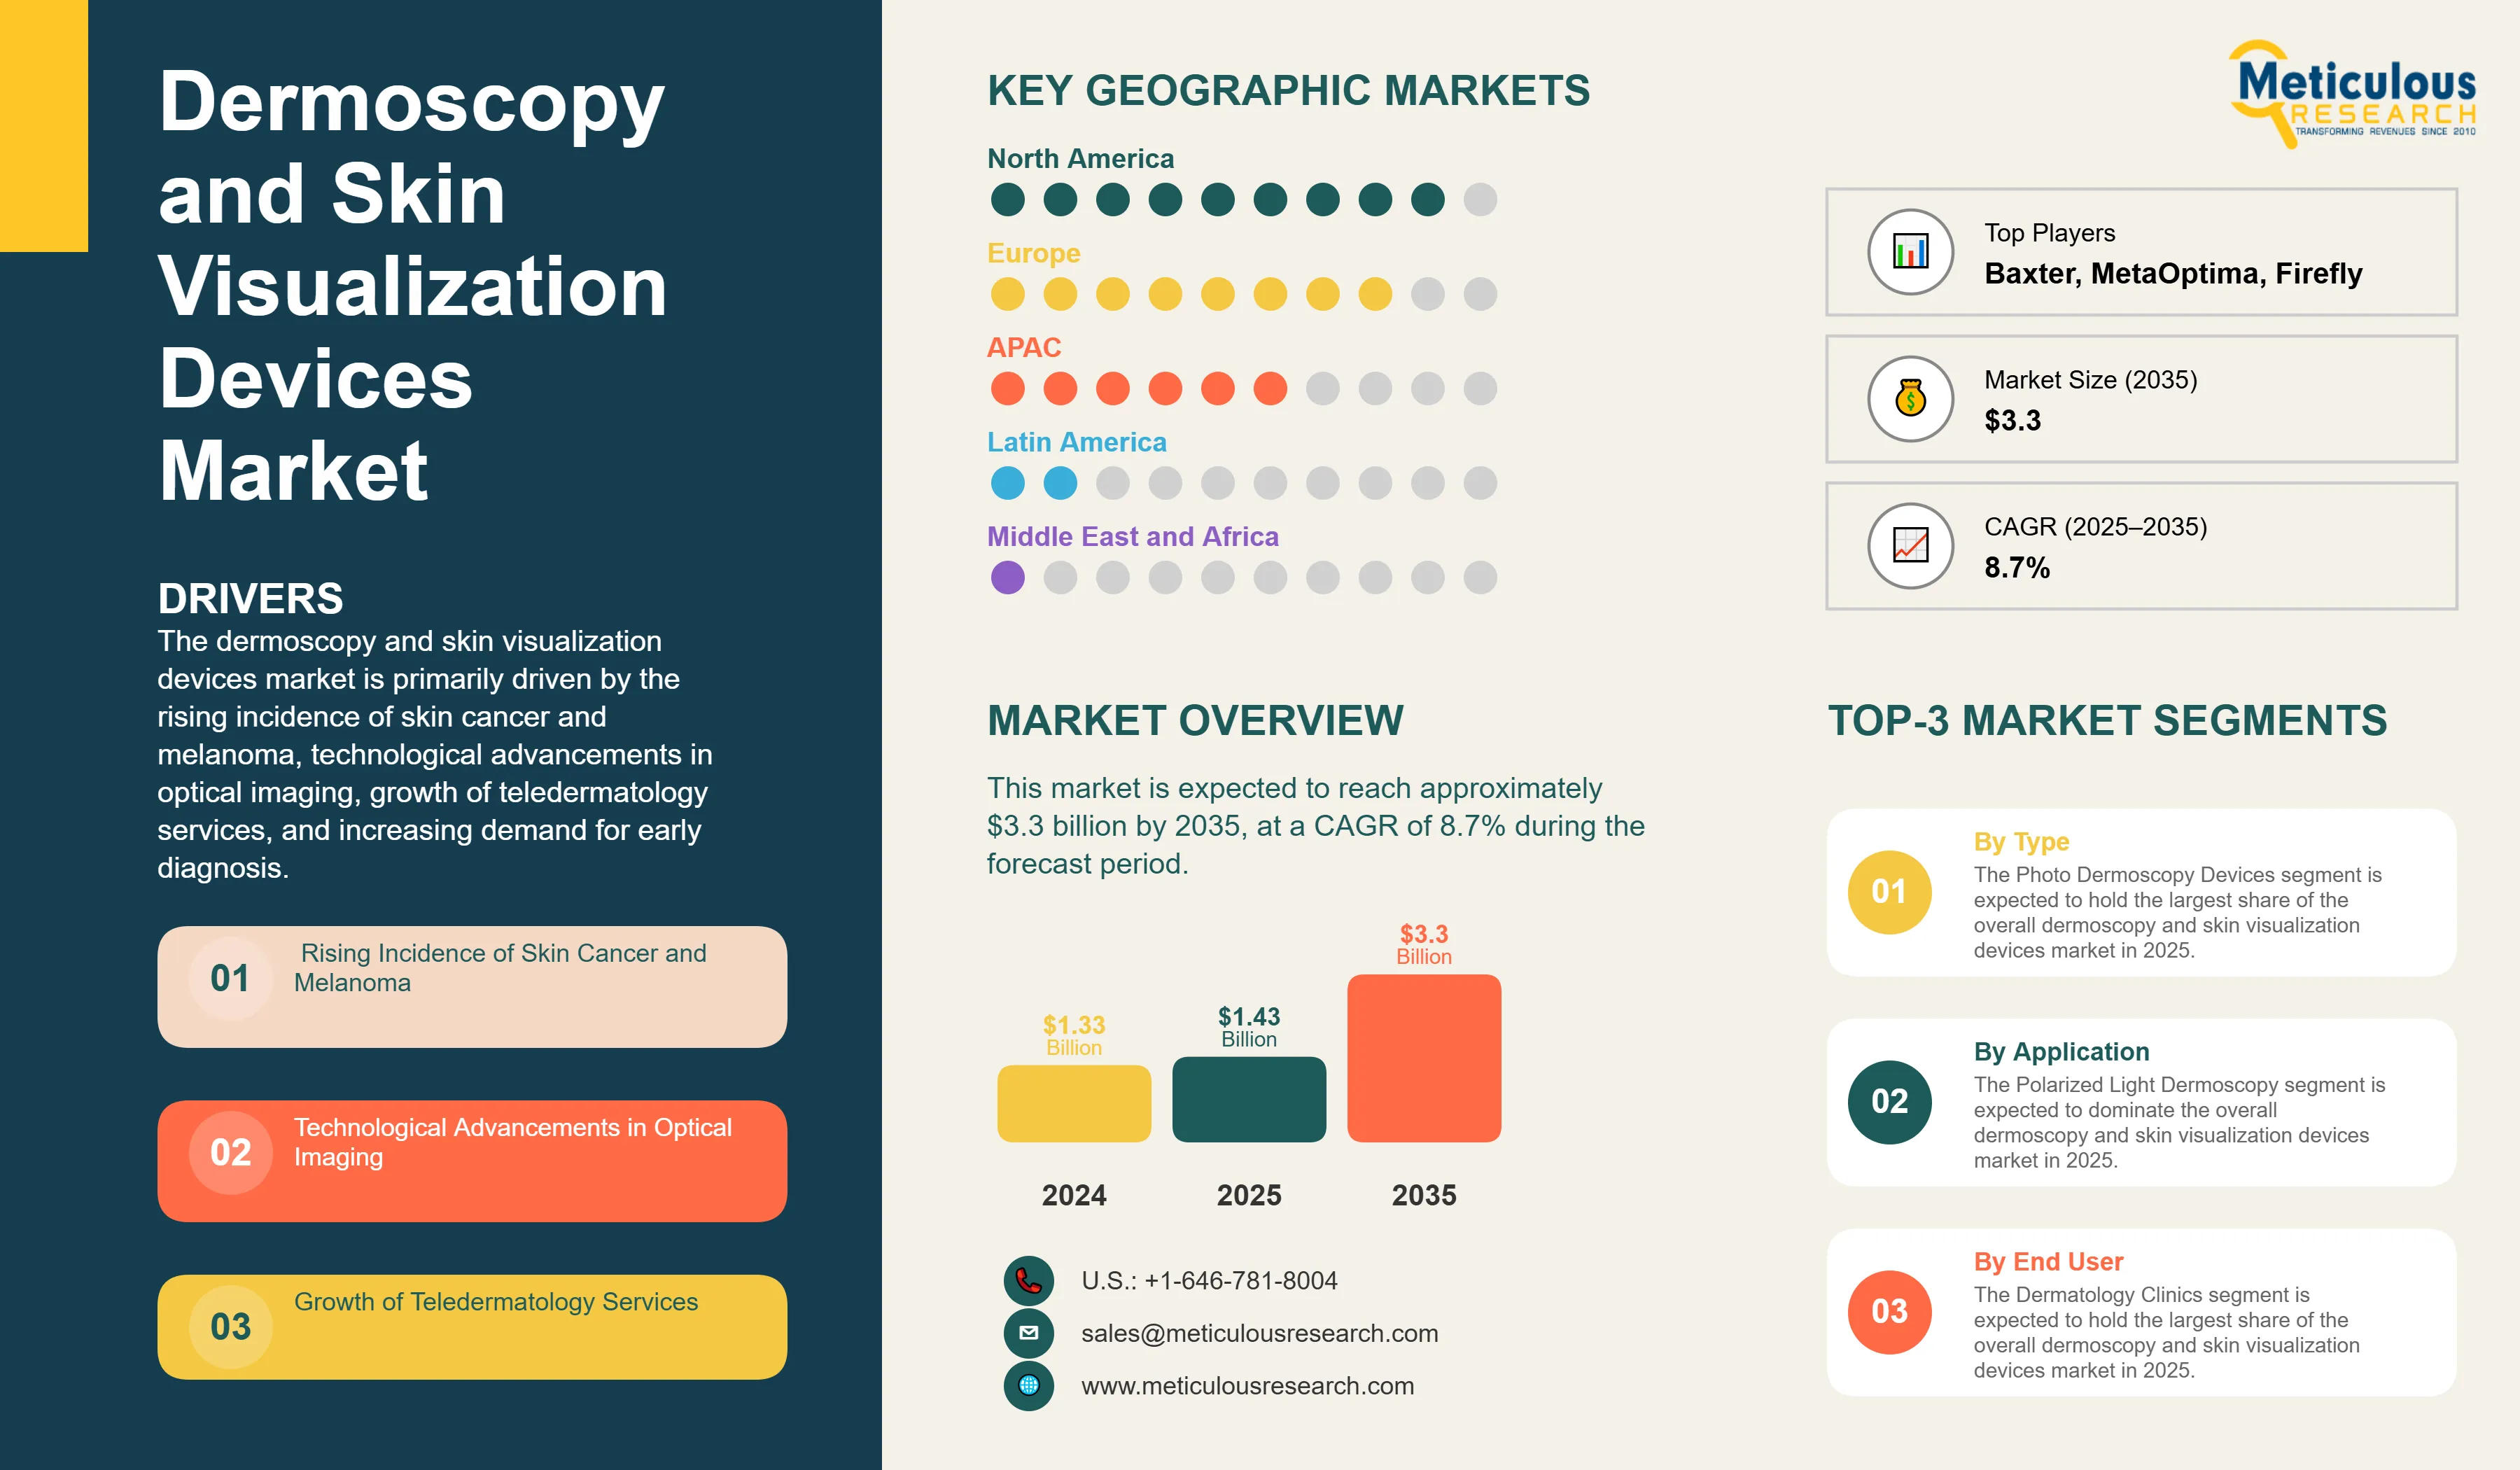
The dermoscopy and skin visualization devices market is primarily driven by the rising incidence of skin cancer and melanoma, technological advancements in optical imaging, growth of teledermatology services, and increasing demand for early diagnosis. The shift towards portable and wearable dermoscopy devices and wireless smartphone-compatible technologies are reshaping the industry, while cross-polarization and multispectral imaging technologies are gaining significant traction. Additionally, integration with smartphone and AI tools and growing applications in cosmetic dermatology are further driving market growth, especially in developed markets with advanced dermatological care infrastructure.
Key Challenges
Although the dermoscopy and skin visualization devices market holds substantial growth potential, it encounters several challenges such as the high cost of advanced equipment, limited reimbursement frameworks, and low awareness levels in developing regions. Furthermore, hurdles like regulatory compliance across various countries, lack of product standardization, and data privacy issues related to connected devices pose significant barriers that could hinder market adoption in different parts of the world.
Growth Opportunities
The dermoscopy and skin visualization devices market presents numerous avenues for high growth. Emerging markets offer substantial expansion opportunities for market players looking to reach new customer bases. Integrating devices with smartphones and AI provides another key opportunity, enhancing the accessibility of advanced skin diagnostics. Moreover, the increasing use of these devices in cosmetic dermatology is generating new revenue streams for solution providers as organizations seek efficient alternatives to traditional assessment methods.
Market Segmentation Highlights
By Product Type
The Photo Dermoscopy Devices segment is expected to hold the largest share of the overall dermoscopy and skin visualization devices market in 2025, due to its superior imaging capabilities and growing adoption in dermatology clinics and hospitals across the globe. However, the Smartphone-Compatible Dermoscopy Devices segment is expected to grow at the fastest CAGR during the forecast period, driven by increasing smartphone penetration, technological advancements in mobile cameras, and the push for telehealth solutions in dermatology.
By Technology
The Polarized Light Dermoscopy segment is expected to dominate the overall dermoscopy and skin visualization devices market in 2025, primarily due to its effective visualization of subsurface skin structures and widespread adoption in clinical settings. However, the Hybrid & Multispectral Imaging segment is expected to grow at the fastest CAGR through the forecast period, driven by its superior diagnostic capabilities, enhanced visualization of vascular structures, and increasing research validating its clinical efficacy.
By Application
The Skin Cancer Diagnosis segment is expected to hold the largest share of the overall dermoscopy and skin visualization devices market in 2025, due to the rising global incidence of skin cancer and increased emphasis on early detection. However, the Cosmetic and Aesthetic Dermatology segment is expected to experience the fastest growth rate during the forecast period, driven by growing consumer demand for aesthetic procedures, increasing focus on skin health, and adoption of advanced imaging technologies for treatment planning and monitoring.
By End User
The Dermatology Clinics segment is expected to hold the largest share of the overall dermoscopy and skin visualization devices market in 2025, due to the high volume of dermatological examinations performed in specialized settings and increasing adoption of advanced diagnostic technologies. However, the Teledermatology Providers segment is expected to experience the fastest growth rate during the forecast period, driven by expanding telehealth infrastructure, increasing acceptance of remote consultations, and the advantages dermoscopy offers in virtual skin assessments.
By Geography
North America is expected to hold the largest share of the global dermoscopy and skin visualization devices market in 2025, driven by advanced healthcare infrastructure, high incidence of skin cancer, strong adoption of innovative technologies, and significant investments in dermatological care. Additionally, favorable reimbursement policies and high awareness about skin health contribute significantly to market dominance. Europe follows as the second-largest market, bolstered by strong healthcare systems and increasing focus on preventive care. However, Asia-Pacific is witnessing the fastest growth rate during the forecast period, primarily driven by expanding healthcare facilities, growing awareness about skin cancer, rising disposable income, and the advantages dermoscopy offers in early diagnosis of skin conditions.
Competitive Landscape
The global dermoscopy and skin visualization devices market is characterized by a diverse competitive environment, comprising established medical device manufacturers, dermatology technology experts, healthcare solution providers, and innovative startups, each adopting unique approaches to advancing skin visualization technologies.
Within this landscape, solution providers are segmented into industry leaders, market differentiators, vanguards, and contemporary stalwarts, with each group implementing distinct strategies to sustain their competitive edge. Leading companies are prioritizing integrated solutions that merge cutting-edge imaging technologies with comprehensive dermatological care, while also addressing healthcare challenges specific to various regions.
The key players operating in the global dermoscopy and skin visualization devices market are FotoFinder Systems GmbH (including DermLite LLC), Canfield Scientific, Inc., HEINE Optotechnik GmbH & Co. KG, Baxter International Inc. (Hillrom/Welch Allyn), AMD Global Telemedicine, Inc., Firefly Global, AnMo Electronics Corporation (Dino-Lite), Carl Zeiss Meditec AG, MetaOptima Technology Inc., ILLUCO Corporation Ltd., 3Derm Systems, Inc., MedX Health Corp., Caliber Imaging & Diagnostics, Inc., SciBase Holding AB, Opticlar Vision Ltd., Rudolf Riester GmbH, DermoScan GmbH, MAVIG GmbH, Bomtech Electronics Co., Ltd., and KaWe - Kirchner & Wilhelm GmbH + Co. KG among others.
|
Particulars |
Details |
|
Number of Pages |
195 |
|
Format |
PDF & Excel |
|
Forecast Period |
2025–2035 |
|
Base Year |
2024 |
|
CAGR (Value) |
8.7% |
|
Market Size (Value) in 2025 |
USD 1.43 Billion |
|
Market Size (Value) in 2035 |
USD 3.3 Billion |
|
Segments Covered |
Market Assessment, by Product Type
Market Assessment, by Technology
Market Assessment, by Application
Market Assessment, by End User
|
|
Countries Covered |
North America (U.S., Canada), Europe (Germany, U.K., France, Italy, Spain, Rest of Europe), Asia-Pacific (Japan, China, India, Australia, South Korea, Rest of Asia-Pacific), Latin America (Brazil, Mexico, Rest of Latin America), Middle East & Africa (UAE, Saudi Arabia, South Africa, Rest of MEA) |
|
Key Companies |
FotoFinder Systems GmbH (including DermLite LLC), Canfield Scientific, Inc., HEINE Optotechnik GmbH & Co. KG, Baxter International Inc. (Hillrom/Welch Allyn), AMD Global Telemedicine, Inc., Firefly Global, AnMo Electronics Corporation (Dino-Lite), Carl Zeiss Meditec AG, MetaOptima Technology Inc., ILLUCO Corporation Ltd., 3Derm Systems, Inc., MedX Health Corp., Caliber Imaging & Diagnostics, Inc., SciBase Holding AB, Opticlar Vision Ltd., Rudolf Riester GmbH, DermoScan GmbH, MAVIG GmbH, Bomtech Electronics Co., Ltd., KaWe - Kirchner & Wilhelm GmbH + Co. KG |
The global dermoscopy and skin visualization devices market was valued at $1.33 billion in 2024. This market is expected to reach approximately $3.3 billion by 2035, growing from an estimated $1.43 billion in 2025, at a CAGR of 8.7% during the forecast period of 2025–2035.
The global dermoscopy and skin visualization devices market is expected to grow at a CAGR of 8.7% during the forecast period of 2025–2035.
The global dermoscopy and skin visualization devices market is expected to reach approximately $3.3 billion by 2035, growing from an estimated $1.43 billion in 2025, at a CAGR of 8.7% during the forecast period of 2025–2035.
The key companies operating in this market include FotoFinder Systems GmbH (including DermLite LLC), Canfield Scientific, Inc., HEINE Optotechnik GmbH & Co. KG, Baxter International Inc. (Hillrom/Welch Allyn), AMD Global Telemedicine, Inc., Firefly Global, AnMo Electronics Corporation (Dino-Lite), Carl Zeiss Meditec AG, MetaOptima Technology Inc., ILLUCO Corporation Ltd., and others.
Major trends shaping the market include portable and wearable dermoscopy devices, wireless and smartphone-compatible technologies, cross-polarization and multispectral imaging, and integration with AI-powered diagnostic tools.
• In 2025, the Photo Dermoscopy Devices segment is expected to dominate the overall dermoscopy and skin visualization devices market by product type
• Based on technology, the Polarized Light Dermoscopy segment is expected to hold the largest share of the overall market in 2025
• Based on application, the Skin Cancer Diagnosis segment is expected to hold the largest share of the overall market in 2025
• Based on end user, the Dermatology Clinics segment is expected to hold the largest share of the global market in 2025
North America is expected to hold the largest share of the global dermoscopy and skin visualization devices market in 2025, driven by advanced healthcare infrastructure, high incidence of skin cancer, and significant investments in dermatological care. Asia-Pacific is witnessing the fastest growth rate during the forecast period.
The growth of this market is driven by rising incidence of skin cancer and melanoma, technological advancements in optical imaging, growth of teledermatology services, and increasing demand for early diagnosis.
1. Market Definition & Scope
1.1. Market Definition
1.2. Market Ecosystem
1.3. Currency
1.4. Key Stakeholders
2. Research Methodology
2.1. Research Approach
2.2. Process of Data Collection and Validation
2.2.1. Secondary Research
2.2.2. Primary Research/Interviews with Key Opinion Leaders
2.3. Market Sizing and Forecast
2.3.1. Market Size Estimation Approach
2.3.1.1. Bottom-up Approach
2.3.1.2. Top-down Approach
2.3.2. Growth Forecast Approach
2.3.3. Assumptions for the Study
3. Executive Summary
3.1. Overview
3.2. Segmental Analysis
3.2.1. Dermoscopy and Skin Visualization Devices Market, by Product Type
3.2.2. Dermoscopy and Skin Visualization Devices Market, by Technology
3.2.3. Dermoscopy and Skin Visualization Devices Market, by Application
3.2.4. Dermoscopy and Skin Visualization Devices Market, by End User
3.2.5. Dermoscopy and Skin Visualization Devices Market, by Geography
3.3. Competitive Landscape
4. Market Insights
4.1. Overview
4.2. Factors Affecting Market Growth
4.2.1. Drivers
4.2.1.1. Rising Incidence of Skin Cancer and Melanoma
4.2.1.2. Technological Advancements in Optical Imaging
4.2.1.3. Growth of Teledermatology Services
4.2.1.4. Increasing Demand for Early Diagnosis
4.2.2. Restraints
4.2.2.1. High Cost of Advanced Devices
4.2.2.2. Limited Reimbursement Policies
4.2.2.3. Low Awareness in Developing Countries
4.2.3. Opportunities
4.2.3.1. Expansion in Emerging Markets
4.2.3.2. Integration with Smartphone & AI Tools
4.2.3.3. Growing Applications in Cosmetic Dermatology
4.2.4. Trends
4.2.4.1. Portable and Wearable Dermoscopy Devices
4.2.4.2. Wireless and Smartphone-Compatible Technologies
4.2.4.3. Cross-polarization & Multispectral Imaging
4.2.5. Challenges
4.2.5.1. Regulatory Compliance Across Geographies
4.2.5.2. Product Standardization
4.2.5.3. Data Privacy in Connected Devices
4.3. Porter's Five Forces Analysis
4.3.1. Bargaining Power of Suppliers
4.3.2. Bargaining Power of Buyers
4.3.3. Threat of Substitutes
4.3.4. Threat of New Entrants
4.3.5. Degree of Competition
4.4. Sustainability Impact on the Dermoscopy and Skin Visualization Devices Market
4.4.1. Environmental Sustainability Factors
4.4.1.1. Energy-efficient Imaging Devices
4.4.1.2. Reduced Use of Disposable Accessories
4.4.2. Market Response to Sustainability Demands
4.4.2.1. Regulatory Compliance and Green Initiatives
4.4.2.2. Manufacturer-led Initiatives
4.4.3. Opportunities from Sustainability Focus
4.4.3.1. Eco-friendly Device Development
4.4.3.2. Challenges in Sustainable Manufacturing
5. Dermoscopy and Skin Visualization Devices Market Assessment—By Product Type
5.1. Overview
5.2. Pocket Dermoscopy Devices
5.3. Photo Dermoscopy Devices
5.4. Lumio and General Skin Visualization Scopes
5.5. Smartphone-Compatible Dermoscopy Devices
5.6. Accessories & Adapters
6. Dermoscopy and Skin Visualization Devices Market Assessment—By Technology
6.1. Overview
6.2. Polarized Light Dermoscopy
6.3. Non-Polarized Light Dermoscopy
6.4. Cross-Polarized Imaging
6.5. Ultraviolet (UV) Imaging
6.6. Hybrid & Multispectral Imaging
7. Dermoscopy and Skin Visualization Devices Market Assessment—By Application
7.1. Overview
7.2. Skin Cancer Diagnosis
7.3. Pigmented Lesion Examination
7.4. Hair and Scalp Analysis
7.5. Vascular Disorder Diagnosis
7.6. Cosmetic and Aesthetic Dermatology
7.7. Others
8. Dermoscopy and Skin Visualization Devices Market Assessment—By End User
8.1. Overview
8.2. Dermatology Clinics
8.3. Hospitals
8.4. Teledermatology Providers
8.5. Academic & Research Institutions
8.6. Home Users
9. Dermoscopy and Skin Visualization Devices Market Assessment—By Geography
9.1. Overview
9.2. North America
9.2.1. U.S.
9.2.2. Canada
9.3. Europe
9.3.1. Germany
9.3.2. U.K.
9.3.3. France
9.3.4. Italy
9.3.5. Spain
9.3.6. Rest of Europe
9.4. Asia-Pacific
9.4.1. Japan
9.4.2. China
9.4.3. India
9.4.4. Australia
9.4.5. South Korea
9.4.6. Rest of Asia-Pacific
9.5. Latin America
9.5.1. Brazil
9.5.2. Mexico
9.5.3. Rest of Latin America
9.6. Middle East & Africa
9.6.1. UAE
9.6.2. Saudi Arabia
9.6.3. South Africa
9.6.4. Rest of MEA
10. Competitive Landscape
10.1. Overview
10.2. Key Growth Strategies
10.3. Competitive Benchmarking
10.4. Competitive Dashboard
10.4.1. Industry Leaders
10.4.2. Market Differentiators
10.4.3. Vanguards
10.4.4. Contemporary Stalwarts
10.5. Market Share Analysis, by Key Players, 2024
11. Company Profiles (Business Overview, Financial Overview, Product Portfolio, Strategic Developments, and SWOT Analysis*)
11.1. FotoFinder Systems GmbH (including DermLite LLC)
11.2. Canfield Scientific, Inc.
11.3. HEINE Optotechnik GmbH & Co. KG
11.4. Baxter International Inc. (Hillrom/Welch Allyn)
11.5. AMD Global Telemedicine, Inc.
11.6. Firefly Global
11.7. AnMo Electronics Corporation (Dino-Lite)
11.8. Carl Zeiss Meditec AG
11.9. MetaOptima Technology Inc.
11.10. ILLUCO Corporation Ltd.
11.11. 3Derm Systems, Inc.
11.12. MedX Health Corp.
11.13. Caliber Imaging & Diagnostics, Inc.
11.14. SciBase Holding AB
11.15. Opticlar Vision Ltd.
11.16. Rudolf Riester GmbH
11.17. DermoScan GmbH
11.18. MAVIG GmbH
11.19. Bomtech Electronics Co., Ltd.
11.20. KaWe - Kirchner & Wilhelm GmbH + Co. KG
12. Appendix
12.1. Available Customization
12.2. Related Reports
LIST OF TABLES
Table 1. Global Dermoscopy and Skin Visualization Devices Market, by Product Type, 2023–2035 (USD Million)
Table 2. Global Pocket Dermoscopy Devices Market, by Country/Region, 2023–2035 (USD Million)
Table 3. Global Photo Dermoscopy Devices Market, by Country/Region, 2023–2035 (USD Million)
Table 4. Global Lumio and General Skin Visualization Scopes Market, by Country/Region, 2023–2035 (USD Million)
Table 5. Global Smartphone-Compatible Dermoscopy Devices Market, by Country/Region, 2023–2035 (USD Million)
Table 6. Global Accessories & Adapters Market, by Country/Region, 2023–2035 (USD Million)
Table 7. Global Dermoscopy and Skin Visualization Devices Market, by Technology, 2023–2035 (USD Million)
Table 8. Global Polarized Light Dermoscopy Market, by Country/Region, 2023–2035 (USD Million)
Table 9. Global Non-Polarized Light Dermoscopy Market, by Country/Region, 2023–2035 (USD Million)
Table 10. Global Cross-Polarized Imaging Market, by Country/Region, 2023–2035 (USD Million)
Table 11. Global Ultraviolet (UV) Imaging Market, by Country/Region, 2023–2035 (USD Million)
Table 12. Global Hybrid & Multispectral Imaging Market, by Country/Region, 2023–2035 (USD Million)
Table 13. Global Dermoscopy and Skin Visualization Devices Market, by Application, 2023–2035 (USD Million)
Table 14. Global Dermoscopy and Skin Visualization Devices Market for Skin Cancer Diagnosis, by Country/Region, 2023–2035 (USD Million)
Table 15. Global Dermoscopy and Skin Visualization Devices Market for Pigmented Lesion Examination, by Country/Region, 2023–2035 (USD Million)
Table 16. Global Dermoscopy and Skin Visualization Devices Market for Hair and Scalp Analysis, by Country/Region, 2023–2035 (USD Million)
Table 17. Global Dermoscopy and Skin Visualization Devices Market for Vascular Disorder Diagnosis, by Country/Region, 2023–2035 (USD Million)
Table 18. Global Dermoscopy and Skin Visualization Devices Market for Cosmetic and Aesthetic Dermatology, by Country/Region, 2023–2035 (USD Million)
Table 19. Global Dermoscopy and Skin Visualization Devices Market for other Applications, by Country/Region, 2023–2035 (USD Million)
Table 20. Global Dermoscopy and Skin Visualization Devices Market, by End User, 2023–2035 (USD Million)
Table 21. Global Dermoscopy and Skin Visualization Devices Market for Dermatology Clinics, by Country/Region, 2023–2035 (USD Million)
Table 22. Global Dermoscopy and Skin Visualization Devices Market for Hospitals, by Country/Region, 2023–2035 (USD Million)
Table 23. Global Dermoscopy and Skin Visualization Devices Market for Teledermatology Providers, by Country/Region, 2023–2035 (USD Million)
Table 24. Global Dermoscopy and Skin Visualization Devices Market for Academic & Research Institutions, by Country/Region, 2023–2035 (USD Million)
Table 25. Global Dermoscopy and Skin Visualization Devices Market for Home Users, by Country/Region, 2023–2035 (USD Million)
Table 26. North America: Dermoscopy and Skin Visualization Devices Market, by Product Type, 2023–2035 (USD Million)
Table 27. North America: Dermoscopy and Skin Visualization Devices Market, by Technology, 2023–2035 (USD Million)
Table 28. North America: Dermoscopy and Skin Visualization Devices Market, by Application, 2023–2035 (USD Million)
Table 29. North America: Dermoscopy and Skin Visualization Devices Market, by End User, 2023–2035 (USD Million)
Table 30. U.S.: Dermoscopy and Skin Visualization Devices Market, by Product Type, 2023–2035 (USD Million)
Table 31. U.S.: Dermoscopy and Skin Visualization Devices Market, by Technology, 2023–2035 (USD Million)
Table 32. U.S.: Dermoscopy and Skin Visualization Devices Market, by Application, 2023–2035 (USD Million)
Table 33. U.S.: Dermoscopy and Skin Visualization Devices Market, by End User, 2023–2035 (USD Million)
Table 34. Canada: Dermoscopy and Skin Visualization Devices Market, by Product Type, 2023–2035 (USD Million)
Table 35. Canada: Dermoscopy and Skin Visualization Devices Market, by Technology, 2023–2035 (USD Million)
Table 36. Canada: Dermoscopy and Skin Visualization Devices Market, by Application, 2023–2035 (USD Million)
Table 37. Canada: Dermoscopy and Skin Visualization Devices Market, by End User, 2023–2035 (USD Million)
Table 38. Europe: Dermoscopy and Skin Visualization Devices Market, by Product Type, 2023–2035 (USD Million)
Table 39. Europe: Dermoscopy and Skin Visualization Devices Market, by Technology, 2023–2035 (USD Million)
Table 40. Europe: Dermoscopy and Skin Visualization Devices Market, by Application, 2023–2035 (USD Million)
Table 41. Europe: Dermoscopy and Skin Visualization Devices Market, by End User, 2023–2035 (USD Million)
Table 42. Germany: Dermoscopy and Skin Visualization Devices Market, by Product Type, 2023–2035 (USD Million)
Table 43. Germany: Dermoscopy and Skin Visualization Devices Market, by Technology, 2023–2035 (USD Million)
Table 44. Germany: Dermoscopy and Skin Visualization Devices Market, by Application, 2023–2035 (USD Million)
Table 45. Germany: Dermoscopy and Skin Visualization Devices Market, by End User, 2023–2035 (USD Million)
Table 46. U.K.: Dermoscopy and Skin Visualization Devices Market, by Product Type, 2023–2035 (USD Million)
Table 47. U.K.: Dermoscopy and Skin Visualization Devices Market, by Technology, 2023–2035 (USD Million)
Table 48. U.K.: Dermoscopy and Skin Visualization Devices Market, by Application, 2023–2035 (USD Million)
Table 49. U.K.: Dermoscopy and Skin Visualization Devices Market, by End User, 2023–2035 (USD Million)
Table 50. France: Dermoscopy and Skin Visualization Devices Market, by Product Type, 2023–2035 (USD Million)
Table 51. France: Dermoscopy and Skin Visualization Devices Market, by Technology, 2023–2035 (USD Million)
Table 52. France: Dermoscopy and Skin Visualization Devices Market, by Application, 2023–2035 (USD Million)
Table 53. France: Dermoscopy and Skin Visualization Devices Market, by End User, 2023–2035 (USD Million)
Table 54. Italy: Dermoscopy and Skin Visualization Devices Market, by Product Type, 2023–2035 (USD Million)
Table 55. Italy: Dermoscopy and Skin Visualization Devices Market, by Technology, 2023–2035 (USD Million)
Table 56. Italy: Dermoscopy and Skin Visualization Devices Market, by Application, 2023–2035 (USD Million)
Table 57. Italy: Dermoscopy and Skin Visualization Devices Market, by End User, 2023–2035 (USD Million)
Table 58. Spain: Dermoscopy and Skin Visualization Devices Market, by Product Type, 2023–2035 (USD Million)
Table 59. Spain: Dermoscopy and Skin Visualization Devices Market, by Technology, 2023–2035 (USD Million)
Table 60. Spain: Dermoscopy and Skin Visualization Devices Market, by Application, 2023–2035 (USD Million)
Table 61. Spain: Dermoscopy and Skin Visualization Devices Market, by End User, 2023–2035 (USD Million)
Table 62. Rest of Europe: Dermoscopy and Skin Visualization Devices Market, by Product Type, 2023–2035 (USD Million)
Table 63. Rest of Europe: Dermoscopy and Skin Visualization Devices Market, by Technology, 2023–2035 (USD Million)
Table 64. Rest of Europe: Dermoscopy and Skin Visualization Devices Market, by Application, 2023–2035 (USD Million)
Table 65. Rest of Europe: Dermoscopy and Skin Visualization Devices Market, by End User, 2023–2035 (USD Million)
Table 66. Asia-Pacific: Dermoscopy and Skin Visualization Devices Market, by Product Type, 2023–2035 (USD Million)
Table 67. Asia-Pacific: Dermoscopy and Skin Visualization Devices Market, by Technology, 2023–2035 (USD Million)
Table 68. Asia-Pacific: Dermoscopy and Skin Visualization Devices Market, by Application, 2023–2035 (USD Million)
Table 69. Asia-Pacific: Dermoscopy and Skin Visualization Devices Market, by End User, 2023–2035 (USD Million)
Table 70. Japan: Dermoscopy and Skin Visualization Devices Market, by Product Type, 2023–2035 (USD Million)
Table 71. Japan: Dermoscopy and Skin Visualization Devices Market, by Technology, 2023–2035 (USD Million)
Table 72. Japan: Dermoscopy and Skin Visualization Devices Market, by Application, 2023–2035 (USD Million)
Table 73. Japan: Dermoscopy and Skin Visualization Devices Market, by End User, 2023–2035 (USD Million)
Table 74. China: Dermoscopy and Skin Visualization Devices Market, by Product Type, 2023–2035 (USD Million)
Table 75. China: Dermoscopy and Skin Visualization Devices Market, by Technology, 2023–2035 (USD Million)
Table 76. China: Dermoscopy and Skin Visualization Devices Market, by Application, 2023–2035 (USD Million)
Table 77. China: Dermoscopy and Skin Visualization Devices Market, by End User, 2023–2035 (USD Million)
Table 78. India: Dermoscopy and Skin Visualization Devices Market, by Product Type, 2023–2035 (USD Million)
Table 79. India: Dermoscopy and Skin Visualization Devices Market, by Technology, 2023–2035 (USD Million)
Table 80. India: Dermoscopy and Skin Visualization Devices Market, by Application, 2023–2035 (USD Million)
Table 81. India: Dermoscopy and Skin Visualization Devices Market, by End User, 2023–2035 (USD Million)
Table 82. Australia: Dermoscopy and Skin Visualization Devices Market, by Product Type, 2023–2035 (USD Million)
Table 83. Australia: Dermoscopy and Skin Visualization Devices Market, by Technology, 2023–2035 (USD Million)
Table 84. Australia: Dermoscopy and Skin Visualization Devices Market, by Application, 2023–2035 (USD Million)
Table 85. Australia: Dermoscopy and Skin Visualization Devices Market, by End User, 2023–2035 (USD Million)
Table 86. South Korea: Dermoscopy and Skin Visualization Devices Market, by Product Type, 2023–2035 (USD Million)
Table 87. South Korea: Dermoscopy and Skin Visualization Devices Market, by Technology, 2023–2035 (USD Million)
Table 88. South Korea: Dermoscopy and Skin Visualization Devices Market, by Application, 2023–2035 (USD Million)
Table 89. South Korea: Dermoscopy and Skin Visualization Devices Market, by End User, 2023–2035 (USD Million)
Table 90. Rest of Asia-Pacific: Dermoscopy and Skin Visualization Devices Market, by Product Type, 2023–2035 (USD Million)
Table 91. Rest of Asia-Pacific: Dermoscopy and Skin Visualization Devices Market, by Technology, 2023–2035 (USD Million)
Table 92. Rest of Asia-Pacific: Dermoscopy and Skin Visualization Devices Market, by Application, 2023–2035 (USD Million)
Table 93. Rest of Asia-Pacific: Dermoscopy and Skin Visualization Devices Market, by End User, 2023–2035 (USD Million)
Table 94. Latin America: Dermoscopy and Skin Visualization Devices Market, by Product Type, 2023–2035 (USD Million)
Table 95. Latin America: Dermoscopy and Skin Visualization Devices Market, by Technology, 2023–2035 (USD Million)
Table 96. Latin America: Dermoscopy and Skin Visualization Devices Market, by Application, 2023–2035 (USD Million)
Table 97. Latin America: Dermoscopy and Skin Visualization Devices Market, by End User, 2023–2035 (USD Million)
Table 98. Brazil: Dermoscopy and Skin Visualization Devices Market, by Product Type, 2023–2035 (USD Million)
Table 99. Brazil: Dermoscopy and Skin Visualization Devices Market, by Technology, 2023–2035 (USD Million)
Table 100. Brazil: Dermoscopy and Skin Visualization Devices Market, by Application, 2023–2035 (USD Million)
Table 101. Brazil: Dermoscopy and Skin Visualization Devices Market, by End User, 2023–2035 (USD Million)
Table 102. Mexico: Dermoscopy and Skin Visualization Devices Market, by Product Type, 2023–2035 (USD Million)
Table 103. Mexico: Dermoscopy and Skin Visualization Devices Market, by Technology, 2023–2035 (USD Million)
Table 104. Mexico: Dermoscopy and Skin Visualization Devices Market, by Application, 2023–2035 (USD Million)
Table 105. Mexico: Dermoscopy and Skin Visualization Devices Market, by End User, 2023–2035 (USD Million)
Table 106. Rest of Latin America: Dermoscopy and Skin Visualization Devices Market, by Product Type, 2023–2035 (USD Million)
Table 107. Rest of Latin America: Dermoscopy and Skin Visualization Devices Market, by Technology, 2023–2035 (USD Million)
Table 108. Rest of Latin America: Dermoscopy and Skin Visualization Devices Market, by Application, 2023–2035 (USD Million)
Table 109. Rest of Latin America: Dermoscopy and Skin Visualization Devices Market, by End User, 2023–2035 (USD Million)
Table 110. Middle East & Africa: Dermoscopy and Skin Visualization Devices Market, by Product Type, 2023–2035 (USD Million)
Table 111. Middle East & Africa: Dermoscopy and Skin Visualization Devices Market, by Technology, 2023–2035 (USD Million)
Table 112. Middle East & Africa: Dermoscopy and Skin Visualization Devices Market, by Application, 2023–2035 (USD Million)
Table 113. Middle East & Africa: Dermoscopy and Skin Visualization Devices Market, by End User, 2023–2035 (USD Million)
Table 114. UAE: Dermoscopy and Skin Visualization Devices Market, by Product Type, 2023–2035 (USD Million)
Table 115. UAE: Dermoscopy and Skin Visualization Devices Market, by Technology, 2023–2035 (USD Million)
Table 116. UAE: Dermoscopy and Skin Visualization Devices Market, by Application, 2023–2035 (USD Million)
Table 117. UAE: Dermoscopy and Skin Visualization Devices Market, by End User, 2023–2035 (USD Million)
Table 118. Saudi Arabia: Dermoscopy and Skin Visualization Devices Market, by Product Type, 2023–2035 (USD Million)
Table 119. Saudi Arabia: Dermoscopy and Skin Visualization Devices Market, by Technology, 2023–2035 (USD Million)
Table 120. Saudi Arabia: Dermoscopy and Skin Visualization Devices Market, by Application, 2023–2035 (USD Million)
Table 121. Saudi Arabia: Dermoscopy and Skin Visualization Devices Market, by End User, 2023–2035 (USD Million)
Table 122. South Africa: Dermoscopy and Skin Visualization Devices Market, by Product Type, 2023–2035 (USD Million)
Table 123. South Africa: Dermoscopy and Skin Visualization Devices Market, by Technology, 2023–2035 (USD Million)
Table 124. South Africa: Dermoscopy and Skin Visualization Devices Market, by Application, 2023–2035 (USD Million)
Table 125. South Africa: Dermoscopy and Skin Visualization Devices Market, by End User, 2023–2035 (USD Million)
Table 126. Rest of Middle East & Africa: Dermoscopy and Skin Visualization Devices Market, by Product Type, 2023–2035 (USD Million)
Table 127. Rest of Middle East & Africa: Dermoscopy and Skin Visualization Devices Market, by Technology, 2023–2035 (USD Million)
Table 128. Rest of Middle East & Africa: Dermoscopy and Skin Visualization Devices Market, by Application, 2023–2035 (USD Million)
Table 129. Rest of Middle East & Africa: Dermoscopy and Skin Visualization Devices Market, by End User, 2023–2035 (USD Million)
LIST OF FIGURES
Figure 1. Research Process
Figure 2. Secondary Components Referenced for This Study
Figure 3. Primary Research Techniques
Figure 4. Key Executives Interviewed
Figure 5. Breakdown of Primary Interviews (Supply Side & Demand Side)
Figure 6. Market Sizing and Growth Forecast Approach
Figure 7. In 2025, the Photo Dermoscopy Devices to Account for the Largest Share
Figure 8. In 2025, the Polarized Light Dermoscopy Technology to Account for the Largest Share
Figure 9. In 2025, the Skin Cancer Diagnosis Application to Account for the Largest Share
Figure 10. In 2025, the Dermatology Clinics End User to Account for the Largest Share
Figure 11. North America to be the Largest Regional Market
Figure 12. Impact Analysis of Market Dynamics
Figure 13. Global Dermoscopy and Skin Visualization Devices Market: Porter's Five Forces Analysis
Figure 14. Global Dermoscopy and Skin Visualization Devices Market, by Product Type, 2025 Vs. 2032 (USD Million)
Figure 15. Global Dermoscopy and Skin Visualization Devices Market, by Technology, 2025 Vs. 2032 (USD Million)
Figure 16. Global Dermoscopy and Skin Visualization Devices Market, by Application, 2025 Vs. 2032 (USD Million)
Figure 17. Global Dermoscopy and Skin Visualization Devices Market, by End User, 2025 Vs. 2032 (USD Million)
Figure 18. Global Dermoscopy and Skin Visualization Devices Market, by Region, 2025 Vs. 2032 (USD Million)
Figure 19. North America: Dermoscopy and Skin Visualization Devices Market Snapshot (2025)
Figure 20. Europe: Dermoscopy and Skin Visualization Devices Market Snapshot (2025)
Figure 21. Asia-Pacific: Dermoscopy and Skin Visualization Devices Market Snapshot (2025)
Figure 22. Latin America: Dermoscopy and Skin Visualization Devices Market Snapshot (2025)
Figure 23. Middle East & Africa: Dermoscopy and Skin Visualization Devices Market Snapshot (2025)
Figure 24. Key Growth Strategies Adopted by Leading Players (2022–2025)
Figure 25. Global Dermoscopy and Skin Visualization Devices Market Competitive Benchmarking, by Product Type
Figure 26. Competitive Dashboard: Global Dermoscopy and Skin Visualization Devices Market
Figure 27. Global Dermoscopy and Skin Visualization Devices Market Share/Ranking, by Key Player, 2024 (%)


Published Date: Apr-2025
Published Date: Jan-2025
Subscribe to get the latest industry updates