Resources
About Us
Automated Material Handling Systems (AMHS) Market by Offering (Product [AGVs, AMRs, ASRS, Conveyor & Sortation, Palletizing/Depalletizing, Robotic Systems, RGVs, Service, Component, Function, End-use Industry, and by Geography – Global Forecast to 2036
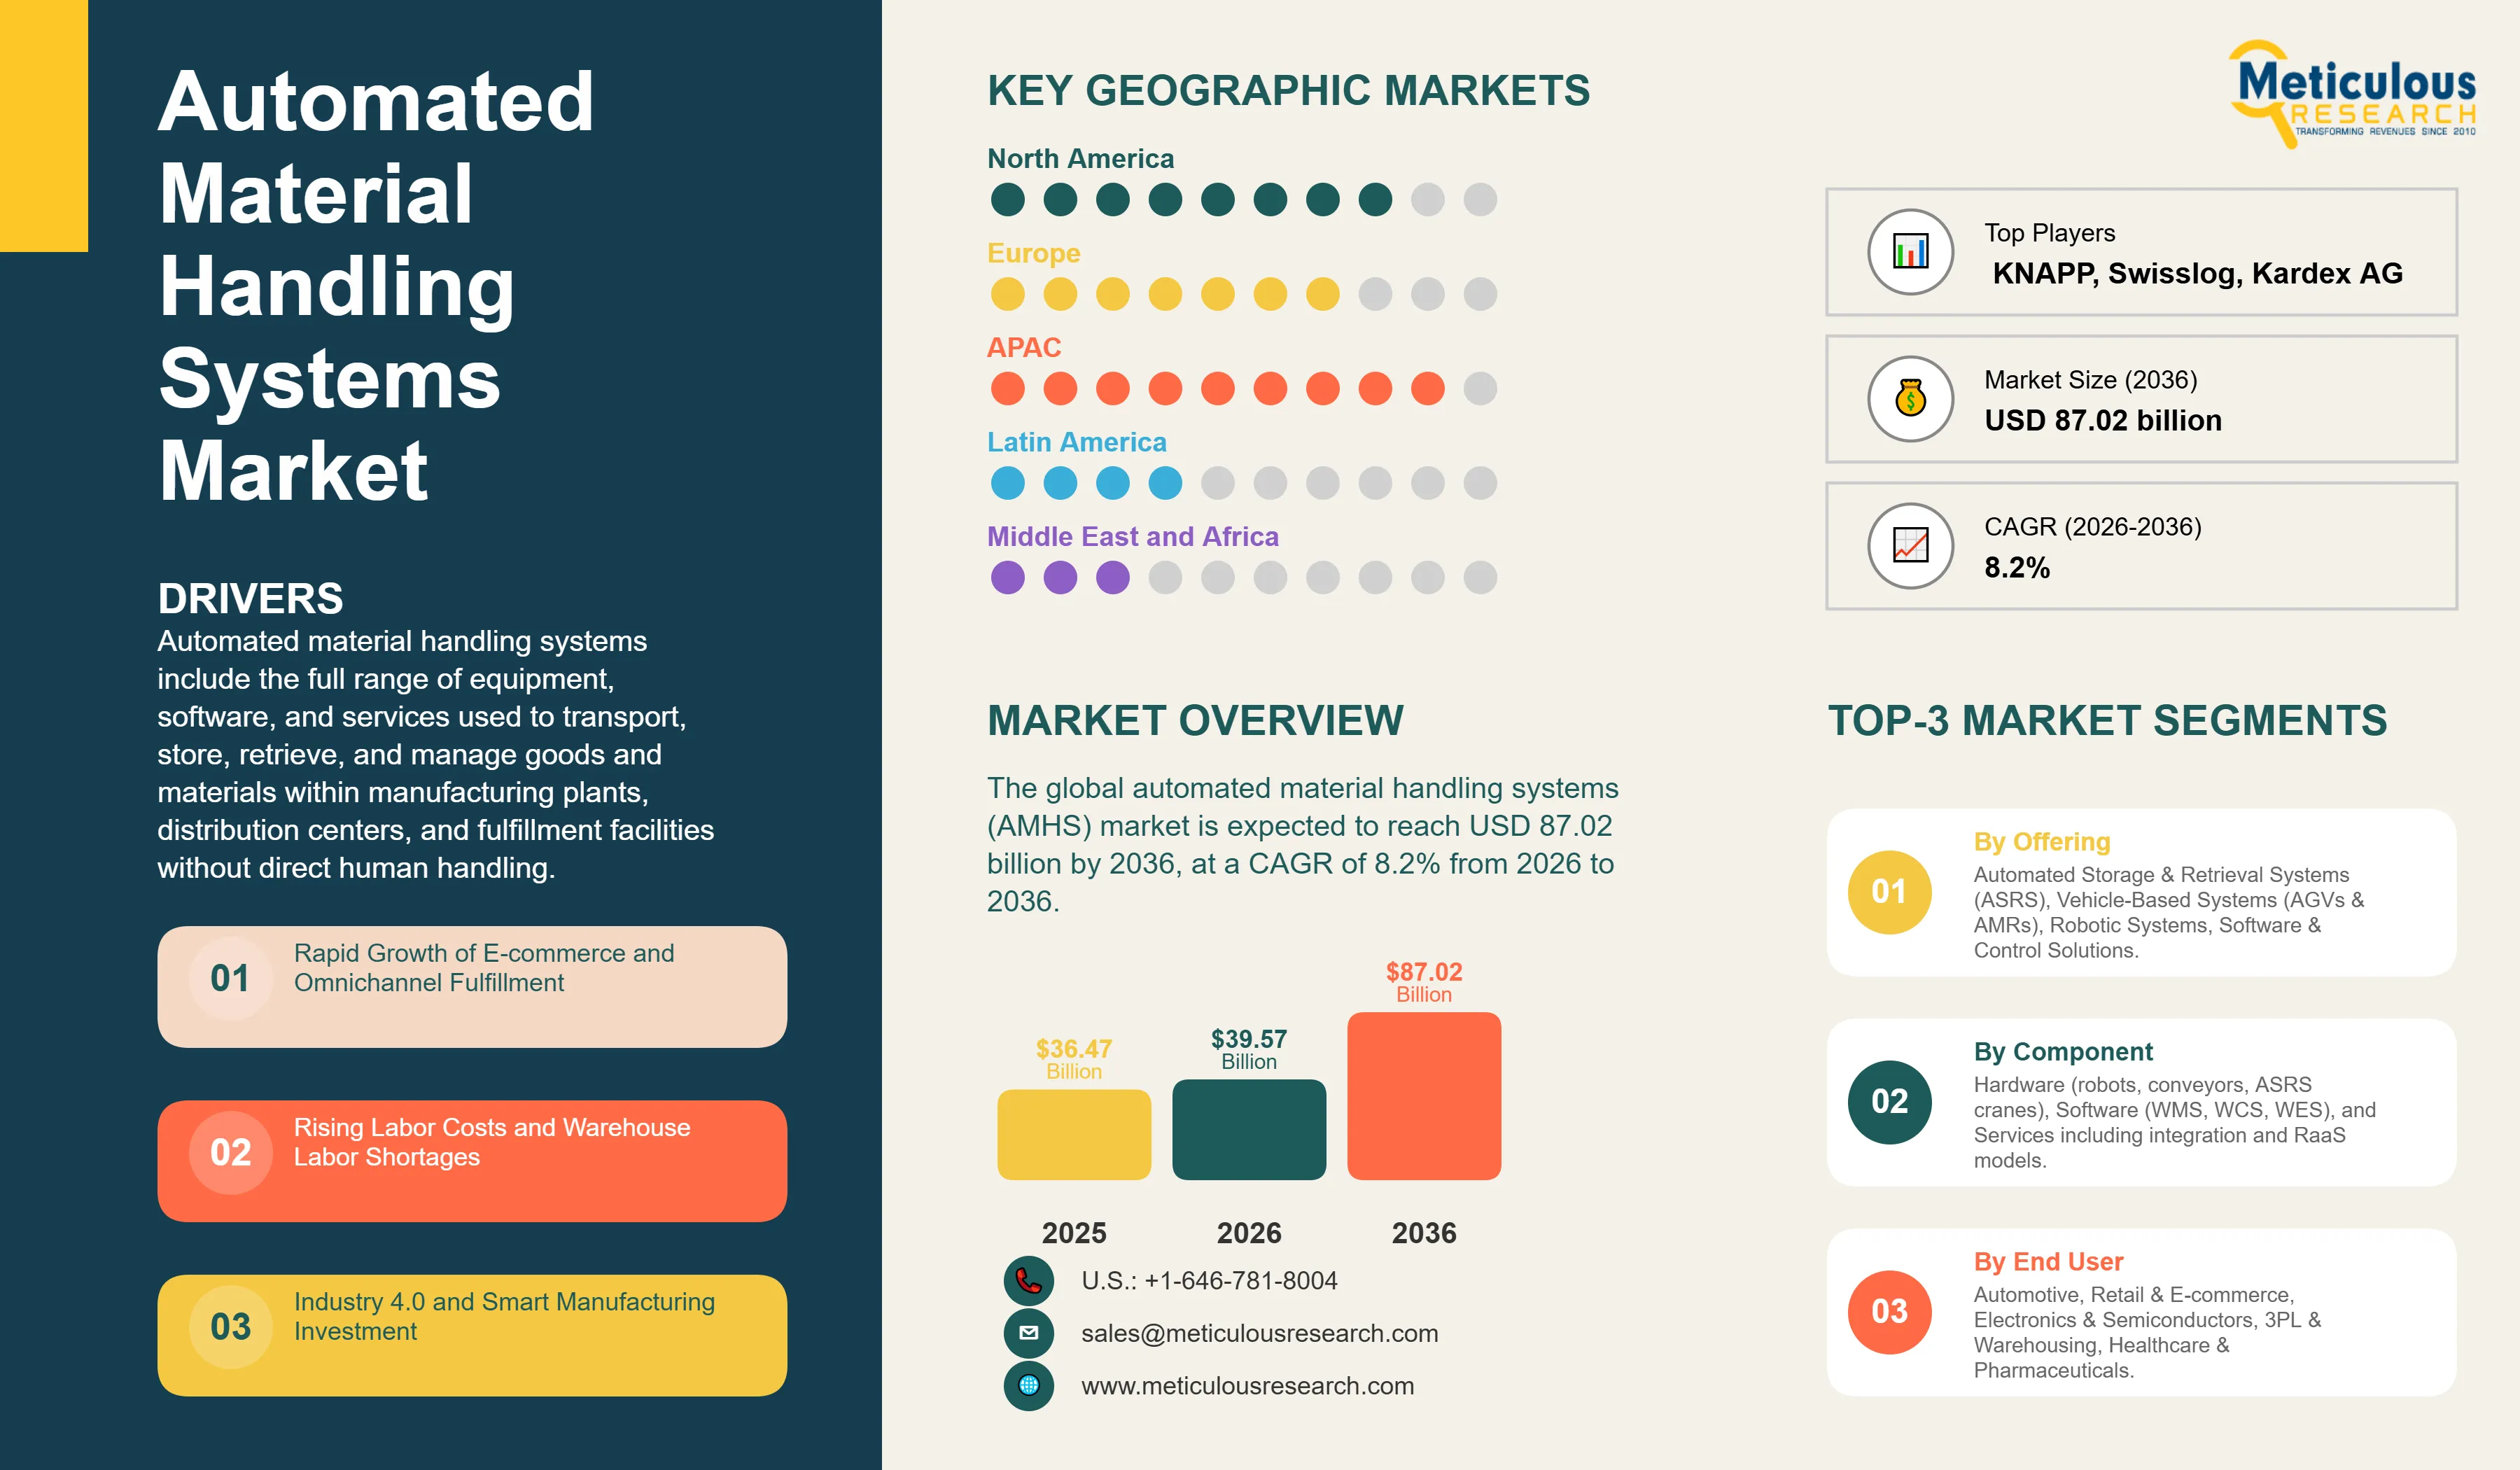
Report ID: MRICT - 104453 Pages: 450 Feb-2026 Formats*: PDF Category: Information and Communications Technology Delivery: 24 to 72 Hours Download Free Sample ReportThe global automated material handling systems (AMHS) market was valued at USD 36.47 billion in 2025. This market is expected to reach USD 87.02 billion by 2036 from USD 39.57 billion in 2026, at a CAGR of 8.2% from 2026 to 2036.
Automated material handling systems include the full range of equipment, software, and services used to transport, store, retrieve, and manage goods and materials within manufacturing plants, distribution centers, and fulfillment facilities without direct human handling. The market includes automated storage and retrieval systems (ASRS), autonomous mobile robots (AMRs), automated guided vehicles (AGVs), conveyor and sortation systems, palletizing and depalletizing systems, robotic systems, and rail-guided vehicles, as well as the software platforms (WMS, WCS, WES), system integration services, and after-sales managed services, including the emerging robotics-as-a-service (RaaS) model, that enable their deployment and operation.
The growth of this market is driven by the rapid expansion of global e-commerce requiring high-throughput, high-accuracy fulfillment operations, structural shortages of warehouse labor across North America, Europe, and parts of Asia-Pacific, rising wages and workplace safety compliance costs making automation economics increasingly compelling, and accelerating investment in Industry 4.0 smart manufacturing infrastructure. The growing shift from AGVs to flexible AMRs, the emergence of subscription and outcome-based RaaS models lowering the capital barrier for smaller operators, and the integration of AI-powered fleet orchestration and digital twin technologies are creating significant growth opportunities across all geographies.
Click here to: Get Free Sample Pages of this Report
Transition from AGVs to AMRs as the Dominant Mobile Robot Platform
One of the most significant trends driving the AMHS market is the rapid displacement of traditional automated guided vehicles (AGVs) by autonomous mobile robots (AMRs). AGVs rely on fixed infrastructure, magnetic tape, laser reflectors, or inductive wire embedded in the facility floor, that is expensive to install, difficult to reconfigure, and unable to adapt dynamically to changing operational requirements. AMRs, by contrast, use AI-based simultaneous localization and mapping (SLAM) navigation combined with onboard LiDAR, cameras, and sensor fusion to operate in unstructured, dynamic environments without fixed infrastructure, enabling deployment within hours and incremental scaling of fleets.
AMRs are the dominant growth vector in mobile robotics, with the growing adoption across e-commerce, third-party logistics, and general manufacturing. Leading AMR providers, including Locus Robotics and Geekplus, have collectively deployed tens of thousands of units globally, with Locus Robotics recently surpassing 6 billion picks worldwide, achieving its last billion picks in just 24 weeks, and reporting 30–40% year-over-year volume growth in 2025. Geekplus has shipped over 56,000 AMRs globally as of mid-2025 and retains its position as the No.1 global AMR provider.
The transition is driving rapid growth in the goods-to-person (G2P) fulfillment architecture, where AMR-based systems deliver storage pods or totes directly to stationary picking stations, reducing picker walking distances by over 60% and achieving order accuracy rates exceeding 99.9%.
Emergence and Rapid Expansion of Robotics-as-a-Service (RaaS)
The emergence of subscription-based and outcome-based RaaS business models represents a fundamental structural shift in how AMHS capacity is acquired and deployed. Under traditional capital purchase models, the total cost of a comprehensive automated fulfillment center, including ASRS infrastructure, conveyor and sortation systems, software, and integration, can range from tens to hundreds of millions of dollars, limiting adoption to large enterprises with substantial capital budgets.
RaaS structures allow operators to contract for automation capacity on a per-pick, per-pallet, per-mile, or flat monthly subscription basis, converting capital expenditure to operating expenditure and enabling seasonal scaling that matches automation capacity to demand. Leading RaaS providers such as Locus Robotics, Geekplus, and Hai Robotics have deployed thousands of AMRs under subscription arrangements across e-commerce, 3PL, and retail distribution customers, while traditional system integrators such as Körber, TGW, and Dematic are expanding their managed services and RaaS offerings. The RaaS segment is the primary driver of AMHS market expansion beyond the large-enterprise customer base.
Integration of AI, Digital Twin, and Predictive Analytics
The integration of artificial intelligence, digital twin simulation, and predictive analytics is transforming AMHS from hardware-centric capital procurement into software-defined operational infrastructure. AI-powered fleet orchestration systems dynamically allocate robot tasks, optimize travel routes, manage battery charging cycles, and coordinate interactions between heterogeneous fleets of AMRs, AGVs, and ASRS systems in real time. Predictive maintenance platforms analyze sensor data from conveyors, cranes, sorters, and robotic actuators to anticipate failures days in advance, reducing unplanned downtime.
Digital twin platforms enable warehouse operators to simulate facility layouts, stress-test operations under peak demand scenarios, and optimize system configurations prior to physical deployment, substantially reducing commissioning risk and time-to-productivity. Industry case studies indicate warehouse efficiency can rise by 20–25% through digital twin applications, while predictive maintenance models can reduce conveyor downtime, which averages 5–8% annually, by 20–30%. Daifuku, Honeywell Intelligrated, and Dematic have similarly developed proprietary IoT analytics platforms that integrate with enterprise WMS systems to provide unified operational visibility, supporting the progression toward fully autonomous, lights-out fulfillment operations.
The global automated material handling systems (AMHS) market was valued at USD 36.47 billion in 2025. This market is expected to reach USD 87.02 billion by 2036 from USD 39.57 billion in 2026, at a CAGR of 8.2% from 2026 to 2036.
|
Report Coverage |
Details |
|
Market Size by 2036 |
USD 87.02 Billion |
|
Market Size in 2026 |
USD 39.57 Billion |
|
Market Size in 2025 |
USD 36.47 Billion |
|
Market Growth Rate from 2025 to 2032 |
CAGR of 8.2% |
|
Dominating Region |
Asia-Pacific |
|
Fastest Growing Region |
Asia-Pacific |
|
Base Year |
2025 |
|
Forecast Period |
2026 to 2036 |
|
Segments Covered |
Offering, Component, Function, End-use Industry, and Region |
|
Regions Covered |
North America, Europe, Asia-Pacific, Latin America, and Middle East & Africa |
Rapid Growth of E-commerce and Omnichannel Fulfillment Requirements
The rapid growth of the global e-commerce industry is the primary driver of the growth of the overall AMHS market, creating demand for fulfillment infrastructure that can process high volumes of multi-SKU orders with next-day or same-day delivery commitments at unit economics that manual operations cannot achieve. Global retail e-commerce sales are projected to reach USD 8 trillion by 2028, requiring continuous expansion and automation of fulfillment capacity across all geographies.
Unlike traditional retail replenishment models in which large, uniform pallet loads are shipped to stores on predictable schedules, e-commerce fulfillment requires picking and packing millions of individual multi-item orders daily, each with unique content and a delivery commitment measured in hours rather than days. Leading automated fulfillment centers process over 100,000 orders per day with accuracy rates exceeding 99.9%, while comparable manual operations would require thousands of additional staff and could not achieve equivalent throughput or accuracy. Thus, the growth of marketplace fulfillment models, omnichannel inventory visibility requirements, and returns processing volume are further driving the omnichannel fulfillment requirements.
Expansion of Healthcare, Pharmaceutical, and Cold Chain Automation
The healthcare and pharmaceutical end-use segment is the fastest-growing application for AMHS globally, driven by regulatory, operational, and capacity pressures that make manual handling increasingly untenable. Drug serialization and track-and-trace compliance requirements across major regulatory jurisdictions such as the U.S. Drug Supply Chain Security Act (DSCSA), EU Falsified Medicines Directive, and equivalent national regulations in Japan, China, and India mandate unit-level identification and documentation of pharmaceutical products throughout the supply chain. This is creating a growing need for automated handling systems that can process serialized items at scale without error.
Cold chain integrity requirements for biologics, vaccines, cell and gene therapies, and temperature-sensitive specialty pharmaceuticals are driving investment in automated storage and retrieval systems optimized for controlled-temperature environments, where human access must be minimized to maintain temperature stability and reduce energy consumption. Hospital and healthcare facility automation is growing through deployment of automated pharmacy dispensing systems, robotic medication carts, autonomous transport vehicles for sterile supply and laboratory specimen delivery, and ASRS-based central sterile processing.
What Drives the Dominance of the Robotic Systems Segment?
The Robotic Systems segment, including palletizing & depalletizing robots, piece-picking and vision-guided robotic systems, and collaborative robots, is expected to account for the largest share of the global Automated Material Handling Systems (AMHS) market in 2026.
The large market share of this segment is primarily attributed to the extensive deployment of robotic handling platforms across automotive manufacturing facilities, electronics production plants, and third-party logistics (3PL) fulfillment centers. In most large-scale AMHS implementations, robotic systems are deployed as the primary automation layer for pallet movement, component transfer, and item-level picking operations. These installations frequently determine the operational scope of subsequent investments in storage infrastructure, vehicle-based transport systems, and warehouse control software.
In contrast, the Software & Control Solutions segment is projected to grow at the fastest CAGR during the forecast period. The increasing adoption of subscription-based automation deployment models, including Robotics-as-a-Service (RaaS), is enabling end users to implement AMHS solutions without incurring significant upfront capital expenditure. In addition, software-enabled services such as predictive maintenance, performance monitoring, and fleet optimization are supporting the transition toward lifecycle-based automation management across warehouse and industrial environments.
Why Are Vehicle-Based Systems Expected to Register the Highest Growth?
The Vehicle-Based Systems segment, comprising Automated Guided Vehicles (AGVs), Autonomous Mobile Robots (AMRs), and Rail-Guided Vehicles (RGVs), is expected to grow at the fastest CAGR during the forecast period.
Growth in this segment is primarily driven by the increasing deployment of AMRs across e-commerce fulfillment centers, contract logistics warehouses, and manufacturing facilities undergoing brownfield automation upgrades. Compared to conventional AGV platforms that require predefined navigation infrastructure, AMRs utilize onboard sensing technologies and software-based path planning to operate within dynamic warehouse environments. This reduces installation complexity and supports phased automation implementation without extensive facility reconfiguration.
How Does the Order Picking & Kitting Segment Lead the AMHS Market by Function?
The Order Picking & Kitting segment is expected to account for the largest share of the AMHS market by function in 2026. The significant contribution of this segment is attributed to the high labor intensity and operational variability associated with manual picking processes across warehouse and distribution center operations.
The Order Picking & Kitting segment is also projected to register the highest CAGR during the forecast period, supported by ongoing advancements in robotic picking systems integrated with machine vision and AI-assisted object recognition technologies.
How Does the Automotive Industry Contribute to AMHS Market Leadership?
The Automotive segment is expected to account for the largest share of the global AMHS market in 2026. The extensive use of automated material handling solutions across vehicle assembly plants, stamping facilities, and powertrain manufacturing operations is driving the adoption of AMHS technologies within the automotive industry. Automotive manufacturing facilities typically deploy a combination of high-capacity ASRS installations, AGV-based assembly line feeding systems, robotic transport units for component handling, and automated finished goods storage solutions to support production continuity and minimize manual intervention.
The Healthcare & Pharmaceuticals segment is projected to grow at the fastest CAGR during the forecast period. Growth in this segment is driven by increasing automation requirements for serialized pharmaceutical products, temperature-controlled storage environments, and hospital inventory logistics systems.
U.S. Automated Material Handling Systems Market Size and Growth 2025 to 2032
The U.S. automated material handling systems market is projected to grow at a CAGR of 7.4% from 2026 to 2036.
How is Asia-Pacific Maintaining Dominance in the Global AMHS Market?
Asia-Pacific dominates the global AMHS market in 2026 and is expected to register the fastest CAGR during the forecast period. This is mainly attributed to the concentration of global manufacturing capacity in China, Japan, South Korea, and Southeast Asia; the massive scale of China's e-commerce fulfillment infrastructure investment led by Alibaba (Cainiao), JD.com, and Pinduoduo; Japan's leadership in industrial automation through global AMHS vendors Daifuku and Murata Machinery; South Korea's dominant position in semiconductor and electronics manufacturing requiring high-specification AMHS; and India's rapidly expanding logistics infrastructure investment.
North America is the second-largest regional market, driven by e-commerce fulfillment investment by Amazon, Walmart, Target, and major 3PLs; labor market tightness that makes automation economics among the most compelling in the world; and the expansion of semiconductor and advanced manufacturing capacity driven by the CHIPS Act.
The global AMHS market is valued at USD 36.47 billion in 2025, estimated at USD 39.57 billion in 2026, and is projected to reach USD 87.02 billion by 2036.
The global AMHS market is expected to grow at a CAGR of 8.2% from 2026 to 2036.
The major players in the AMHS market include Daifuku Co., Ltd., SSI SCHÄFER AG, Dematic Corp. (KION GROUP AG), Honeywell Intelligrated, Toyota Industries Corporation, KNAPP AG, TGW Logistics Group GmbH, Körber AG, Murata Machinery, Ltd., Swisslog (KUKA AG), WITRON Logistik + Informatik GmbH, Kardex AG, Jungheinrich AG, Mobile Industrial Robots (MiR), BEUMER Group GmbH & Co. KG, E80 GROUP S.p.A., System Logistics S.p.A., Lödige Industries GmbH, and Stöcklin Logistik AG, among others.
The key factors driving the AMHS market include rapid growth of global e-commerce and omnichannel fulfillment requirements, structural labor shortages and rising wages in warehouse operations across major economies, Industry 4.0 and smart manufacturing investment programs globally, rising floor space utilization pressures driving demand for high-density automated storage, growing adoption of AMRs enabled by AI-based navigation technology, expanding RaaS models lowering the adoption barrier for smaller operators, and accelerating investment in semiconductor and advanced manufacturing facilities requiring cleanroom-compatible AMHS.
The Asia-Pacific region will lead the global automated material handling systems market during the forecast period 2026 to 2036.


Published Date: Jan-2024
Published Date: Sep-2024
Please enter your corporate email id here to view sample report.
Subscribe to get the latest industry updates