Resources
About Us
3D Sensing and Imaging Market Size, Share, Forecast, & Trends Analysis by Type (3D Sensing, 3D Imaging), Technology (LiDAR, Time-of-Flight, Structured Light), Application (Security & Surveillance, Industrial Automation, Medical Imaging), End-use Industry (Consumer Electronics, Automotive, Healthcare), and Geography — Global Forecast to 2036
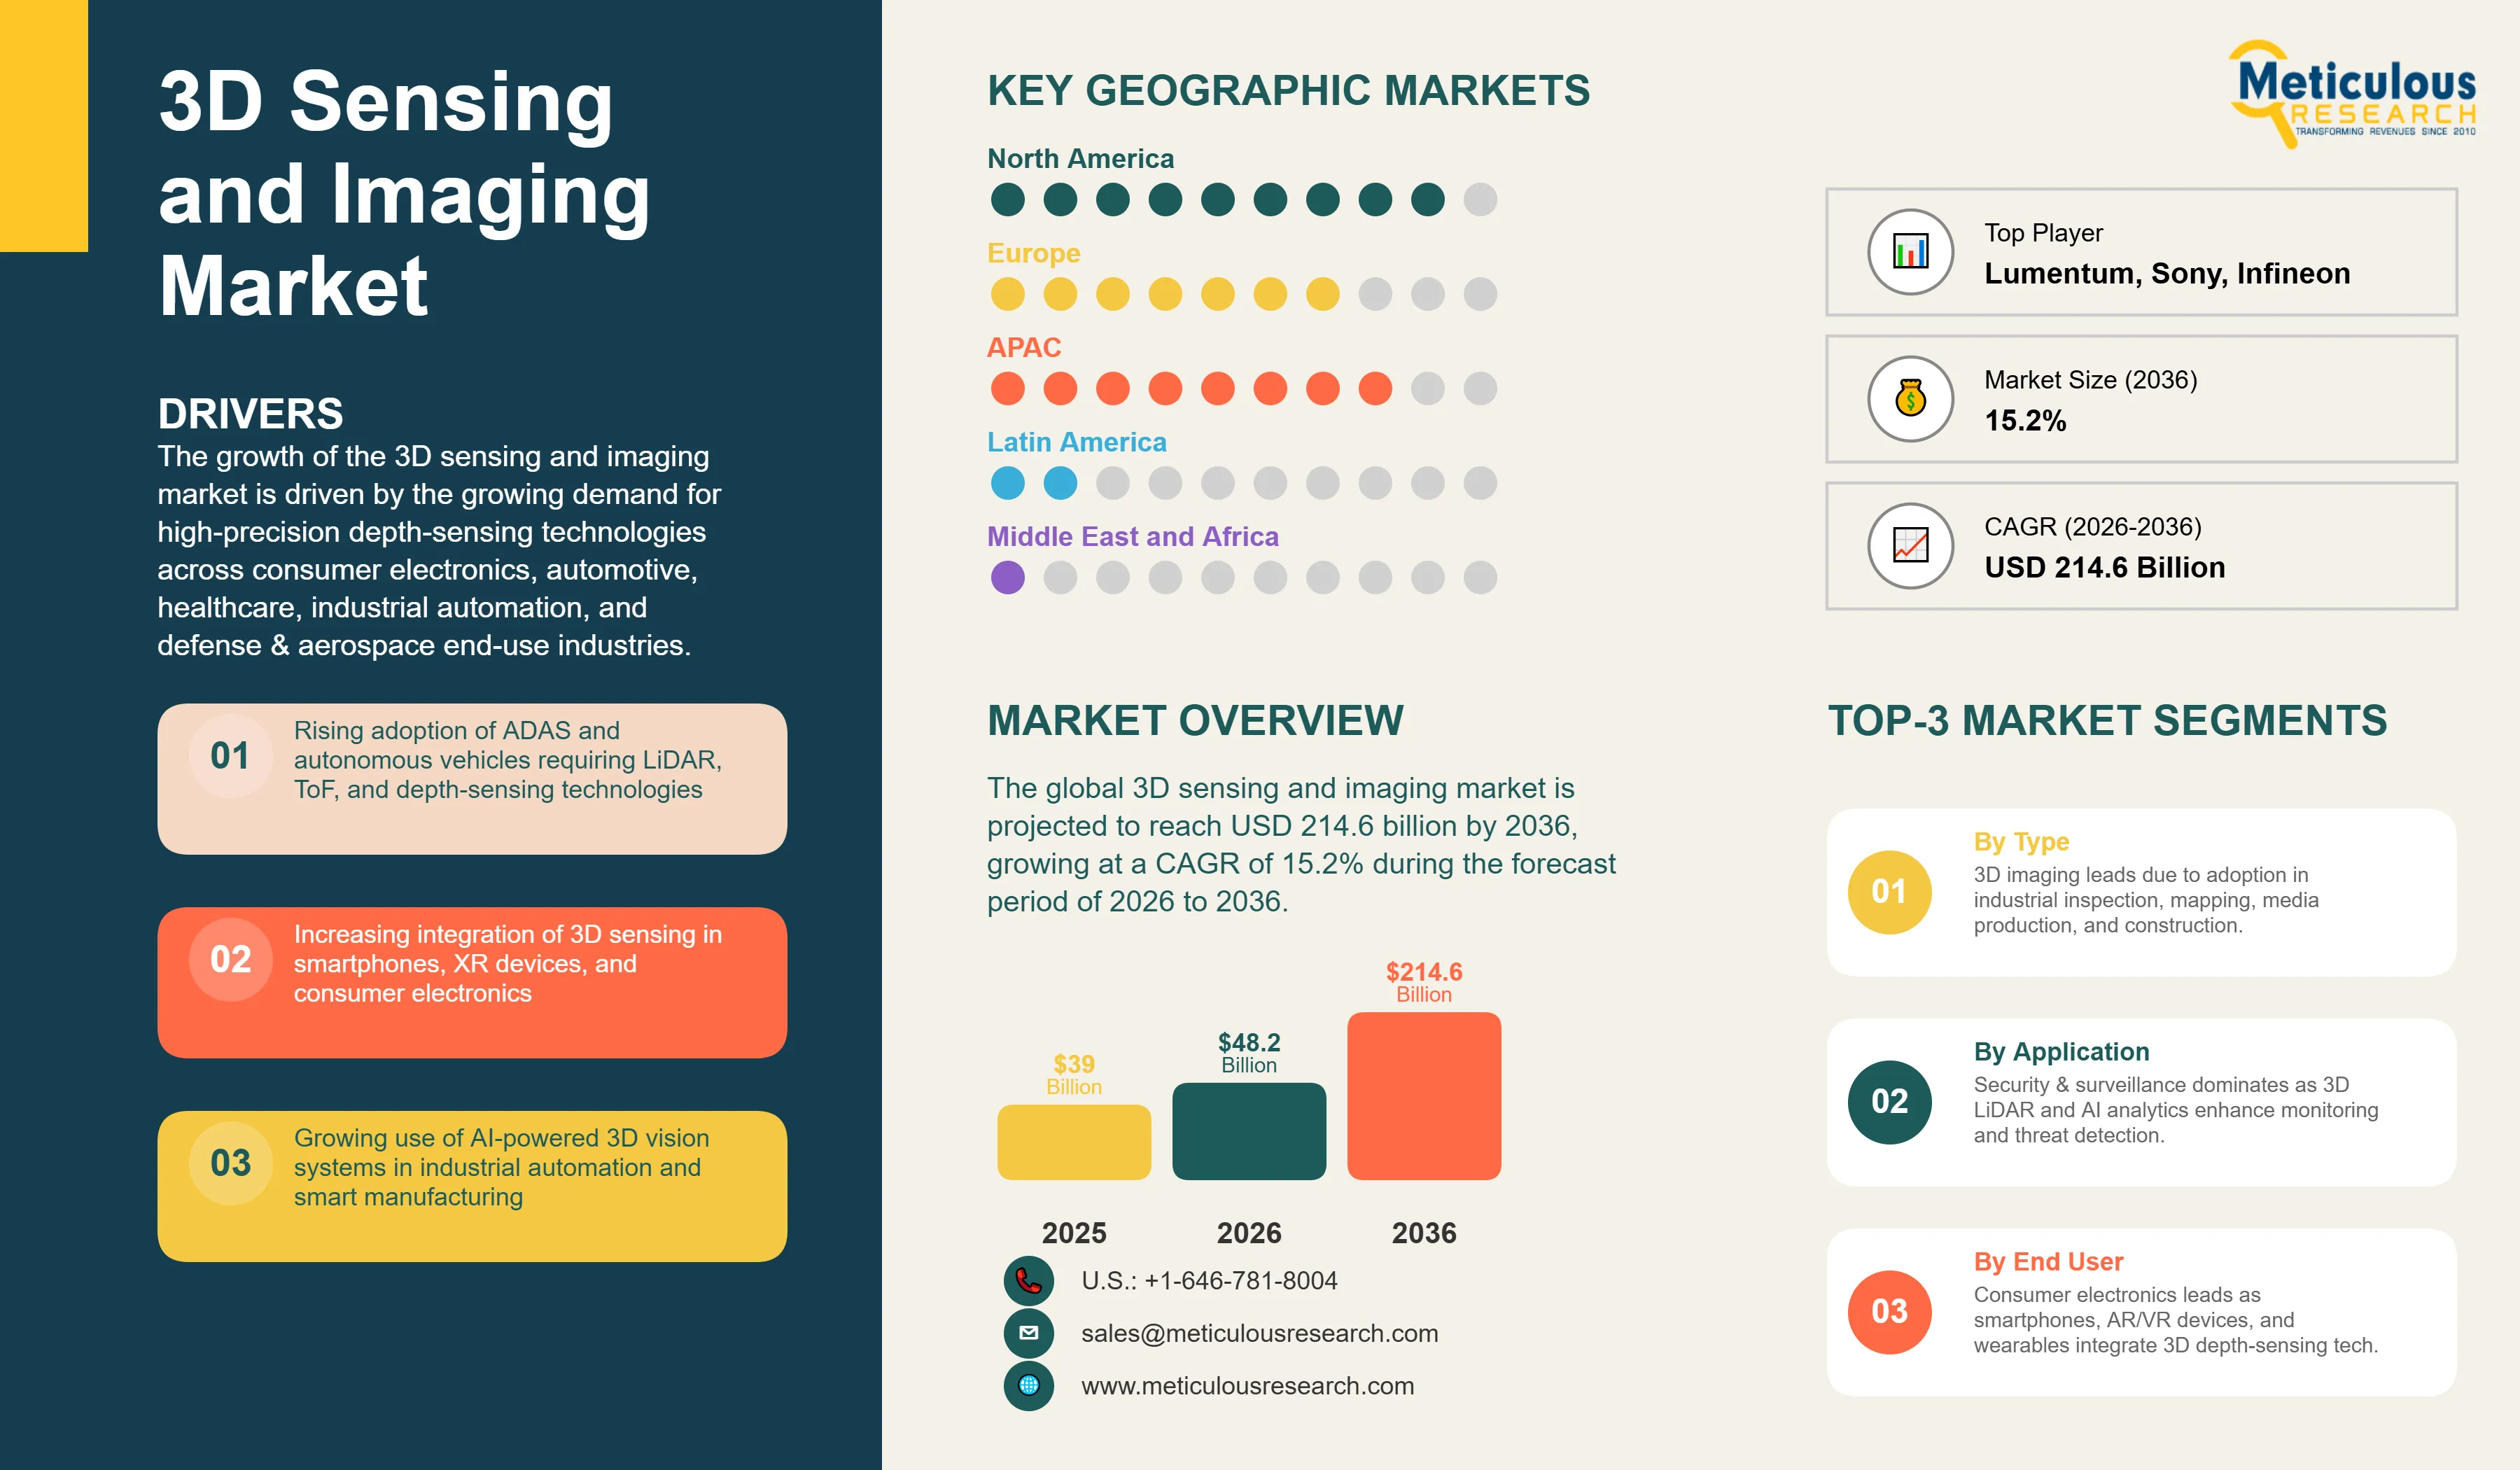
Report ID: MRICT - 104674 Pages: 350 Mar-2026 Formats*: PDF Category: Information and Communications Technology Delivery: 24 to 48 Hours Download Free Sample ReportThe global 3D sensing and imaging market was valued at USD 39.0 billion in 2025 and is projected to reach USD 214.6 billion by 2036 from USD 48.2 billion in 2026, growing at a CAGR of 15.2% during the forecast period of 2026 to 2036.
The growth of the 3D sensing and imaging market is driven by the growing demand for high-precision depth-sensing technologies across consumer electronics, automotive, healthcare, industrial automation, and defense & aerospace end-use industries. The growing commercial deployment of advanced driver-assistance systems (ADAS) and autonomous vehicles is a primary driver, with automotive LiDAR, Time-of-Flight (ToF), and structured light sensing systems becoming standard across mass-market vehicle platforms in both Asia-Pacific and Western markets. Simultaneously, the proliferation of 3D sensing capabilities in smartphones, extended reality (XR) headsets, and intelligent consumer devices is driving the adoption of compact, power-efficient depth sensors, mainly ToF and structured light modules, across the consumer electronics segment.
The combination of 3D sensing and imaging technologies with artificial intelligence (AI), machine learning, and edge computing is transforming the market, enabling real-time spatial understanding, semantic segmentation, object recognition, and predictive perception across diverse application environments. AI-powered 3D vision platforms are enabling manufacturers to automate quality inspection, robotic guidance, and dimensional measurement at previously unachievable accuracy and throughput levels, thereby driving adoption across Industry 4.0-oriented manufacturing facilities globally. The integration of AI-driven depth analytics is also driving the growth of the medical imaging segment, where 3D optical scanning, augmented reality surgical guidance, and AI-assisted diagnostic imaging are rapidly expanding the clinical application base for 3D sensing technologies.
The growing adoption of spatial computing technologies is increasing demand for compact and high-performance 3D sensing components. The commercial launch of Apple Vision Pro in 2024 and the continued development of XR devices by companies such as Samsung, Google, and Meta are supporting the integration of depth-sensing technologies in wearable and portable devices. Components such as VCSELs (vertical-cavity surface-emitting lasers), single-photon avalanche diodes (SPADs), and advanced optical elements are enabling compact and highly accurate 3D sensing modules suitable for next-generation consumer electronics.
At the same time, the adoption of solid-state LiDAR is increasing across automotive, robotics, and geospatial mapping applications. Companies including Hesai Technology, RoboSense Technology, Luminar Technologies, and Innoviz Technologies are increasing production capacity and strengthening partnerships with automotive OEMs as LiDAR systems move from pilot programs toward broader commercial deployment. For example, in 2026, Hesai Technology announced plans to expand its annual LiDAR production capacity to more than four million units, reflecting the increasing integration of LiDAR in advanced driver assistance systems (ADAS) and autonomous driving platforms.
 Click here to: Get Free Sample Pages of this Report
The 3D sensing and imaging market includes the full range of hardware components, software platforms, and integrated systems used to capture, process, and interpret three-dimensional spatial data about objects, environments, and biological structures. 3D sensing refers to the electronic capture of length, width, and depth information to enable enhanced human-machine interfaces, biometric authentication, gesture recognition, and environmental perception in autonomous systems. 3D imaging refers to the creation of three-dimensional digital representations of physical objects or spaces using specialized cameras, laser scanners, or computational imaging techniques, with applications spanning industrial quality inspection, medical diagnostics, architectural documentation, media production, and geospatial mapping. The market is segmented by type, technology/modality, application, end-use industry, and geography.
Surging Demand for ADAS and Autonomous Vehicle Sensing Technologies
The increasing adoption of advanced driver-assistance systems (ADAS) and the development of higher levels of vehicle autonomy are major drivers for 3D sensing technologies in the automotive industry. Modern ADAS features such as automatic emergency braking, adaptive cruise control, lane-keeping assistance, blind-spot detection, and automated parking require accurate environmental perception enabled by sensing technologies such as LiDAR, radar, Time-of-Flight (ToF) cameras, and stereoscopic vision systems. In addition, regulatory initiatives promoting vehicle safety technologies in major markets such as the U.S., Europe, and China are supporting the wider integration of sensing systems across vehicle segments.
The automotive LiDAR industry is entering a phase of commercial scale deployment, with several LiDAR manufacturers expanding production capacity and strengthening partnerships with automotive OEMs. Companies such as Hesai Technology and RoboSense Technology have introduced solid-state LiDAR platforms designed for automotive applications, including Hesai’s AT128 and RoboSense’s M-series LiDAR systems. As LiDAR adoption expands across electric vehicles, autonomous driving platforms, and advanced driver-assistance systems, demand is increasing for related components such as laser emitters, detector arrays, optical components, and signal-processing platforms.
Rising Proliferation of 3D Sensing in Consumer Electronics and Spatial Computing
The integration of 3D sensing technologies in consumer electronics devices is driving large-scale demand for compact depth-sensing modules. Smartphones, tablets, and wearable devices increasingly incorporate structured-light and Time-of-Flight sensors for applications such as facial recognition, gesture recognition, augmented reality, and computational photography. Major smartphone manufacturers such as Apple, Samsung, and Xiaomi have integrated depth-sensing capabilities into flagship and mid-range devices.
The development of spatial computing and extended-reality (XR) platforms is creating significant demand for high-performance sensing technologies in wearable devices. Devices such as Apple Vision Pro and XR headsets from companies including Meta and Samsung require advanced sensing systems to support spatial tracking, gesture recognition, and environmental mapping.
For example, in August 2025, VoxelSensors announced a collaboration with Qualcomm Technologies to integrate its SPAES™ technology into Snapdragon AR2 Gen 1 platforms, aimed at improving depth-sensing performance for XR and robotics applications. At the component level, technologies such as VCSEL illumination sources produced by companies including Lumentum Holdings and ams OSRAM play an important role in enabling compact depth-sensing architectures for consumer electronics devices.
Solid-State LiDAR Scaling Across Automotive and Robotics Applications
The transition from mechanical rotating LiDAR systems to solid-state LiDAR architectures is a key technology trend in the 3D sensing market. Solid-state LiDAR technologies such as MEMS-based LiDAR, Flash LiDAR, optical phased arrays, and emerging metasurface-based solutions reduce mechanical complexity while enabling smaller form factors and improved reliability for automotive and robotics applications.
Companies such as Hesai Technology, RoboSense Technology, Luminar Technologies, and Innoviz Technologies are developing solid-state LiDAR systems designed for integration into vehicles and robotic platforms. Advances in semiconductor integration and manufacturing processes are supporting gradual reductions in LiDAR system costs, enabling broader adoption in applications such as autonomous vehicles, robotics, drone navigation, and smart infrastructure.
Emerging technologies such as metasurface-based beam steering platforms, including Lumotive’s Light Control Metasurface (LCM) technology, are also being explored as potential approaches for compact solid-state LiDAR systems manufactured using semiconductor processes.
AI and Edge Computing Integration Enhancing Real-Time 3D Scene Understanding
The integration of artificial intelligence (AI) and edge computing with 3D sensing systems is improving the ability of devices to interpret spatial data in real time. AI-enabled 3D vision systems can perform tasks such as object detection, point-cloud analysis, anomaly detection, and real-time environment mapping, which are important for applications including autonomous navigation, industrial inspection, and robotics.
Edge computing capabilities integrated into sensing platforms allow data processing to occur closer to the sensor, reducing latency and bandwidth requirements while improving response times in safety-critical applications such as autonomous vehicles, industrial automation systems, and medical imaging platforms.
|
Market Size by 2036 |
USD 214.6 Billion |
|
Market Size in 2025 |
USD 39.0 Billion |
|
Market Size in 2026 |
USD 48.2 Billion |
|
Market Growth Rate (2026–2036) |
CAGR of 15.2% |
|
Dominating Region |
North America |
|
Fastest Growing Region |
Asia-Pacific |
|
Base Year |
2025 |
|
Forecast Period |
2026 to 2036 |
|
Segments Covered |
By Type: 3D Imaging, 3D Sensing By Technology/Modality: LiDAR, Time-of-Flight (ToF), Structured Light, Stereoscopic Imaging/Vision, Laser Triangulation, Radar, Ultrasound, X-ray, Other Technologies By Application: Security & Surveillance, Mapping & Imaging, Industrial Automation, Medical Imaging, Navigation, Scanning, Surveying, Other Applications By End-use Industry: Automotive, Transportation & Logistics; Consumer Electronics; Defense & Aerospace; Healthcare; Manufacturing & Warehouses; Media & Entertainment; Architecture, Engineering & Construction; Other End-use Industries By Geography: North America, Asia-Pacific, Europe, Latin America, Middle East & Africa |
|
Regions Covered |
North America, Asia-Pacific, Europe, Latin America, Middle East & Africa |
Why Does the 3D Imaging Segment Dominate the 3D Sensing and Imaging Market?
Based on type, the 3D imaging segment is expected to account for the largest share of the global 3D sensing and imaging market in 2026. This is primarily attributed to its broad adoption base across industrial, commercial, and professional applications such as industrial quality inspection, geospatial mapping, architectural documentation, media production, archaeological documentation, and forensic analysis. The growing adoption of cloud-based 3D imaging solutions, which enable scalable storage, collaborative processing, and AI-assisted analysis of large-volume 3D datasets, is expanding the market beyond traditional on-premise deployment models, making 3D imaging more accessible to small and medium-sized enterprises across manufacturing, construction, and professional services sectors.
3D Sensing: The Fastest-Growing Segment
The 3D sensing segment is expected to grow at the fastest CAGR during the forecast period, driven by the rapid proliferation of depth-sensing capabilities across consumer electronics, automotive, robotics, and IoT edge devices. The integration of 3D sensing into an expanding universe of device categories, including smartphones, XR headsets, autonomous vehicles, industrial robots, service robots, smart home devices, and wearables, is creating growing volume demand for compact, low-power, and cost-optimized depth sensing modules.
Why Does the Time-of-Flight (ToF) Segment Dominate the 3D Sensing and Imaging Market?
Based on technology/modality, the Time-of-Flight (ToF) segment is expected to account for the largest share of the global 3D sensing and imaging market in 2026, primarily due to its large-scale adoption in consumer electronics devices such as smartphones, tablets, and wearable devices. ToF sensors provide compact, low-power depth sensing capabilities suitable for applications including facial recognition, gesture detection, augmented reality, and computational photography. Their ability to deliver real-time depth information at relatively low system cost has supported their integration across high-volume consumer electronics platforms.
LiDAR: Fastest-Growing Technology Segment
The LiDAR segment is projected to grow at the fastest CAGR through 2036, driven by increasing adoption in autonomous vehicles, robotics, geospatial mapping, and smart infrastructure applications. LiDAR systems generate high-resolution point clouds that enable accurate environmental perception for applications requiring long-range sensing and precise spatial mapping. Increasing deployment of LiDAR in advanced driver-assistance systems (ADAS), autonomous driving platforms, drone navigation, and industrial robotics is expected to support strong growth of this segment during the forecast period.
Why Does Security & Surveillance Lead the 3D Sensing and Imaging Market by Application?
Based on application, the security & surveillance segment is expected to account for the largest share of the global 3D sensing and imaging market in 2026, and is also projected to grow at the highest CAGR during the forecast period. The dual leadership position reflects the growing deployment of 3D imaging and sensing technologies across government security, transportation hub monitoring, critical infrastructure protection, commercial facility surveillance, and border control applications. 3D LiDAR cameras are increasingly implemented to monitor construction sites, storage facilities, parking areas, and perimeter security zones, offering superior depth perception and object classification compared to conventional 2D surveillance cameras. The growing integration of AI-driven facial recognition, gait analysis, and behavioral analytics with 3D sensing infrastructure is substantially expanding the intelligence and deterrence value of modern surveillance systems.
Industrial Automation: High-Growth Application Segment
The industrial automation segment is projected to register strong growth during the forecast period, driven by the adoption of 3D machine vision for quality inspection, robotic guidance, dimensional metrology, and warehouse automation. The proliferation of collaborative robots and mobile industrial platforms that require real-time 3D environmental mapping for safe operation in shared workspaces is driving the industrial 3D sensing market beyond traditional fixed-station machine vision applications. 3D vision systems from Cognex, KEYENCE, SICK, and Teledyne are foundational enabling technologies for Industry 4.0 manufacturing systems that increasingly require flexible, intelligent visual inspection capabilities.
Why Does the Consumer Electronics Segment Lead the 3D Sensing and Imaging Market?
Based on end-use industry, the consumer electronics segment is expected to account for the largest share of the global 3D sensing and imaging market in 2026, driven by the widespread integration of 3D depth-sensing modules across smartphones, tablets, XR headsets, gaming consoles, smart TVs, and other consumer devices. Smartphones are the highest-volume application for 3D sensing components globally, with face authentication (using structured light or ToF), computational photography enhancement, and augmented reality features now standard across premium and increasingly mid-range device segments from Apple, Samsung, Xiaomi, OPPO, and other major OEMs.
The consumer electronics sub-segmentation, spanning smartphones, cameras, laptops, televisions, scanners, and other consumer electronics including wearables, kiosk devices, and AR/VR devices, reflects the breadth of 3D sensing integration across the category. The wearables and AR/VR sub-segment is projected to grow at the fastest CAGR within consumer electronics, driven by the spatial computing platform buildout and growing adoption of 3D sensing in health monitoring wearables.
North America: Largest Regional Market
North America is expected to account for the largest share of the global 3D sensing and imaging market in 2026, driven by its leadership in autonomous vehicle technology development, large-scale defense & aerospace 3D sensing investment, mature industrial automation adoption, and the presence of leading 3D sensing technology developers and platform companies. The U.S. is home to key players such as Apple, Qualcomm, Luminar Technologies, Cognex Corporation, FARO Technologies, Trimble, and Autodesk, whose product development and market penetration activities substantially drive global market dynamics.
Government-funded defense programs, smart city initiatives, and infrastructure digitization projects are further generating substantial institutional demand for 3D sensing and mapping technologies across federal, state, and municipal application contexts. The strong adoption of 3D machine vision in the North American advanced manufacturing sector, mainly automotive, aerospace, and electronics manufacturing, also contributes significantly to the market growth.
Asia-Pacific: Fastest-Growing Regional Market
Asia-Pacific is expected to grow at the fastest CAGR during the forecast period, driven by increasing adoption of 3D sensing technologies across the large consumer electronics, automotive, and manufacturing sectors in the region. The region is a major hub for consumer electronics production and semiconductor manufacturing, which supports large-scale deployment of 3D sensing technologies in smartphones, wearable devices, and industrial automation systems.
China is one of the key markets for 3D sensing technologies within the region, driven by strong adoption of automotive LiDAR systems, consumer electronics manufacturing, and investments in smart city and digital infrastructure projects. Chinese LiDAR manufacturers such as Hesai Technology and RoboSense Technology have expanded their presence in the global automotive LiDAR supply chain, while electric vehicle manufacturers such as Li Auto, Xiaomi, and NIO have introduced vehicle platforms equipped with LiDAR-based driver assistance systems.
Japan and South Korea are also key markets in the region due to their strong capabilities in consumer electronics, semiconductor manufacturing, and automotive technologies. Companies such as Sony Semiconductor Solutions, Samsung Electronics, and Panasonic Holdings Corporation are major suppliers of imaging sensors, optical components, and sensing technologies used in 3D sensing systems.
In addition, India is emerging as a growing market for 3D sensing technologies, driven by expanding manufacturing activities, increasing healthcare infrastructure investment, and government initiatives promoting smart city and digital infrastructure development.
The report includes a competitive landscape based on an extensive assessment of the product portfolios, geographic presence, and key strategic developments adopted by leading market players in the 3D sensing and imaging market. The key companies profiled in the report include STMicroelectronics N.V. (Switzerland), Infineon Technologies AG (Germany), Sony Group Corporation (Japan), Qualcomm Technologies, Inc. (U.S.), OmniVision Technologies, Inc. (U.S.), Lumentum Holdings Inc. (U.S.), ams OSRAM AG (Austria), Cognex Corporation (U.S.), KEYENCE CORPORATION (Japan), SICK AG (Germany), Teledyne Technologies Incorporated (U.S.), Trimble Inc. (U.S.), FARO Technologies, Inc. (U.S.), Hesai Technology Co., Ltd. (China), RoboSense Technology Co., Ltd. (China), Luminar Technologies, Inc. (U.S.), Innoviz Technologies Ltd. (Israel), Panasonic Holdings Corporation (Japan), and Viavi Solutions Inc. (U.S.), among others.
3D Sensing and Imaging Market, by Type
3D Sensing and Imaging Market, by Technology/Modality
3D Sensing and Imaging Market, by Application
3D Sensing and Imaging Market, by End-use Industry
3D Sensing and Imaging Market, by Geography
The global 3D sensing and imaging market is estimated at USD 48.2 billion in 2026 and is projected to reach USD 214.6 billion by 2036, at a CAGR of 15.2% during the forecast period of 2026 to 2036.
The Time-of-Flight (ToF) segment is expected to account for the largest share of the global 3D sensing and imaging market in 2026, supported by high-volume adoption in smartphones, tablets, and other consumer electronics devices.
The LiDAR segment is projected to register the highest CAGR during the forecast period, driven by increasing adoption in autonomous vehicles, robotics, geospatial mapping, and smart infrastructure applications.
The market is driven by the increasing adoption of ADAS and autonomous vehicle sensing technologies, growing integration of 3D sensing in consumer electronics and spatial computing devices, rising deployment of 3D vision systems in industrial automation, and increasing investments in smart city and geospatial infrastructure. Opportunities include the expansion of solid-state LiDAR technologies, increasing adoption of 3D sensing in healthcare and robotics applications, and the development of next-generation sensing technologies such as 4D sensing and neuromorphic sensors.
High initial system installation costs remain a key barrier to adoption, particularly in industrial machine vision and specialized medical imaging applications. In addition, technical challenges related to sensing accuracy and reliability in adverse environmental conditions—including rain, fog, strong ambient light, and reflective surfaces—continue to affect performance in automotive and outdoor sensing applications. Data privacy concerns related to facial recognition and biometric surveillance technologies also present regulatory challenges in certain markets.
Major companies operating in the global 3D sensing and imaging market include STMicroelectronics N.V., Infineon Technologies AG, Sony Group Corporation, Qualcomm Technologies, Inc., OmniVision Technologies, Inc., Lumentum Holdings Inc., ams OSRAM AG, Cognex Corporation, KEYENCE CORPORATION, SICK AG, Teledyne Technologies Incorporated, Trimble Inc., FARO Technologies, Inc., Hesai Technology Co., Ltd., RoboSense Technology Co., Ltd., Luminar Technologies, Inc., Innoviz Technologies Ltd., Panasonic Holdings Corporation, and Viavi Solutions Inc., among others.
Asia-Pacific is expected to register the highest CAGR during the forecast period, supported by strong consumer electronics manufacturing, increasing LiDAR deployment in China’s electric vehicle sector, and growing adoption of 3D sensing technologies in industrial automation, healthcare, and geospatial mapping applications. North America is expected to account for the largest share of the global market, driven by strong innovation in autonomous vehicle technologies, defense and aerospace applications, and industrial automation.


Published Date: Aug-2024
Published Date: May-2024
Published Date: Jan-2025
Please enter your corporate email id here to view sample report.
Subscribe to get the latest industry updates