Wave Energy Converter Market (2026-2036)
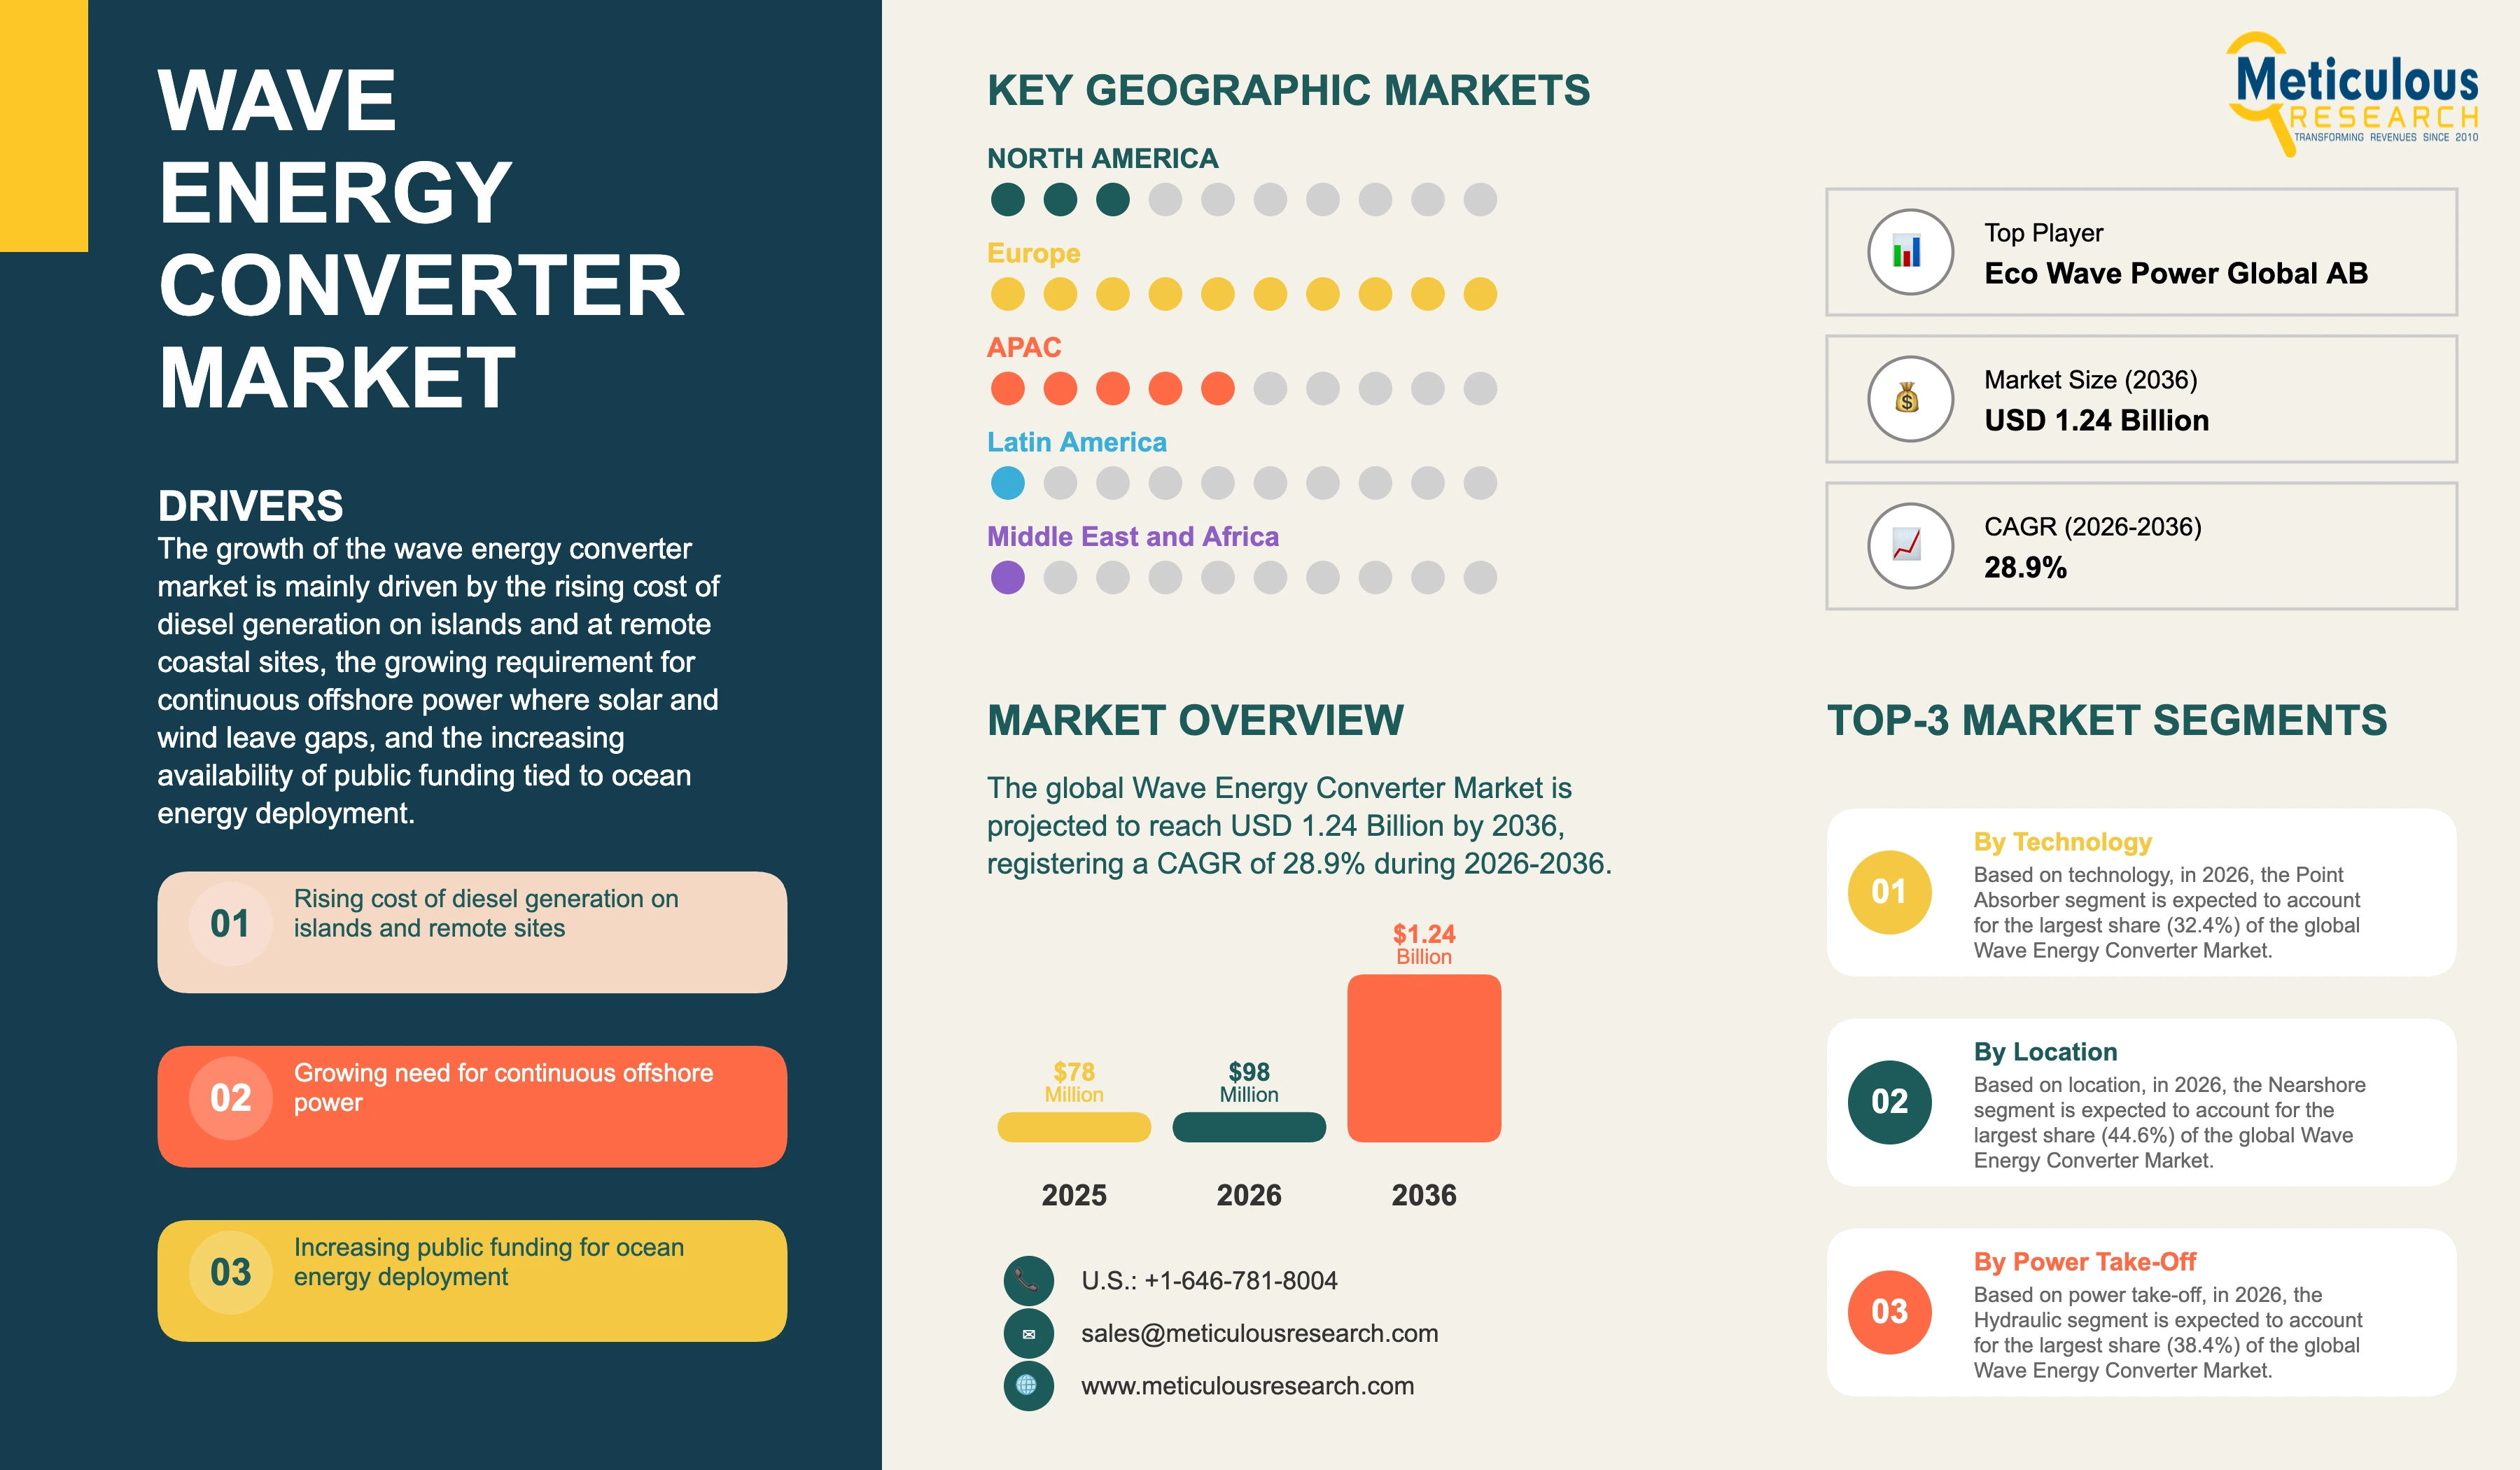
The global wave energy converter market was valued at USD 78.0 million in 2025. This market is expected to reach USD 1.24 billion by 2036 from an estimated USD 98.0 million in 2026, registering a CAGR of 28.9% during the forecast period (2026-2036).
- Published
- Nov 2026
- Pages
- 275
- Format
- PDF + Excel
- Report ID
- MREP - 1042465
- Base year
- 2025
- 2025 · BASELINE
- $78.0M
- 2036
- $1.24B
- CAGR 2026–2036
- 28.9%
2025 baseline · 2026–2036 forecast at 28.9% CAGR · hover a bar for the value
Key highlights
IEC TS 62600-100:2024 was published on 18 November 2024 as version 2.0 and replaces the 2012 first version of the power performance assessment specification.
The specification covers a single non-array converter and transposes performance between locations, so array energy production has no standardised assessment method.
Performance derived under the specification is tied to the wave conditions of the location assessed, which means a device requalifies its yield at every new site.
Limits on allowed changes to the converter mean a developer that redesigns a device loses the transferability of its existing performance evidence.
In United States federal waters a limited lease reaches operations in about 12 months but caps energy sold, while a commercial lease allows up to five years before the construction and operations plan is submitted.
Direct drive linear generators are the fastest-growing power take-off at a CAGR of 34.4%, displacing hydraulic systems in new designs.
Installed capital cost falls from USD 16, 900 per kW in 2026 to USD 12,900 per kW by 2036 as repeat deployments replace one-off prototype builds.
Ocean observation, autonomous vehicle charging and defence is the fastest-growing application at a CAGR of 32.6%, from a base of USD 8.4 million in 2026.
By technology, point absorbers account for the largest share of 32.4% in 2026, while rotating mass and other devices register the highest CAGR of 38.4%.
By location, nearshore installations account for the largest share of 44.6%, while offshore installations register the highest CAGR of 32.2%.
By power take-off, hydraulic systems account for the largest share of 38.4%, while direct drive linear generators register the highest CAGR.
By application, utility-scale grid supply accounts for the largest share of 42.6%, while ocean observation and defence applications register the highest CAGR.
By geography, Europe accounts for the largest share of 54.2% in 2026, while Asia-Pacific registers the highest CAGR of 31.4%.
Report summary
| Particulars | Details |
|---|---|
| Forecast Period | 2026-2036 |
| Base Year | 2025 |
| Estimated Year | 2026 |
| CAGR (2026-2036) | 28.9% by value and 32.4% by installed capacity |
| Format | PDF, Excel & Cloud Portal · 275 pages |
| Market Size in 2025 | USD 78.0 million (4.6 MW) |
| Market Size in 2026 | USD 98.0 million (5.8 MW) |
| Market Size by 2036 | USD 1.24 billion (96.0 MW) |
| Installed Capital Cost | USD 16,900 per kW in 2026 to USD 12,900 per kW by 2036 |
| Largest Segment by Technology (2026) | Point absorber (32.4%) |
| Fastest-Growing Segment by Technology | Rotating mass and other devices (CAGR 38.4%) |
| Largest Region (2026) | Europe (54.2%) |
| Fastest-Growing Region | Asia-Pacific (CAGR 31.4%) |
| Segments Covered | Technology, Location, Power Take-Off, Application, Geography |
| Countries Covered | U.K., Portugal, Spain, Ireland, Denmark, Sweden, Norway, France, Italy, Rest of Europe, China, Australia, South Korea, Japan, India, Rest of Asia-Pacific, U.S., Canada, Chile, Brazil, Rest of Latin America, South Africa, Saudi Arabia, Rest of Middle East & Africa |
| Companies Profiled | 11 companies and other companies |
Report overview
Segments covered: technology, location, power take-off, application.
The growth of this market is mainly driven by the rising cost of diesel generation on islands and at remote coastal sites, the growing requirement for continuous offshore power at locations where solar and wind alone leave gaps, the increasing availability of public funding tied to ocean energy deployment targets in Europe, and the expanding use of wave devices to power ocean observation, subsea equipment and autonomous vehicles. However, factors such as the absence of a standardised method for establishing the energy production of an array rather than a single device, the site-specific nature of power performance assessment, the survivability losses and repair costs imposed by extreme sea states, and consenting routes in federal waters that offer a short approval path only where energy sales are capped are expected to restrain the growth of this market to some extent.
In volume terms, installed capacity is expected to reach 96.0 MW by 2036 from an estimated 5.8 MW in 2026 and 4.6 MW in 2025, registering a CAGR of 32.4% during the forecast period, with the installed capital cost declining from USD 16,900 per kW to USD 12,900 per kW as device designs stabilise and the first repeat deployments replace one-off builds.
Capacity grows faster than value because each successive deployment costs less per kilowatt than the prototype that preceded it, and the decline in capital cost offsets part of the increase in megawatts installed.
A wave energy converter captures the motion or pressure of surface waves and converts it to electricity through a power take-off, and the scope of a supplied system runs from the structure and mooring through the take-off and control equipment to the grid or load connection. Revenue in this market comes from demonstration projects, island and remote power contracts and offshore equipment power rather than from utility supply competing on levelised cost, and the reason sits in how performance can and cannot be evidenced.
IEC TS 62600-100:2024, Marine energy, Wave, tidal and other water current converters, Part 100: Electricity producing wave energy converters, Power performance assessment, published on 18 November 2024 as version 2.0 by Technical Committee 114, cancelling and replacing the 2012 first version provides a method for estimating the mean annual energy production of a wave energy converter, used together with IEC TS 62600-101 for wave resource assessment, by estimating the electrical power performance of a single non-array converter at one location from its performance at another, through transposition of the capture width matrix, with limits on allowed changes to the converter, minimum wave data requirements at the new location, validation of the transposed matrix, an uncertainty assessment, and conditions for transferring performance through geometric, kinematic and dynamic similarity. The specification applies to commercial-scale converters that are compliantly moored, taut moored, bottom mounted or shore mounted, and derives performance that is tied to the wave conditions of the location assessed. Array energy production has no equivalent method, so a developer can evidence the yield of one device at one site and cannot evidence the yield of the farm that would make the economics work. Project finance for a wave farm therefore has no standardised yield basis to underwrite, which is why capital in this market comes from public programmes, strategic investors and offshore industry customers rather than from infrastructure lenders.
Limits on allowed changes to the converter carry a further commercial consequence. A developer that redesigns the device to cut cost or improve survivability loses the transferability of its existing performance evidence and starts the assessment again, so iteration is penalised at exactly the stage when a pre-commercial technology most needs it. Developers respond by freezing a design earlier than engineering judgement would suggest and by running changes through separate demonstration units rather than through the reference device.
Consenting in United States federal waters shapes which applications are pursued there. Part 585 of Title 30 of the Code of Federal Regulations, Renewable Energy on the Outer Continental Shelf, which provides for commercial leases allowing occupation and operation of facilities for commercial energy generation, limited leases allowing energy-related activities that do not produce electricity or other energy product for sale above a limit set in the lease, research leases, right-of-way grants and right-of-use and easement grants, and a commercial lease runs from award through a preliminary period of up to five years in which the construction and operations plan must be submitted, then plan review, then a design and construction period beginning at plan approval, then an operations period of 35 years unless otherwise specified, while a limited lease, right-of-way grant or right-of-use and easement grant runs from issuance through a preliminary period of 12 months to submit a general activities plan, with the operations period beginning when that plan is approved. The short route to operations therefore belongs to the lease type that caps the energy sold, while the route permitting commercial generation allows up to five years before a plan is even submitted. Wave projects consequently cluster in state waters, at designated test centres and in offshore industry power applications where the energy is consumed rather than sold.
Europe holds the majority of deployment because public programmes have funded berths, grid connections and consented sites at test centres, and a developer arriving at a prepared berth avoids the consenting and infrastructure cost that would otherwise exceed the device itself. Those berths and their accumulated wave resource data are gating assets, since performance assessment is tied to the conditions of the location assessed and a device needs measured data at any site it moves to.
A converter must withstand sea states many times the energy of those it generates in, and the structural and mooring provision for that extreme case is sized for a condition that produces no revenue. Designs that reduce exposure by submerging, by shedding load through compliant mooring or by shutting down and surviving as a sealed body have therefore advanced faster than designs that maximise capture, so survivability rather than efficiency governs the economics of a deployed device, and the shift shows up in the growth of offshore and submerged configurations.
Supply consists almost entirely of venture and publicly funded developers, each holding a single device architecture, with one large offshore contractor supplying a converter into oil and gas applications. No developer has delivered a multi-device array into commercial operation, so there is no incumbent position built on fleet experience, and the ordering of the market will be settled by which architectures survive their first repeat deployments rather than by present share.
Europe, with a 54.2% share in 2026 valued at USD 53.1 million, at a CAGR of 27.8%.
Asia-Pacific, at a CAGR of 31.4%, valued at USD 24.1 million in 2026.
Europe accounts for 54.2% of the market in 2026, valued at USD 53.1 million, at a CAGR of 27.8%, led by the U.K., Portugal, Spain, Ireland, Denmark and Sweden.
The Middle East & Africa accounts for 2.8% in 2026, valued at USD 2.8 million, at a CAGR of 26.0%, and Latin America for 3.6%, valued at USD 3.5 million, at a CAGR of 27.0%.
The report profiles 11 companies, including Eco Wave Power Global AB, CorPower Ocean AB, Ocean Power Technologies, Inc., Carnegie Clean Energy Limited and AW-Energy Oy. The top five players account for an estimated 46.8% of the market in 2026.
Rotating mass and other devices, at a CAGR of 38.4%, valued at USD 7.0 million in 2026.
Nearshore installations, with a 44.6% share in 2026 valued at USD 43.7 million.
Offshore installations, at a CAGR of 32.2%, valued at USD 33.1 million in 2026.
Hydraulic systems, with a 38.4% share in 2026 valued at USD 37.6 million.
Direct drive linear generators, at a CAGR of 34.4%, valued at USD 25.7 million in 2026.
Utility-scale grid supply, with a 42.6% share in 2026 valued at USD 41.8 million, at a CAGR of 29.6%.
Ocean observation, autonomous vehicle charging and defence, at a CAGR of 32.6%, valued at USD 8.4 million in 2026.
Report infographic
Market dynamics
15 factors across 5 forcesRising cost of diesel generation on islands and at remote coastal sites
Electricity on small islands and at remote coastal settlements is generated from diesel delivered by vessel, and the delivered fuel cost together with storage, handling and generator maintenance places the cost of supply far above mainland grid prices. A wave converter sited where the resource is strong competes against that cost rather than against a wholesale power price, and the comparison is the only one in which current device costs clear. Island utilities and local authorities are therefore the buyers who reach a decision without public funding attached.
Supply security carries weight alongside cost at these locations, because a fuel delivery interrupted by weather leaves no alternative. Wave resource is also strongest in the seasons when solar output is weakest at mid and high latitudes, which makes a converter complementary to an existing solar and battery installation rather than a competitor to it, and island systems are the clearest case for that combination.
Growing requirement for continuous offshore power where solar and wind leave gaps
Subsea sensors, monitoring equipment, communications relays and autonomous vehicle charging stations require power continuously at locations where running a cable is uneconomic and where a solar and battery installation cannot carry the load through a prolonged period of low light or high latitude winter. Wave resource is available in those conditions, and a converter sized in tens of kilowatts rather than megawatts is enough for the duty. The value to the customer is the avoided cost of vessel visits to replace batteries or refuel a generator, which is high enough to accept present device costs.
Offshore industry customers also consume the energy at the point of generation, which removes the consenting and market access questions that affect grid supply. A unit supplying a platform, a monitoring buoy or an aquaculture site does not sell energy, so it fits the lease and permit routes that reach operations fastest, and this alignment is why offshore equipment power has become the most commercially active application in the market.
Increasing availability of public funding tied to ocean energy deployment
Public programmes in Europe fund device build, berth access, grid connection and monitoring at designated test centres, and that funding covers the part of a project a private investor will not underwrite while the performance basis remains site-specific and array yield cannot be evidenced. Developers plan their deployment sequence around programme calls rather than around customer demand, and the timing of awards is visible in the year-to-year pattern of installed capacity.
Funded berths also supply the measured wave data a developer needs to assess performance at the site, which is a prerequisite under the governing specification and expensive to obtain independently. Access to a prepared and consented berth with a monitoring record is consequently worth more to a developer than the cash element of an award, and competition for berths shapes which devices advance.
Expanding use of wave devices to power ocean observation and autonomous systems
Ocean observation networks, naval and coastguard sensing, and autonomous underwater and surface vehicles all need energy at sea in quantities a small converter can supply, and the mission is compromised when a platform must return to port or wait for a vessel to recharge it. Converters integrated with storage and with solar supply that duty continuously, and defence and research buyers accept a cost per kilowatt that no energy customer would. Procurement runs through equipment budgets rather than energy budgets, which removes the levelised cost comparison altogether.
Volumes in this application are small in megawatts and significant in value, because the device is sold as part of a capability rather than as generation capacity. Growth is the fastest of any application in the market for that reason, and it is the route by which several developers have reached revenue while their utility-scale programmes remain at demonstration stage, and it is the clearest instance of a device being bought for what it enables rather than for the energy it produces.
Table of contents
12 chapters · 129 sections · 275 pages · click to expandSegmental analysis
| Segment | Largest share (2026) | Fastest growth (2026–2036) |
|---|---|---|
| By Technology | Point absorber | Rapid growth of this |
| By Location | Nearshore | Rapid growth of this |
| By Power Take-Off | Hydraulic | Rapid growth of this |
| By Application | Utility-scale grid supply | Rapid growth of this |
By Technology
- Wave Energy Converter Market Analysis by Technology
- The point absorber segment is expected to account for the largest share of 32.4% of the global wave energy converter market, valued at USD 31.8 million.
- The large share of this segment is mainly due to a geometry that is insensitive to wave direction, a structure that scales down to the tens of kilowatts required by offshore equipment power, and the largest number of deployed units of any architecture.
- Oscillating water columns account for 21.6%, valued at USD 21.2 million, with the advantage of keeping all moving parts above the waterline.
- Oscillating wave surge converters account for 16.8%, valued at USD 16.5 million, growing at a CAGR of 29.6% on nearshore installations where the orbital motion of water particles is strongest.
- Attenuators account for 12.4%, valued at USD 12.1 million, and overtopping and terminator devices for 9.6%, valued at USD 9.4 million, the latter growing at 32.0% as shoreline and breakwater-mounted installations reuse existing structures.
- However, the rotating mass and other devices segment, valued at USD 7.0 million in 2026 and accounting for a share of 7.2%, is projected to register the highest CAGR of 38.4% during the forecast period.
- The rapid growth of this segment is attributed to fully sealed hulls with no water-exposed moving parts, which addresses the survivability and maintenance costs that have ended earlier deployments, and to adoption in offshore industry power where availability outweighs capture efficiency.
- Device architecture in this market is selected for survival and maintenance behaviour rather than for peak conversion, and the share movement across the forecast follows that preference rather than any change in the published efficiency of the devices themselves.
- Point absorbers, with a 32.4% share in 2026 valued at USD 31.8 million.
By Location
- Wave Energy Converter Market Analysis by Location
- The nearshore segment is expected to account for the largest share of 44.6% of the market, valued at USD 43.7 million.
- The large share of this segment is mainly due to shorter cable runs, access for installation and maintenance with smaller vessels, and wave conditions energetic enough for generation while less severe than the open sea.
- Onshore and shoreline installations account for 21.6%, valued at USD 21.2 million, mounted on breakwaters, jetties and piers where the civil structure already exists and consenting is simpler.
- However, the offshore segment, valued at USD 33.1 million in 2026 and accounting for a share of 33.8%, is projected to register the highest CAGR of 32.2% during the forecast period.
- The rapid growth of this segment is attributed to the resource being strongest in deeper water, to offshore industry customers consuming the energy where it is produced, and to co-location with offshore wind sites that already hold consent, grid connection and an operations base.
- Installation and maintenance vessel cost rather than resource quality decides the economics of the location choice, which is why nearshore retains the largest share despite weaker resource than the open sea and shorter exposure to the sea states that carry most of the annual energy.
By Power Take-Off
- Wave Energy Converter Market Analysis by Power Take-Off
- The hydraulic segment is expected to account for the largest share of 38.4% of the market, valued at USD 37.6 million.
- The large share of this segment is mainly due to the installed base of devices designed around hydraulic circuits, which handle the high forces and slow motion of wave loading with established components.
- Air turbines account for 19.6%, valued at USD 19.2 million, used with oscillating water columns where the take-off sits above the waterline.
- Hydro turbines and other arrangements account for 15.8%, valued at USD 15.5 million, growing at a CAGR of 30.4% in overtopping devices and in systems coupling generation with desalination.
- However, the direct drive linear generator segment, valued at USD 25.7 million in 2026 and accounting for a share of 26.2%, is projected to register the highest CAGR of 34.4% during the forecast period.
- The rapid growth of this segment is attributed to the removal of working fluid, seals and the associated maintenance from a submerged or splash-zone installation, and to availability rather than efficiency being the property that determines the economics of a deployed device.
- Take-off selection also follows the device architecture rather than being chosen independently, so the configuration mix moves with the technology mix rather than ahead of it, and a take-off change normally arrives with a new device rather than as a retrofit to an existing one.
By Application
- Wave Energy Converter Market Analysis by Application
- The utility-scale grid supply segment is expected to account for the largest share of 42.6% of the market, valued at USD 41.8 million, growing at a CAGR of 29.6%.
- The large share of this segment is mainly due to publicly funded demonstration projects that connect to a grid at a test centre berth, where the purpose of the installation is evidence rather than energy sales.
- Island and remote community power accounts for 24.8%, valued at USD 24.3 million, growing at a CAGR of 27.4%, and is the application in which a buyer contracts without public funding because delivered diesel sets the comparison.
- Offshore industry power accounts for 18.4%, valued at USD 18.0 million, in platform, subsea and aquaculture duty.
- However, the ocean observation, autonomous vehicle charging and defence segment, valued at USD 8.4 million in 2026 and accounting for a share of 8.6%, is projected to register the highest CAGR of 32.6% during the forecast period.
- The rapid growth of this segment is attributed to procurement through equipment budgets rather than energy budgets, which removes the cost per megawatt hour comparison, and to mission value that justifies a device price no energy customer would accept.
- Desalination and other applications account for 5.6%, valued at USD 5.5 million, where the converter drives reverse osmosis directly rather than through an electrical stage and the output is water rather than power.
- Applications in this market divide between those that sell energy and those that consume it, and the growth through the forecast sits with the second group.
- Utility-scale supply holds the largest share only because demonstration projects connect to a grid at a funded berth, and the share would read differently if evidence projects were counted apart from commercial sales rather than counted together in one application line.
Geographic analysis
Europe
Largest shareIn 2026, Europe is expected to account for the largest share of 54.2% of the global wave energy converter market, valued at USD 53.1 million, growing at a CAGR of 27.8% during the forecast period. The large share of this region is mainly due to publicly funded test centre berths with consent, grid connection and an accumulated wave resource record, which remove the costs that would otherwise exceed the device itself. The United Kingdom, Portugal, Spain, Ireland, Denmark and Sweden lead, with Scottish and Portuguese sites carrying the largest share of deployment and the Nordic countries contributing both developers and component supply. Portuguese and Scottish berths hold the longest measured wave records, which a developer needs before performance at the site can be stated, and that record is itself a reason deployment returns to the same locations.
Asia-Pacific
Fastest growthAsia-Pacific accounts for 24.6% of the market in 2026, valued at USD 24.1 million, and is projected to register the highest CAGR of 31.4% during the forecast period. Growth is led by China, where coastal demonstration programmes and island supply projects proceed with state support and domestic manufacture, by Australia, which hosts developers and strong Southern Ocean resource, and by South Korea and Japan, where island and remote community supply is the principal application. Regional fabrication capacity also lowers device build cost relative to European construction.
North America
North America accounts for 14.8% of the market in 2026, valued at USD 14.5 million, at a CAGR of 29.4%. Activity in the United States is concentrated in state waters and at designated test facilities, together with defence and ocean observation procurement, because the federal lease route that permits commercial generation allows up to five years before a construction and operations plan is submitted while the faster route caps the energy sold. Canada contributes a smaller base weighted toward remote coastal community supply in British Columbia and the Atlantic provinces.
Latin America
Latin America accounts for 3.6% of the market in 2026, valued at USD 3.5 million, at a CAGR of 27.0%, with Chile holding the strongest resource on its Pacific coast and Caribbean island projects pursuing diesel displacement.
Middle East & Africa
The Middle East & Africa accounts for 2.8%, valued at USD 2.8 million, at a CAGR of 26.0%, concentrated in South Africa, where the Southern Ocean swell reaches the coast, and in early desalination-linked work along the Red Sea and Gulf coasts, where the output sought is water rather than grid electricity.
Competitive landscape
Supply in this market consists almost entirely of venture and publicly funded developers, each holding a single device architecture, alongside one large offshore contractor that supplies a converter into oil and gas applications. No developer has delivered a multi-device array into commercial operation, so no position rests on fleet experience, and present shares reflect which programmes have been funded rather than which products have been selected by customers. The ordering of the market will be settled by which architectures survive their first repeat deployments rather than by the share any of them holds today.
Competition for test centre berths matters more than competition for customers at this stage. A prepared berth carries consent, grid connection and the measured wave data required to assess performance at that location, and a developer without access to one faces costs that exceed the device. Selection panels rather than buyers therefore decide which devices advance, and the commercial filter that would remove weaker designs operates late in this market.
Several developers have moved toward offshore equipment and defence power, where energy is consumed at the point of generation and the customer buys continuity rather than cost per megawatt hour, and that shift has produced the first recurring revenue in the market. Companies holding both a revenue line and a survival record on a single architecture are better placed than those presenting a succession of improved prototypes, because the specification withdraws the transferability of performance evidence once a converter changes materially, so a developer that keeps redesigning restarts its own assessment each time.
SINN Power GmbH now presents photovoltaic and floating solar products with no wave energy offering, and NEMOS GmbH now supplies fibre-reinforced composite drive shafts and torsion bars rather than wave converters, so neither is treated as a participant in this market, and attrition of that kind continues to shape the supplier set.
Some of the key players operating in the wave energy converter market are Eco Wave Power Global AB, CorPower Ocean AB, Ocean Power Technologies, Inc., Carnegie Clean Energy Limited, AW-Energy Oy, Wave Swell Energy Limited, CalWave, Inc., Mocean Energy Limited, Oscilla Power, Inc., Weptos A/S, and Saipem S.p.A., among others.
- —
IEC TS 62600-100:2024 was published on 18 November 2024 as version 2.0, replacing the 2012 first version of the power performance assessment specification for electricity producing wave energy converters.
- Eco Wave Power Global AB
- CorPower Ocean AB
- Ocean Power Technologies, Inc.
- Carnegie Clean Energy Limited
- AW-Energy Oy
- Wave Swell Energy Limited
- CalWave, Inc.
- Mocean Energy Limited
- Oscilla Power, Inc.
- Weptos A/S
- Saipem S.p.A
Expert perspectives
The engineering in this market has been demonstrated repeatedly and the economics have not followed, and the reason is evidential rather than technical. Power performance can be established for a single device at a single location and transposed to another location under defined conditions, while the array configuration in which cost per megawatt hour would become competitive has no standardised assessment method at all. Infrastructure finance has no yield basis to underwrite, so capital comes from public programmes, strategic investors and offshore industry customers, and the scale at which the technology becomes economic sits on the far side of that gap.
Revenue through the forecast therefore accrues where energy is consumed rather than sold. Offshore equipment power, ocean observation, defence sensing and island supply all price against avoided vessel visits or delivered diesel rather than against a wholesale power price, and they fit the consent routes that reach operations quickest. Utility-scale deployment remains the largest segment on paper because demonstration projects connect to a grid, and the purpose of those installations is evidence rather than energy sales.
Repetition rather than refinement is what advances a developer in this market. Installed capital cost falls from one deployment to the next as fabrication, moorings and installation methods repeat, and a frozen design also keeps the transferability of performance evidence that the specification withdraws once a converter changes materially. Developers with two or more deployments of one architecture are better placed than those with a succession of improved prototypes, whatever the performance of the latest unit, because the funding case rests on a cost trajectory that only repetition can produce.
The market reaches USD 1.24 billion by 2036 from USD 98.0 million in 2026, so the growth rate compounds from a base small enough that a single array project moves the annual figure. Installed capacity grows faster than value because capital cost per kilowatt falls, which means capacity rather than revenue is the better measure of progress in this market. Survivability provision is sized for sea states that generate nothing, so a large share of device cost does not fall as energy capture improves. Standardisation of array yield assessment is the largest swing factor in the forecast, and a method that lenders accepted would change the financing position more than any reduction in device cost.
Growth in this market rests on duties that pay for continuity rather than for cheap energy, and it is paced by berth access, funding cycles and the evidence a developer can transfer between sites. Suppliers that deploy the same device repeatedly and earn revenue while doing so will hold the strongest position when array financing becomes available.
Customer perspectives
Head of Generation - island utility, Europe
We pay for diesel that arrives by ship, and in winter the weather decides whether it arrives at all. A wave machine does not have to beat the mainland power price, it has to beat what we are paying now, and that is a much easier test.
Delivered diesel rather than a wholesale power price sets the comparison at island and remote coastal sites, which is why island and remote community power at a CAGR of 27.4% is the application where a buyer contracts without public funding attached, and where supply security carries weight alongside cost.
Subsea Operations Manager - offshore energy operator, North Sea
Every battery change on a monitoring spread costs us a vessel day, and vessel days are what we are actually trying to remove. We are buying uninterrupted power at a location, not electricity by the megawatt hour.
Energy consumed at the point of generation avoids the grid connection and energy sale questions that slow utility projects, and avoided vessel visits support a device price that no energy buyer would accept, which is why offshore industry and ocean observation duties carry the fastest growth in this market.
Investment Director - infrastructure fund, Europe
We can underwrite one machine at one site because the assessment exists for that. Ask us to fund a farm and there is no accepted way to state what the farm will produce, so it is not an infrastructure asset yet.
The absence of a standardised method for array energy production keeps infrastructure capital out of this market and leaves public programmes and strategic investors funding every stage beyond a single unit, so the array configuration in which cost per megawatt hour would become competitive is the one that cannot yet be financed, and standards work rather than engineering has to resolve it.
Frequently asked questions
The market was valued at USD 78.0 million in 2025 and USD 62.0 million in 2024, and is estimated at USD 98.0 million in 2026.
Cite this report
Meticulous Research. (2026). Wave Energy Converter Market - Global Opportunity Analysis and Industry Forecast (2026-2036) (Report No. MREP - 1042465). Meticulous Market Research Pvt. Ltd. https://www.meticulousresearch.com/product/wave-energy-converter-market-7148