Grid-Enhancing Technologies Market (2026-2036)
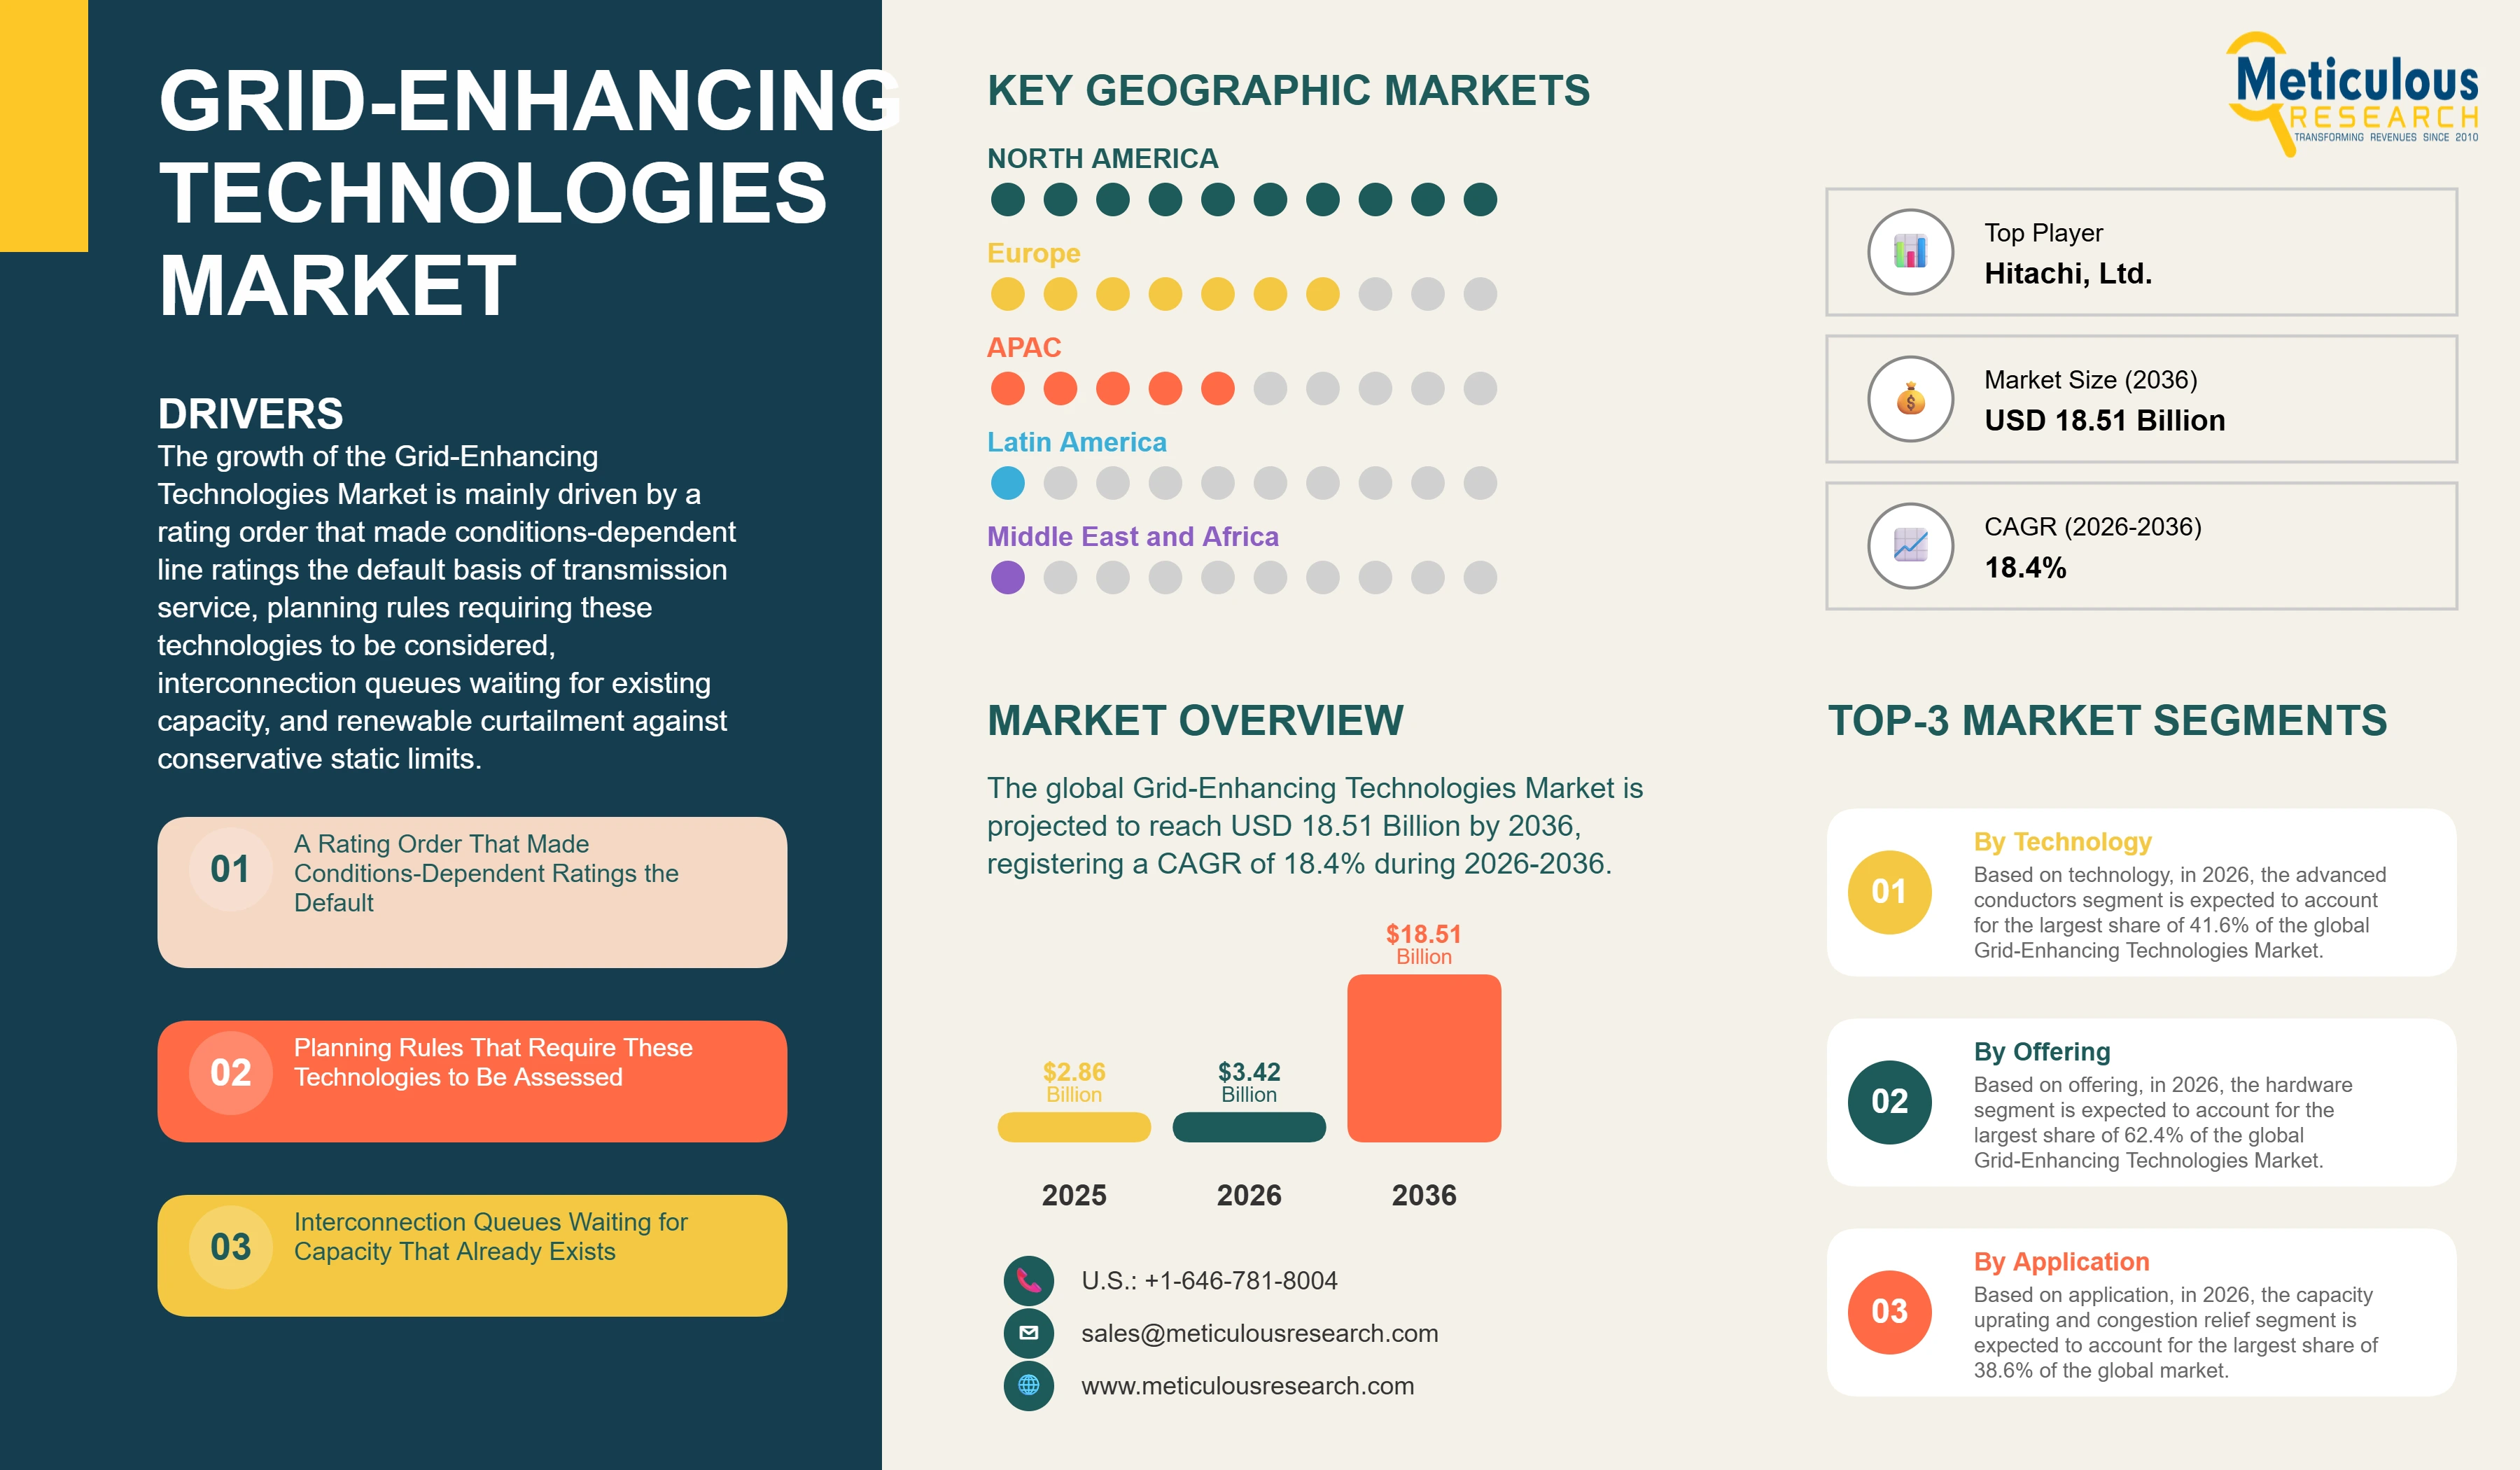
The global Grid-Enhancing Technologies Market was valued at USD 2.86 billion in 2025. This market is expected to reach USD 18.51 billion by 2036 from an estimated USD 3.42 billion in 2026, registering a CAGR of 18.4% during the forecast period (2026-2036).
- Published
- Nov 2026
- Pages
- 244
- Format
- PDF + Excel
- Report ID
- MREP - 1042459
- Base year
- 2025
- 2025 · BASELINE
- $2.86B
- 2036
- $18.51B
- CAGR 2026–2036
- 18.4%
2025 baseline · 2026–2036 forecast at 18.4% CAGR · hover a bar for the value
Key highlights
The market is valued at USD 3.42 billion in 2026 and is projected to reach USD 18.51 billion by 2036.
Compliance with the ambient-adjusted rating requirement fell due on 12 July 2025, so conditions-dependent ratings are now the operating norm rather than a pilot.
Advanced conductors, power flow control devices, dynamic line ratings and switching must now be considered in long-term planning for both new and existing facilities.
Dynamic line rating is the fastest-growing technology at a CAGR of 22.4%, as utilities add the wind and conductor measurement that ambient adjustment does not require.
Software grows faster than hardware, at 23.2% against 16.3%, as value moves from measurement to forecast ratings used in day-ahead markets.
Independent power producers and renewable developers are the fastest-growing buyer group at 21.2%, funding deployment on circuits they do not own.
Procurement is shifting from single devices to corridor-level congestion relief combining a rating uplift, a flow controller and a switching plan.
By technology, advanced conductors form the largest segment and dynamic line rating the fastest growing.
By offering, hardware forms the largest segment and software the fastest growing.
By application, capacity uprating and congestion relief forms the largest segment and renewable interconnection and curtailment reduction the fastest growing.
By voltage level, high voltage above 230 kV forms the largest segment and 69 kV to 230 kV the fastest growing.
By end user, transmission system operators and utilities form the largest segment and independent power producers and renewable developers the fastest growing.
By geography, North America forms the largest regional market and Asia-Pacific the fastest growing.
Report summary
| Particulars | Details |
|---|---|
| Forecast Period | 2026-2036 |
| Base Year | 2025 |
| Estimated Year | 2026 |
| CAGR (Value) | 18.4% |
| Format | PDF, Excel & Cloud Portal · 244 pages |
| Market Size (Value) in 2025 | USD 2.86 billion |
| Market Size (Value) in 2026 | USD 3.42 billion |
| Market Size (Value) in 2036 | USD 18.51 billion |
| Units | Value (USD million/billion) |
| Segments Covered | Technology, Offering, Application, Voltage Level, End User, and Geography |
| Countries Covered | North America (U.S., Canada), Europe (U.K., Germany, France, Spain, Italy, Nordic Countries, Rest of Europe), Asia-Pacific (China, India, Australia, Japan, South Korea, Rest of Asia-Pacific), Latin America (Brazil, Chile, Mexico, Rest of Latin America), Middle East & Africa (Saudi Arabia, UAE, South Africa, Rest of Middle East & Africa) |
| Scope Inclusions | Technologies and services that raise the usable capacity of existing transmission and sub-transmission infrastructure, comprising advanced conductors including composite-core and carbon-fibre-core designs, dynamic line rating covering ambient-adjusted and fully dynamic ratings with conductor-mounted and non-contact sensing and rating software, advanced power flow control including modular and substation-based series impedance injection, and topology optimization software; supplied as hardware, software and services covering headroom studies, protection and relay coordination review, energy management system integration, pilot validation and staged commissioning; applied to capacity uprating and congestion relief, renewable interconnection and curtailment reduction, reliability and contingency management and deferral of new transmission build; across voltages above 230 kV, 69 kV to 230 kV and below 69 kV; and across transmission system operators and utilities, independent power producers and renewable developers, industrial and large consumers, and regulators, planners and system studies |
| Scope Exclusions | New transmission line construction and new circuit additions, conventional conductor and overhead line hardware supplied without a capacity-enhancing design, high-voltage direct current transmission systems and converter stations, substation transformers, switchgear, breakers and protection relays supplied as ordinary asset replacement, battery energy storage and generation assets used to relieve congestion, grid-forming inverters and power conversion equipment, distribution automation and advanced metering infrastructure, vegetation management and line inspection services, and congestion revenue, curtailment compensation and market settlement payments received by asset owners or generators |
| Key Companies | Hitachi, Ltd., Siemens Energy AG, GE Vernova Inc., Schneider Electric SE, Mitsubishi Electric Corporation, Prysmian S.p.A., Nexans S.A., Southwire Company, LLC, CTC Global Corporation, NKT A/S, LS Cable & System Ltd., Sumitomo Electric Industries, Ltd., TS Conductor Corp., Smart Wires Inc., LineVision, Inc., Ampacimon SA, Heimdall Power AS, and NewGrid, Inc. |
Report overview
Market value is measured in USD million/billion. Segments covered: technology, offering, application, voltage level, end user. Regions: North America, Europe, Asia-Pacific, Latin America, Middle East & Africa.
The growth of this market is mainly driven by a rating order that made a conditions-dependent line rating the default basis of transmission service and whose compliance deadline has already passed, by planning rules that require advanced conductors, power flow control devices, dynamic line ratings and switching to be considered for both new and existing facilities rather than merely permitted, by interconnection queues in which projects wait years for capacity that existing circuits could carry under favourable conditions, by the cost and duration of new transmission build that makes uprating an existing corridor the only option available inside a project timeline, and by renewable output curtailed against thermal limits set on conservative static assumptions. A transmission line carries far more current on a cold windy night than on a still summer afternoon, and the static rating that governed its use was set for the worst case rather than the actual one.
However, factors such as cost recovery that returns a utility a regulated margin on capital expenditure and therefore rewards building a new line over uprating an existing one, operator confidence in a rating that varies hour to hour and depends on sensors and forecasts rather than on a fixed table, protection and relay coordination that must be reviewed whenever a circuit is permitted to carry more current, and planning and market software that was built around static ratings and cannot always represent a varying limit are expected to restrain the growth of this market to some extent. The capability raises the capacity of the network at a fraction of the cost of new build, which is precisely why the parties who would pay for it earn less from deploying it.
Grid-enhancing technologies raise the usable capacity of existing transmission infrastructure rather than adding new corridors, through conductors that carry more current at the same sag, through ratings that follow actual conditions, through devices that push power onto underused circuits and through reconfiguration of the network itself. A static rating is set against high ambient temperature, low wind and full solar intensity, a combination that occurs for a small number of hours a year, so a circuit spends most of the year able to carry more than its rating permits. The regulatory step that made that headroom usable is Order No. 881 of the Federal Energy Regulatory Commission, approved on 16 December 2021 with a compliance implementation deadline of 12 July 2025, under which transmission providers including independent system operators and regional transmission organizations must develop and implement ambient-adjusted ratings for the transmission lines they serve, apply hourly ambient-adjusted ratings to near-term requests falling within ten days for both point-to-point and network service, and calculate those ratings separately for daytime and nighttime with no solar heating assumed at night. In addition, the same order requires a minimum of four seasonal ratings to be used for longer-term point-to-point requests that end more than ten days in the future, which establishes a rating that varies with conditions as the default basis for transmission service rather than a single conservative static value applied year round, and the hourly requirement applies to the near-term window in which congestion actually binds.
An ambient-adjusted rating varies with air temperature and is calculated separately for day and night, which captures part of the available headroom from data a utility already holds. A dynamic line rating adds wind speed and direction, solar intensity and usually direct measurement of the conductor, which captures the remainder and is worth more because wind cooling dominates the thermal balance of an overhead conductor. The order mandates the first and leaves the second voluntary, so compliance established the data pathways, the operational habit and the regulatory precedent for a varying rating without requiring the sensors that deliver most of the benefit, which is why the next step is an increment rather than a transformation.
Under Order No. 1920 on long-term regional transmission planning, under which transmission providers must engage in regional long-term planning to identify transmission needs, develop processes and criteria for selecting facilities to meet them and file ex ante cost allocation methods, and must develop at least three distinct long-term scenarios using a planning horizon of at least 20 years, reviewed and updated at least once every five years, with each scenario incorporating seven factors and including a sensitivity for uncertain operational outcomes such as sustained outages during extreme weather, and that rule requires facilities to be evaluated using seven benefits and requires the consideration of advanced conductors, power flow control devices, dynamic line ratings and switching for both new and existing facilities, which places these technologies inside the planning process as options that must be assessed rather than as alternatives a planner may choose to examine. Requiring consideration rather than adoption still changes the market, because a planner who must assess a power flow controller against a new circuit has to obtain a cost, a performance characteristic and a study for it, and extending the requirement to existing facilities brings uprating into a cycle that previously considered only new build.
The four technologies in this set occupy different commercial positions rather than competing directly for the same budget. Advanced conductors roughly double current-carrying capability on the same towers and are installed during reconductoring, so they are rate-based capital fitting existing cost recovery without modification, which is why they hold the largest share. Dynamic line rating and power flow control require modest capital and deliver most of their value through dispatch, which is where cost recovery works against them. Topology optimisation requires no equipment at all, using switches already installed, so there is nothing to rate-base and no hardware margin, which confines it to buyers measured on congestion rather than on capital deployed.
A utility that builds a line adds the capital to its rate base and earns an authorised return on it for decades, while one that installs sensors and software spends a fraction of that sum, earns a return on a fraction of the capital and reduces the congestion revenue arising in its own system. Shared savings arrangements, performance incentives and requirements to assess alternatives have begun to address this constraint, which no technical improvement addresses, and deployment has advanced faster where a system operator rather than an asset owner takes the decision.
A utility or operator commissions an assessment of where headroom exists, what it is worth in avoided congestion or curtailment and what protection, control and process changes are required to use it, and that business case determines both whether anything is bought and which technology is chosen, so procurement here follows a study rather than a specification. Operators then adopt in stages, from monitoring alongside the static rating to advisory use and only then to real-time dispatch, so revenue from a single relationship is recognised across several years rather than at the point of sale.
Geographic distribution follows where congestion is priced and where interconnection queues are longest. North America holds the largest share because the rating order established a compliance baseline across the whole interconnected system, because locational pricing makes congestion visible and quantified and because interconnection backlogs are the most severe in the world. Europe follows on connection queues, offshore and cross-border constraints and frameworks that reward network efficiency alongside capital. Asia-Pacific grows fastest on renewable capacity reaching corridors designed for a different generation pattern.
In 2026, the advanced conductors segment is expected to account for the largest share of 41.6% of the global grid-enhancing technologies market, valued at USD 1,422.7 million. The large share of this segment is mainly due to a capital cost per circuit kilometre that is an order of magnitude above the sensor and software categories, and to its alignment with existing cost recovery, since a composite-core or carbon-fibre-core conductor installed during a reconductoring project is rate-based capital earning an authorised return in the ordinary way. Ageing overhead networks requiring replacement regardless of capacity need also make the incremental decision only which conductor to install rather than whether to invest. However, the dynamic line rating segment, valued at USD 848.2 million in 2026 and accounting for a share of 24.8%, is projected to register the highest CAGR of 22.4% during the forecast period. The rapid growth of this segment is attributed to a compliant population that already operates ambient-adjusted ratings and must now add the wind and conductor measurement that captures most of the remaining headroom, and to curtailment reduction that is measurable in megawatt hours and therefore the easiest benefit in this market to quantify.
Advanced power flow control accounts for USD 731.9 million in 2026 at a CAGR of 18.6%, addressing the parallel path problem in which one circuit saturates while an adjacent path runs below its rating, and valued against the cost of the circuit that would otherwise be built. Topology optimization accounts for USD 417.2 million at 20.8%, the second fastest growth in this dimension, because it requires no equipment at all and uses breakers and switches already installed, so the benefit appears immediately in dispatch cost. That same absence of an asset limits the segment, since there is nothing to rate-base and no hardware margin, which confines it to system operators and a small number of utilities measured on congestion rather than on capital deployed.
In 2026, the hardware segment is expected to account for the largest share of 62.4% of the global grid-enhancing technologies market, valued at USD 2,134.1 million. The large share of this segment is mainly due to the weight of advanced conductors within the technology mix, and to the sensors, series impedance injection devices, communications equipment and substation plant that every deployment other than topology optimization requires. However, the software segment, valued at USD 738.7 million in 2026 and accounting for a share of 21.6%, is projected to register the highest CAGR of 23.2% during the forecast period. The rapid growth of this segment is attributed to the shift of differentiating content from the sensor toward the forecasting and probabilistic analysis built on top of it, since a rating realised in the day-ahead market is worth considerably more than one realised in real time, and to portfolio-wide headroom assessment that works from data a utility already holds without new instruments.
Services account for USD 547.2 million in 2026 at a CAGR of 20.2%, covering headroom studies, protection and relay coordination review, energy management system integration, pilot validation and the staged commissioning that moves a utility from monitoring in parallel with the static rating to real-time dispatch. The services content exceeds the equipment margin in the sensor and software categories, because procurement in this market follows a study rather than a specification and because each stage of operational acceptance requires its own validation and sign-off.
In 2026, the capacity uprating and congestion relief segment is expected to account for the largest share of 38.6% of the global grid-enhancing technologies market, valued at USD 1,320.1 million. The large share of this segment is mainly due to congestion cost that is visible and quantified wherever locational pricing applies, which gives an operator a figure against which to justify expenditure without any further analysis, and to the applicability of every technology in the set to this purpose. However, the renewable interconnection and curtailment reduction segment, valued at USD 937.1 million in 2026 and accounting for a share of 27.4%, is projected to register the highest CAGR of 20.6% during the forecast period. The rapid growth of this segment is attributed to the coincidence between the hours of greatest curtailment risk and the hours of greatest available headroom, since wind generation peaks when wind is cooling the conductor, and to developers that capture the benefit directly as a connection date and are therefore willing to fund deployment on assets they do not own.
Reliability and contingency management accounts for USD 677.2 million in 2026 at a CAGR of 17.2%, where a varying rating and a controllable power flow give an operator options during an outage or a contingency that a static limit does not, and deferral of new transmission build accounts for USD 485.6 million at 18.2%, bought where a corridor requires more capacity than it has and where permitting and construction timescales for a new circuit exceed the period in which the capacity is needed. The deferral case is the strongest technically and the weakest commercially, because the party that would avoid the capital expenditure is the party that would have earned a return on it.
In 2026, the high voltage above 230 kV segment is expected to account for the largest share of 48.6% of the global grid-enhancing technologies market, valued at USD 1,662.1 million. The large share of this segment is mainly due to the concentration of bulk transfer and interregional congestion at these voltages, where a single constrained circuit affects the dispatch of an entire region, and to the value of released capacity being proportional to the power the circuit carries. However, the 69 kV to 230 kV segment, valued at USD 1,244.9 million in 2026 and accounting for a share of 36.4%, is projected to register the highest CAGR of 19.6% during the forecast period. The rapid growth of this segment is attributed to interconnection queues in which the limiting constraint for a renewable project is far more often a sub-transmission circuit than a bulk transfer path, and to a far larger circuit population at these voltages, which supports portfolio-scale deployment once the per-circuit cost of assessment falls.
The distribution segment below 69 kV accounts for USD 513.0 million in 2026 at a CAGR of 18.8%, driven by distributed generation and electrification loads reaching circuits designed for neither, and by the same headroom logic applied at a voltage where the per-circuit value is small but the circuit count is very large. Deployment here depends more on analytics that work from existing data than on instrumentation, because the value released on any single circuit will not support the cost of sensors.
In 2026, the transmission system operators and utilities segment is expected to account for the largest share of 68.4% of the global grid-enhancing technologies market, valued at USD 2,339.3 million. The large share of this segment is mainly due to ownership of the assets on which every technology in the set is installed and to the rating and planning obligations that fall on transmission providers directly, which makes compliance work and the assessment of alternatives their responsibility rather than anyone else. However, the independent power producers and renewable developers segment, valued at USD 636.1 million in 2026 and accounting for a share of 18.6%, is projected to register the highest CAGR of 21.2% during the forecast period. The rapid growth of this segment is attributed to interconnection queue positions in which a thermal constraint on a circuit the developer does not own delays a connection date by years, which gives the developer a quantified interest in relieving it and routes the purchase around the cost recovery asymmetry that restrains asset owners.
Industrial and large consumers account for USD 266.8 million in 2026 at a CAGR of 18.4%, concentrated in facilities seeking additional supply capacity at an existing connection point rather than a new one, including data centre and electrified industrial loads. Regulators, planners and system studies account for USD 177.8 million at 19.6%, covering the assessment work that planning rules now require and the independent analysis commissioned where a utility proposal to build is tested against an alternative, which is a buyer category that did not exist in a meaningful form before the requirement to consider these technologies was imposed.
Order No. 881 of the Federal Energy Regulatory Commission, approved on 16 December 2021 with a compliance implementation deadline of 12 July 2025, requires transmission providers including independent system operators and regional transmission organizations to develop and implement ambient-adjusted ratings for the transmission lines they serve, to apply hourly ambient-adjusted ratings to near-term requests falling within ten days for both point-to-point and network service, to calculate those ratings separately for daytime and nighttime with no solar heating assumed at night, and to use a minimum of four seasonal ratings for longer-term point-to-point requests ending more than ten days in the future.
It requires ambient-adjusted ratings, which vary with air temperature and are calculated separately for day and night, rather than fully dynamic ratings. A dynamic line rating additionally accounts for wind speed and direction, solar intensity and in most implementations direct measurement of conductor tension, sag or temperature, which captures the remaining headroom and is worth more because wind cooling dominates the thermal balance of an overhead conductor. The compliant population therefore operates varying ratings without the sensors that deliver most of the available benefit, which is why dynamic line rating is the fastest-growing technology segment in this market.
Order No. 1920 on long-term regional transmission planning requires transmission providers to engage in regional long-term planning, to develop at least three distinct long-term scenarios using a planning horizon of at least 20 years reviewed and updated at least once every five years, with each scenario incorporating seven factors and a sensitivity for uncertain operational outcomes such as sustained outages during extreme weather, and to evaluate facilities using seven benefits. It requires the consideration of advanced conductors, power flow control devices, dynamic line ratings and switching for both new and existing facilities.
North America is expected to account for the largest share of 42.6% of the market in 2026, valued at USD 1,456.9 million, with the U.S. valued at USD 1,327.0 million and Canada at USD 130.0 million.
Asia-Pacific is projected to record the highest CAGR of 20.4% during the forecast period, accounting for a share of 20.6% of the market in 2026, valued at USD 704.5 million, with China the largest country market in the region and India the fastest growing.
The European grid-enhancing technologies market is valued at USD 971.3 million in 2026 and is projected to grow at a CAGR of 18.2% during the forecast period. The United Kingdom and Germany are the largest country markets, with the United Kingdom further advanced in operational deployment of varying ratings and power flow control and Germany larger in reconductoring volume, and demand across the region is led by connection queues that have become the limiting factor on renewable deployment in several countries.
Latin America and the Middle East & Africa are expected to account for shares of 4.6% and 3.8% of the market in 2026, valued at USD 157.3 million and USD 130.0 million respectively. Latin America is projected to record a CAGR of 18.8% with Brazil and Chile carrying most of the activity on long transmission distances and high renewable penetration in weak corridors, while the Middle East & Africa is projected to record a CAGR of 19.4%, with Saudi Arabia and the United Arab Emirates the largest markets and South Africa the largest market in Africa.
Some of the key players operating in the grid-enhancing technologies market are Hitachi, Ltd., Siemens Energy AG, GE Vernova Inc., Schneider Electric SE, Mitsubishi Electric Corporation, Prysmian S.p.A., Nexans S.A., Southwire Company, LLC, CTC Global Corporation, NKT A/S, LS Cable & System Ltd., Sumitomo Electric Industries, Ltd., TS Conductor Corp., Smart Wires Inc., LineVision, Inc., Ampacimon SA, Heimdall Power AS, and NewGrid, Inc., among others. In 2025, the eighteen profiled companies accounted for an estimated 72.8% of the market, and the five largest for 34.6%.
Report infographic
Market dynamics
15 factors across 5 forcesA Rating Order That Made Conditions-Dependent Ratings the Default
Under Order No. 881 of the Federal Energy Regulatory Commission, approved on 16 December 2021 with a compliance implementation deadline of 12 July 2025, under which transmission providers including independent system operators and regional transmission organizations must develop and implement ambient-adjusted ratings for the transmission lines they serve, apply hourly ambient-adjusted ratings to near-term requests falling within ten days for both point-to-point and network service, and calculate those ratings separately for daytime and nighttime with no solar heating assumed at night, and the same order requires a minimum of four seasonal ratings to be used for longer-term point-to-point requests that end more than ten days in the future, which establishes a rating that varies with conditions as the default basis for transmission service rather than a single conservative static value applied year round. Requiring hourly ratings in the near-term window and seasonal ratings beyond it removed the single static value as the basis of transmission service across an entire interconnected system, and the compliance deadline of 12 July 2025 means the work of acquiring ambient data, building the calculation into rating processes and reflecting a varying limit in market systems has already been done rather than being a future project. The commercial consequence is that the organisational and software obstacles to a varying rating were cleared for ambient adjustment and need not be cleared again for full dynamic rating, which converts the next step from a transformation into an increment. Suppliers of sensors and rating software are therefore selling into utilities that already operate varying ratings rather than into ones that must be persuaded that the concept is workable.
Planning Rules That Require These Technologies to Be Assessed
Through Order No. 1920 on long-term regional transmission planning, under which transmission providers must engage in regional long-term planning to identify transmission needs, develop processes and criteria for selecting facilities to meet them and file ex ante cost allocation methods, and must develop at least three distinct long-term scenarios using a planning horizon of at least 20 years, reviewed and updated at least once every five years, with each scenario incorporating seven factors and including a sensitivity for uncertain operational outcomes such as sustained outages during extreme weather, and that rule requires facilities to be evaluated using seven benefits and requires the consideration of advanced conductors, power flow control devices, dynamic line ratings and switching for both new and existing facilities, which places these technologies inside the planning process as options that must be assessed rather than as alternatives a planner may choose to examine. A planner obliged to consider a power flow control device or a dynamic line rating against a new circuit must obtain a cost, a performance characteristic and a study for it, which gives suppliers access to a process they were previously outside and establishes a comparison that the alternative frequently loses on cost per megawatt of relief. Extending the requirement to existing facilities matters more than extending it to new ones, because uprating an existing corridor had no place in a planning cycle built around new build. The twenty-year horizon, the three distinct scenarios and the five-yearly review also mean the assessment recurs rather than occurring once, so a supplier admitted to the process stays in it.
Interconnection Queues Waiting for Capacity That Already Exists
Generation projects wait years in interconnection queues for network capacity, and the studies that hold them there frequently identify a thermal constraint on an existing circuit evaluated against a static rating. Where measured headroom exists, relieving that constraint through a rating change, a power flow controller or a switching action releases capacity in months rather than the years a new circuit requires, and the developer rather than the transmission owner captures the benefit directly in the form of a connection date. That alignment of benefit with a party willing to pay is why independent power producers and renewable developers have become the fastest-growing buyer group in this market, funding studies and in some cases equipment on circuits they do not own in order to shorten their own queue position.
Curtailment Against Limits Set on Conservative Assumptions
Wind and solar output is curtailed when a circuit reaches its thermal limit, and that limit is a static value set against high ambient temperature, low wind and full solar intensity, a combination that rarely coincides with the hours in which renewable output is highest. Wind generation in particular peaks when wind is cooling the conductor, so the hours of greatest curtailment risk are the hours of greatest available headroom, and the coincidence is strongest on lines running across prevailing winds in cooler regions where wind capacity concentrates. Curtailed energy is measurable in megawatt hours and in lost revenue, which makes this the easiest benefit in the market to quantify and the one most often used to justify a first deployment.
Table of contents
13 chapters · 171 sections · 244 pages · click to expandSegmental analysis
| Segment | Largest share (2026) | Fastest growth (2026–2036) |
|---|---|---|
| By Technology | Advanced conductors | Dynamic line rating |
| By Offering | Hardware | Software |
| Other segments | Capacity uprating and congestion relief | Renewable interconnection and curtailment reduction |
By Technology
- This market is segmented by technology, offering, application, voltage level and end user, and each dimension reflects a different part of how network capacity is released from existing infrastructure.
- The advanced conductors segment is expected to account for the largest share of 41.6% of the market in 2026, valued at USD 1,422.7 million, followed by dynamic line rating at 24.8% and USD 848.2 million and advanced power flow control at 21.4% and USD 731.9 million.
- The dynamic line rating segment is projected to record the highest CAGR of 22.4% during the forecast period, accounting for a share of 24.8% of the market in 2026, valued at USD 848.2 million, with topology optimization next at 20.8% and advanced power flow control at 18.6%.
By Offering
- The hardware segment is expected to account for the largest share of 62.4% of the market in 2026, valued at USD 2,134.1 million, with software at 21.6% and USD 738.7 million and services at 16.0% and USD 547.2 million.
- The software segment is projected to record the highest CAGR of 23.2% during the forecast period, accounting for a share of 21.6% of the market in 2026, valued at USD 738.7 million, with services next at 20.2% and hardware at 16.3%.
Other segments
- The capacity uprating and congestion relief segment is expected to account for the largest share of 38.6% of the market in 2026, valued at USD 1,320.1 million, followed by renewable interconnection and curtailment reduction at 27.4% and USD 937.1 million.
- The renewable interconnection and curtailment reduction segment is projected to record the highest CAGR of 20.6% during the forecast period, accounting for a share of 27.4% of the market in 2026, valued at USD 937.1 million, with deferral of new transmission build next at 18.2%.
- The high voltage above 230 kV segment is expected to account for the largest share of 48.6% of the market in 2026, valued at USD 1,662.1 million, with 69 kV to 230 kV at 36.4% and USD 1,244.9 million and below 69 kV at 15.0% and USD 513.0 million.
- The 69 kV to 230 kV segment is projected to record the highest CAGR of 19.6% during the forecast period, accounting for a share of 36.4% of the market in 2026, valued at USD 1,244.9 million, with below 69 kV next at 18.8% and above 230 kV at 17.4%.
- The transmission system operators and utilities segment is expected to account for the largest share of 68.4% of the market in 2026, valued at USD 2,339.3 million, followed by independent power producers and renewable developers at 18.6% and USD 636.1 million.
- The independent power producers and renewable developers segment is projected to record the highest CAGR of 21.2% during the forecast period, accounting for a share of 18.6% of the market in 2026, valued at USD 636.1 million, with regulators, planners and system studies next at 19.6%.
Geographic analysis
North America
Largest shareIn 2026, North America is expected to account for the largest share of 42.6% of the global grid-enhancing technologies market, valued at USD 1,456.9 million, of which the U.S. accounts for USD 1,327.0 million and Canada for USD 130.0 million. The large share of this region is mainly due to a rating order that established a compliance baseline for conditions-dependent ratings across the entire interconnected system with a deadline of 12 July 2025, to planning rules that require advanced conductors, power flow control devices, dynamic line ratings and switching to be considered for both new and existing facilities, and to locational marginal pricing that makes congestion cost visible and quantified so that a business case can be built from published data. Interconnection queue backlogs in the region are also the most severe in the world, which is what brings developers into the market as buyers alongside utilities.
Europe
Europe is expected to account for 28.4% of the market in 2026, valued at USD 971.3 million, at a CAGR of 18.2% during the forecast period. Demand is led by connection queues that have become the limiting factor on renewable deployment in several countries, by offshore and cross-border transfer constraints and by regulatory frameworks that reward network efficiency and output alongside capital, which weakens the incentive asymmetry that holds back deployment elsewhere. The United Kingdom and Germany are the largest country markets, with the United Kingdom further advanced in operational deployment of varying ratings and power flow control and Germany larger in reconductoring volume, and Nordic and Iberian demand is concentrated on corridors carrying high renewable output.
Asia-Pacific
Fastest growthAsia-Pacific is expected to account for 20.6% of the market in 2026, valued at USD 704.5 million, and is projected to register the highest CAGR of 20.4% during the forecast period. China is the largest country market in the region and India the fastest growing, on renewable capacity being commissioned faster than transmission corridors designed for a different generation pattern can absorb, which produces curtailment that uprating addresses within a project timeline where new build does not. Australia contributes demand disproportionate to its size on long radial corridors carrying high renewable output into weak network areas, and Japan and South Korea contribute advanced conductor manufacturing capability alongside domestic reconductoring programmes.
Latin America
Latin America is expected to account for 4.6% of the market in 2026, valued at USD 157.3 million, at a CAGR of 18.8%, with Brazil and Chile carrying most of the activity on long transmission distances and high renewable penetration in weak corridors, and with auction-based transmission procurement in Brazil creating a route for uprating to compete against new build on cost.
Middle East & Africa
The Middle East & Africa is expected to account for 3.8% of the market in 2026, valued at USD 130.0 million, at a CAGR of 19.4%, with Saudi Arabia and the United Arab Emirates the largest markets on very large new-build renewable programmes reaching existing corridors, and South Africa the largest market in Africa, where transmission capacity rather than generation capacity has become the limiting factor on new connections.
Competitive landscape
Conductor manufacturers hold the largest positions because advanced conductors carry the greatest capital value in this market. CTC Global Corporation established the composite-core category and holds the deepest installed reference base, TS Conductor Corp. competes on carbon-fibre-core designs, and Prysmian S.p.A., Nexans S.A., Southwire Company, LLC, NKT A/S, LS Cable & System Ltd. and Sumitomo Electric Industries, Ltd. supply advanced conductors alongside conventional ranges into reconductoring programmes, where the competition is against their own conventional products as much as against each other.
Power system equipment groups compete on power flow control and on the control room integration every deployment requires. Hitachi, Ltd., Siemens Energy AG, GE Vernova Inc., Mitsubishi Electric Corporation and Schneider Electric SE supply series compensation and flexible transmission equipment, energy management systems and the network analysis software in which a varying rating must be represented, and that position in the control room is what allows them to sell a corridor solution rather than a device. Smart Wires Inc. competes specifically on modular series impedance injection deployed on towers rather than in substations, which shortens installation and avoids substation work.
Specialists hold the sensor and analytics positions and compete on measurement method and on validated results rather than on breadth. LineVision, Inc. supplies non-contact monitoring installed without a line outage, Ampacimon SA supplies conductor-mounted measurement with a long European operating record, Heimdall Power AS supplies conductor-mounted sensors installed by drone, and NewGrid, Inc. supplies topology optimisation software that requires no equipment at all. Competition across the market is decided by whether a supplier can produce the headroom study, integrate with the energy management system and evidence a result on a pilot circuit, because procurement here follows a study rather than a specification, and that requirement favours participants with prior utility references over those with better instruments. Acquisition rather than independent scaling is the likely route for the specialists, since the equipment groups already hold the control room position and the utility relationships that a corridor-level tender requires, and they lack only the measurement and optimisation capability the specialists have built, which is the capability a corridor-level tender now requires.
- —
Recent developments include the movement of utilities that completed rating compliance from instrumenting individual circuits toward portfolio-wide headroom assessment using data already held, the shift of differentiating content from real-time measurement toward forecast ratings that combine weather prediction with conductor models and a stated confidence level for use in day-ahead markets, and the procurement of congestion relief on a defined corridor combining a rating uplift, a power flow controller and a switching strategy rather than the purchase of a single named device.
- Hitachi, Ltd.
- Siemens Energy AG
- GE Vernova Inc.
- Schneider Electric SE
- Mitsubishi Electric Corporation
- Prysmian S.p.A
- Nexans S.A.
- Southwire Company, LLC
- CTC Global Corporation
- NKT A/S
- LS Cable & System Ltd.
- Sumitomo Electric Industries, Ltd.
- TS Conductor Corp.
- Smart Wires Inc.
- LineVision, Inc.
- Ampacimon SA
- Heimdall Power AS
- NewGrid, Inc
Expert perspectives
The physics in this market has never been in doubt, and the rating order that made conditions-dependent ratings the default across an entire interconnected system has already passed its compliance deadline, so the constraint on this market is regulatory economics rather than engineering. What remains unresolved is that a transmission owner earns an authorised return on a new line and almost nothing on the sensors that would avoid it. The binding constraint is therefore shifting from technical capability to who captures the benefit, since the capacity exists and the party able to release it is rarely the party that gains from doing so.
Spending will move toward software, toward full dynamic ratings and toward buyers outside the transmission owner. Software grows fastest among offerings at 23.2%, because value has moved from the sensor to the forecast, a day-ahead rating being worth more than a real-time one. Dynamic line rating grows fastest among technologies at 22.4%, because a compliant population already operates varying ratings and needs only the wind and conductor measurement that was never mandated. Developers grow fastest among buyers at 21.2%, because a connection date delayed by a constraint on another party asset is a loss they can quantify and will spend against.
For companies planning entry or expansion, the question is whether to sell an asset or an outcome. Advanced conductors sell as capital into reconductoring programmes that proceed on an asset replacement cycle whatever the capacity need, and that is the one part of this market independent of regulatory reform. Everything else sells as an outcome, which requires the headroom study, the protection review, the control room integration and a validated pilot before any equipment decision, and a supplier unable to furnish all of those does not reach the decision at all.
Four qualifications bear directly on how the growth in this market should be read. First, the rating order mandates ambient adjustment rather than full dynamic rating, so treating the compliant population as a deployed base would overstate the market considerably. Second, headroom identified is not capacity delivered, because raising a conductor limit moves the constraint to a transformer, a breaker or a single span clearance. Third, cost recovery still rewards building over optimising in most jurisdictions, so part of this forecast depends on mechanisms being designed rather than on supplier action. Fourth, operational acceptance proceeds in stages, so reported growth lags contracted growth.
Overall, this market grows because new transmission cannot be built at the pace demand and renewable connection now require while the capacity already in the ground is used conservatively, and the participants that capture the growth will be those able to evidence a delivered result on an operating circuit.
Customer perspectives
Cost recovery that rewards new capital over optimisation is the reason deployment lags the available capability, and it is why software grows at a CAGR of 23.2% against 16.3% for hardware while the market as a whole grows at 18.4%.
A connection date delayed by a constraint on a third-party asset is a loss a developer can put a figure on, which routes the purchase around the asset owner and underpins the 21.2% CAGR projected for independent power producers and renewable developers and the 20.6% CAGR projected for renewable interconnection and curtailment reduction.
Corridor-level procurement rather than device-level purchasing favours suppliers able to assemble more than one technology, and it is the mechanism behind the 20.8% CAGR projected for topology optimization and the 18.6% CAGR projected for advanced power flow control.
“We finished the rating compliance work, so the capability is already running. The problem is not the technology, it is the business case. We earn a return on a new line for thirty years and almost nothing on a programme that costs a hundredth as much, and until the regulator changes that we will keep choosing the line.”
“Our project is held up by a constraint on a circuit we do not own and never will. Every year we wait is a year of revenue we do not get back, so we paid for the assessment ourselves and we have offered to fund the equipment. It is simply cheaper than waiting.”
“Relieving one line just moves the problem down the corridor, so we stopped buying devices and started buying congestion relief on a defined corridor. Whoever can put the whole package together wins the work, and we judge it on what it saves us in dispatch cost.”
Frequently asked questions
The global grid-enhancing technologies market is valued at USD 3.42 billion in 2026, up from USD 2.86 billion in 2025 and USD 2.38 billion in 2024.
Cite this report
Meticulous Research. (2026). Grid-Enhancing Technologies Market - Global Opportunity Analysis and Industry Forecast (2026-2036) (Report No. MREP - 1042459). Meticulous Market Research Pvt. Ltd. https://www.meticulousresearch.com/product/grid-enhancing-technologies-market-7142