Transformer Monitoring Market (2026-2036)
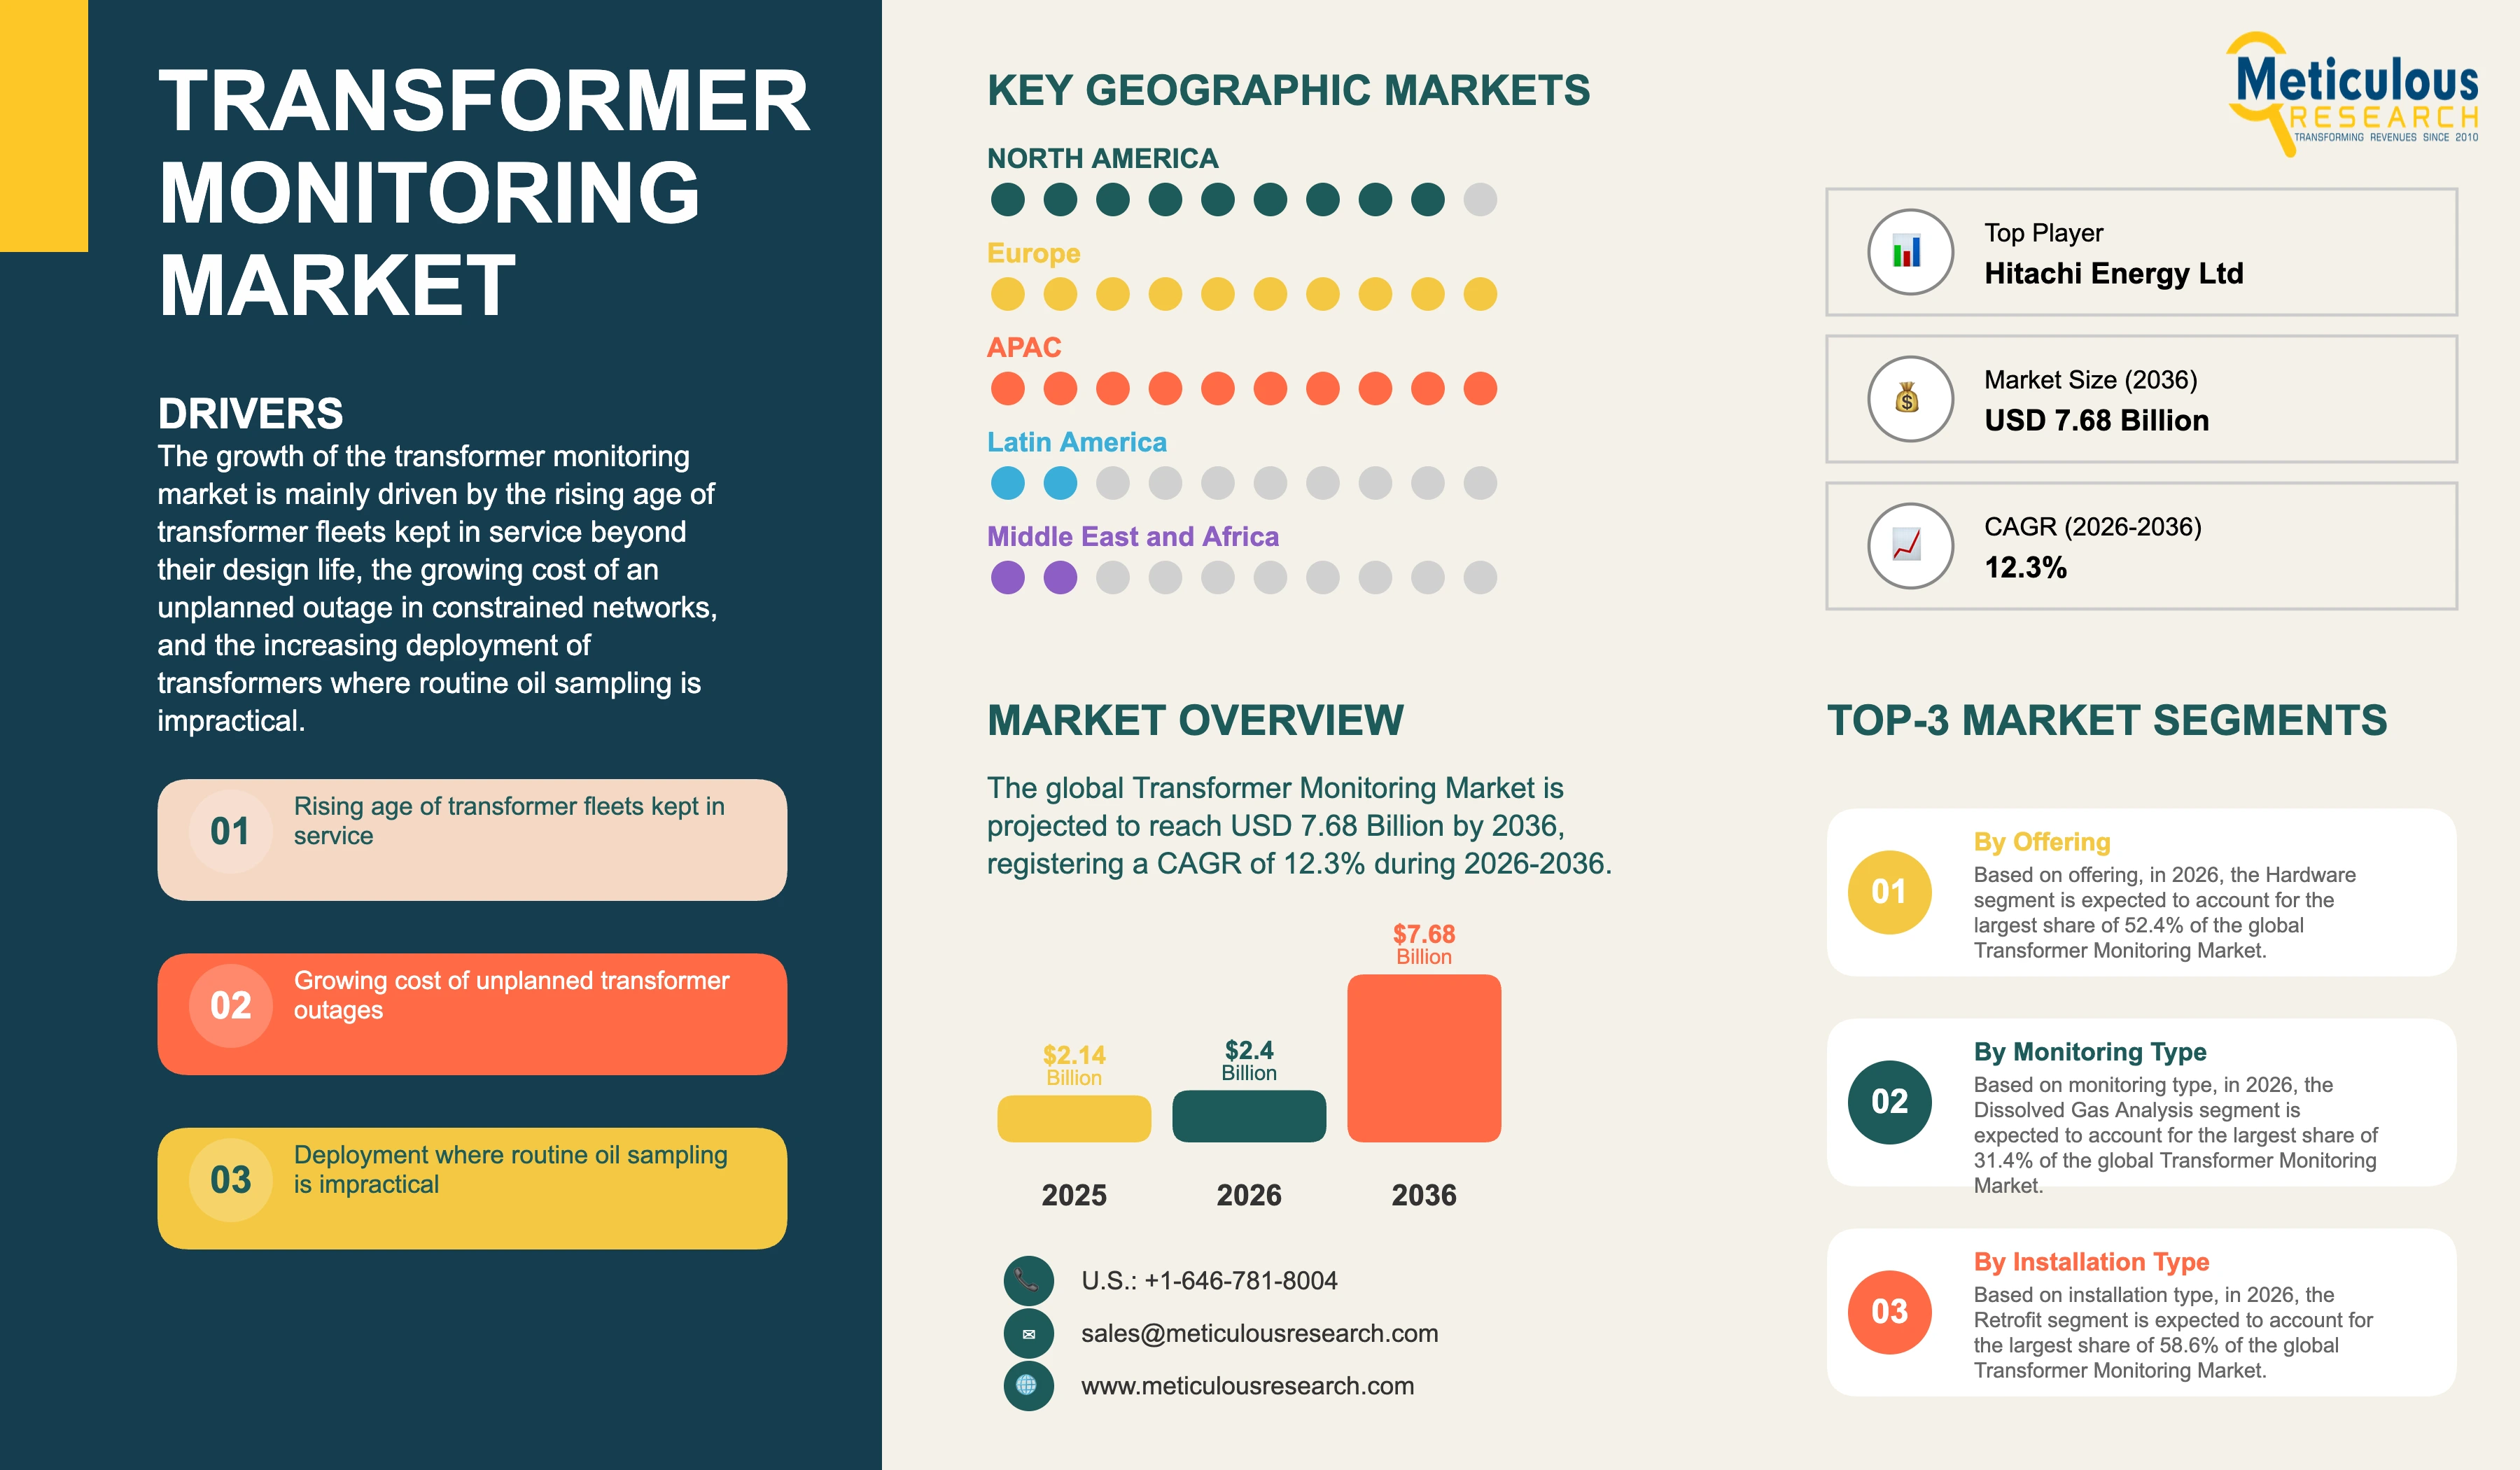
The global transformer monitoring market was valued at USD 2.14 billion in 2025. This market is expected to reach USD 7.68 billion by 2036 from an estimated USD 2.40 billion in 2026, registering a CAGR of 12.3% during the forecast period (2026-2036).
- Published
- Nov 2026
- Pages
- 302
- Format
- PDF + Excel
- Report ID
- MREP - 1042468
- Base year
- 2025
- 2025 · BASELINE
- $2.14B
- 2036
- $7.68B
- CAGR 2026–2036
- 12.3%
2025 baseline · 2026–2036 forecast at 12.3% CAGR · hover a bar for the value
Key highlights
IEC 60422:2024 was published on 18 July 2024 as version 5.0 of the oil supervision and maintenance guidance, with a stability date of 2030.
That standard states that condition monitoring such as dissolved gas or furanic compound analysis is outside its scope, so online monitoring sits outside the framework utilities supervise oil under.
IEC 60422:2024 applies where oil sampling is practicable under normal operating conditions, which is the condition that defines where online monitoring is specified instead.
IEC 60599:2022 was published on 25 May 2022 as version 4.0 and interprets dissolved and free gas concentrations to diagnose equipment condition.
That guidance states that action is taken on its indications only with proper engineering judgment, which places the commercial value in the interpretation layer rather than in the sensor.
Retrofit on in-service transformers accounts for the largest share of deployments and the higher growth rate, at a CAGR of 13.0%.
Software is the fastest-growing offering at a CAGR of 15.4%, from a base of USD 662.4 million in 2026.
The average selling price rises from USD 24, 500 per system in 2026 to USD 29,300 per system by 2036 as multi-parameter systems replace single-parameter sensors.
By offering, hardware accounts for the largest share of 52.4% in 2026, while software registers the highest CAGR.
By monitoring type, dissolved gas analysis accounts for the largest share of 31.4%, while partial discharge monitoring registers the highest CAGR of 14.6%.
By installation type, retrofit accounts for the largest share of 58.6% and also the higher CAGR.
By end user, utilities and transmission system operators account for the largest share of 62.4%, while renewable generation registers the highest CAGR of 15.0%.
By geography, Europe accounts for the largest share of 30.6% in 2026, while Asia-Pacific registers the highest CAGR of 13.8%.
Report summary
| Particulars | Details |
|---|---|
| Forecast Period | 2026-2036 |
| Base Year | 2025 |
| Estimated Year | 2026 |
| CAGR (Value) | 12.3% by value and 10.3% by volume |
| Format | PDF, Excel & Cloud Portal · 302 pages |
| Market Size (Value) in 2025 | USD 2.14 billion (88.0 thousand systems) |
| Market Size (Value) in 2026 | USD 2.40 billion (98.0 thousand systems) |
| Market Size (Value) in 2036 | USD 7.68 billion (262.0 thousand systems) |
| Average Selling Price | USD 24,500 per system in 2026 to USD 29,300 per system by 2036 |
| Largest Segment by Offering (2026) | Hardware (52.4%) |
| Fastest-Growing Segment by Offering | Software (CAGR 15.4%) |
| Largest Region (2026) | Europe (30.6%) |
| Fastest-Growing Region | Asia-Pacific (CAGR 13.8%) |
| Segments Covered | Offering, Monitoring Type, Installation Type, End User, Geography |
| Countries Covered | Germany, U.K., France, Italy, Spain, Sweden, Norway, Rest of Europe, China, India, Japan, South Korea, Australia, Rest of Asia-Pacific, U.S., Canada, Saudi Arabia, U.A.E., South Africa, Rest of Middle East & Africa, Brazil, Chile, Mexico, Rest of Latin America |
| Key Companies | 16 companies and other companies |
Report overview
Segments covered: offering, monitoring type, installation type, end user.
The growth of this market is mainly driven by the rising age of transformer fleets that must be kept in service beyond their design life, the growing cost of an unplanned transformer outage in networks running closer to their limits, the increasing deployment of transformers at sites where routine oil sampling is impractical, and the expanding use of analytics that convert a measurement into a maintenance decision. However, factors such as the exclusion of condition monitoring from the standard governing oil supervision, the absence of a published framework qualifying an online monitor against the laboratory method the interpretation guidance assumes, the requirement for engineering judgment before a diagnosis becomes an action, and the additive cost of online monitoring where periodic sampling continues alongside it are expected to restrain the growth of this market to some extent.
In volume terms, deployments are expected to reach 262.0 thousand systems by 2036 from an estimated 98.0 thousand systems in 2026 and 88.0 thousand systems in 2025, registering a CAGR of 10.3% during the forecast period, with the average selling price rising from USD 24,500 per system to USD 29,300 per system as multi-parameter systems with analytics supplied as part of the scope replace single-parameter sensors.
Value grows faster than volume because the scope per deployment widens from one measurement to several with an interpretation layer attached, so the price per system rises while the number of systems installed grows more slowly.
Transformer monitoring covers the sensors, instruments, software and services that report the condition of an oil-filled transformer while it remains energised, and the purchase is justified by the cost of the outage it avoids rather than by the cost of the inspection it replaces. Spending is concentrated on units whose failure would be expensive or whose replacement would take longer than the network can tolerate, which is why a small share of the transformer population carries most of the monitoring.
IEC 60422:2024, Mineral insulating oils in electrical equipment, Supervision and maintenance guidance, published on 18 July 2024 as version 5.0 with a stability date of 2030 provides monitoring guidance and procedures for the use and maintenance of mineral insulating oils and other hydrocarbon-based liquids in transformers and other electrical equipment including strategic spares, applies to oils originally supplied to IEC 60296 where oil sampling is practicable under normal operating conditions, and outlines methods for reconditioning and reclaiming oil and for decontaminating PCB-contaminated oil. Within that document, condition monitoring such as dissolved gas or furanic compound analysis is stated to be outside the scope of that document. The framework utilities supervise oil under is therefore a periodic sampling regime that assumes sampling is practicable under normal operating conditions, and it does not reach the continuous measurement an online monitor provides. Online monitoring consequently sits alongside the sampling programme rather than inside it, and until a utility accepts the correlation between the two it carries the cost of both.
IEC 60599:2022, Mineral oil-filled electrical equipment in service, Guidance on the interpretation of dissolved and free gases analysis, published on 25 May 2022 as version 4.0 by Technical Committee 10, with a stability date of 2026 describes how the concentrations of dissolved gases or free gases can be interpreted to diagnose the condition of oil-filled electrical equipment in service and suggest future action, covers equipment filled with mineral insulating oil and insulated with cellulosic paper or pressboard, addresses power, instrument, industrial, railway and distribution transformers together with reactors, bushings, switchgear and oil-filled cables through application notes, applies to other liquid-solid insulating systems only with caution, and states that its indications are guidance on which action is taken only with proper engineering judgment. Diagnosis therefore rests on interpretation of concentrations rather than on a measurement alone, and the standard is explicit that action follows only with engineering judgment. The commercial value in this market sits in the interpretation layer for that reason, and software grows faster than the hardware that feeds it while services remain necessary because the judgment the standard requires has to come from somewhere.
No published framework qualifies an online monitor as a measurement device against the laboratory method the interpretation guidance assumes, so suppliers compete on correlation data from their own installed base rather than on a certified accuracy figure. Utility tenders specify laboratory comparison over a defined period, and a supplier without that record loses at the technical evaluation whatever the sensor specification states.
Offshore substations, units inside buildings or tunnels, transformers on energised sites with restricted access, remote generation connections and critical transmission units all make a technician visit expensive or difficult to schedule, and the cost of the monitoring is set against that rather than against a laboratory fee, which is why sites where sampling is impractical are where monitoring is specified first. Fleet-wide deployment follows later and on different arithmetic.
Retrofit accounts for most of the market because the transformers that justify monitoring are already in service. A unit being kept beyond its design life is precisely the one whose condition the owner needs to know, and fitting a monitor to it is a fraction of the cost of replacing it. Factory-fitted monitoring grows as transformer makers include it in their standard scope, but the installed fleet is larger than the order book and will remain the greater part of demand through the forecast.
Supply divides between transformer manufacturers that offer monitoring with their own equipment, instrument specialists that sell across makes, and test and diagnostics companies that reach the utility through an existing laboratory and services relationship. The manufacturer holds the factory-fitted scope and the specialist holds the retrofit, because retrofitting across a mixed fleet requires products that work on any make of transformer and a service organisation able to install on an energised site.
Europe, with a 30.6% share in 2026 valued at USD 734.4 million, at a CAGR of 11.4%.
Asia-Pacific, at a CAGR of 13.8%, valued at USD 705.6 million in 2026.
Europe accounts for 30.6% of the market in 2026, valued at USD 734.4 million, at a CAGR of 11.4%, led by Germany, the U.K., France, Italy and the Nordic countries.
The Middle East & Africa accounts for 7.6% in 2026, valued at USD 182.4 million, at a CAGR of 13.0%, and Latin America for 5.2%, valued at USD 124.8 million, at a CAGR of 11.0%.
The report profiles 16 companies, including Hitachi Energy Ltd, Siemens Energy AG, GE Vernova Inc., Qualitrol Company LLC and Camlin Limited. The top five players account for an estimated 41.2% of the market in 2026.
Retrofit on in-service transformers, with a 58.6% share in 2026 valued at USD 1,406.4 million.
Retrofit, at a CAGR of 13.0%, against 11.4% for factory-fitted monitoring.
Utilities and transmission system operators, with a 62.4% share in 2026 valued at USD 1,497.6 million, at a CAGR of 12.0%.
Renewable generation, at a CAGR of 15.0%, valued at USD 292.8 million in 2026.
Report infographic
Market dynamics
15 factors across 5 forcesRising age of transformer fleets kept in service beyond their design life
Transformers commissioned during the decades of fastest network expansion are reaching the end of their design life in large numbers, and replacement at the rate implied by the age profile exceeds what utilities can fund or what manufacturers can deliver. Keeping a unit in service beyond its design life requires knowing its condition rather than assuming it, and the owner spends on monitoring in order to defer a replacement it cannot otherwise justify. The spend is approved against deferred capital rather than against reduced maintenance effort.
Lead times for large power transformers have lengthened to the point where an unplanned failure cannot be remedied within an outage season, which raises the value of advance warning well above the cost of the equipment that provides it. Owners holding strategic spares monitor those units too, since a spare that has degraded in storage defeats the purpose of holding it, and the supervision guidance covers strategic spares explicitly within its scope.
Growing cost of an unplanned transformer outage in constrained networks
Networks carrying more load through the same assets have less redundancy available when a transformer is lost, so the consequence of a failure has risen even where the failure rate has not. A transformer outage in a constrained corridor now affects more customers, more generation dispatch and more constraint payments than the same outage would have affected when the unit was installed. Monitoring is funded against that consequence, which is why the spend concentrates on critical transmission units rather than spreading evenly across a fleet.
Insurers and regulators have reinforced the position, with condition evidence increasingly expected as part of asset management reporting and risk assessment. Where a regulator assesses an owner on asset health, the data produced by monitoring becomes a reporting requirement as well as an operational tool, and the business case no longer depends solely on a failure avoided within the reporting period.
Increasing deployment of transformers where routine oil sampling is impractical
The oil supervision guidance applies where sampling is practicable under normal operating conditions, and a growing share of new transformer installations does not meet that condition. Offshore substations, units inside buildings and tunnels, transformers at remote generation connections and installations on energised sites with restricted access all make a sampling visit expensive, weather-dependent or impossible to schedule reliably. Monitoring is specified for those units at design stage rather than considered later.
The arithmetic at such sites is different from the arithmetic on an accessible unit, because the comparison is against a vessel mobilisation or a shutdown rather than against a laboratory fee. That is why monitoring penetration offshore and in building-integrated installations runs far ahead of penetration across the general transformer population, and why renewable connection projects are the fastest-growing end user group in this market at a CAGR of 15.0%.
Expanding use of analytics that convert a measurement into a maintenance decision
Interpretation guidance diagnoses condition from gas concentrations and states that action follows only with proper engineering judgment, which leaves a gap between a reading and a work order that software and expert services are being bought to close. Platforms that combine dissolved gas trends with loading, temperature, moisture and bushing data against a fleet baseline produce a ranked list of units requiring attention rather than a stream of readings, and that output is what an asset manager can act on.
Utilities with many monitored units gain more from the analytics than from any additional sensor, because the comparison between units is what identifies the outlier. Software consequently grows faster than hardware across the forecast, and the value of a monitoring estate rises with its size in a way that the hardware cost does not, which makes the first installation at a utility worth less than the tenth and shapes how suppliers price an initial programme.
Table of contents
12 chapters · 133 sections · 302 pages · click to expandSegmental analysis
| Segment | Largest share (2026) | Fastest growth (2026–2036) |
|---|---|---|
| By Offering | Hardware | Rapid growth of this |
| By Monitoring Type | Dissolved gas analysis | Rapid growth of this |
| By Installation Type | Retrofit | Large share and rapid growth of this |
| By End User | Utilities and transmission system operators | Rapid growth of this |
By Offering
- Transformer Monitoring Market Analysis by Offering
- The hardware segment is expected to account for the largest share of 52.4% of the global transformer monitoring market, valued at USD 1,257.6 million.
- The large share of this segment is mainly due to the sensors, gas extraction and measurement modules, bushing couplers, enclosures and communication equipment required at each monitored unit, and to the capital accounting treatment that allows an owner to fund the equipment from asset budgets.
- However, the software segment, valued at USD 662.4 million in 2026 and accounting for a share of 27.6%, is projected to register the highest CAGR of 15.4% during the forecast period.
- The rapid growth of this segment is attributed to the engineering judgment that interpretation guidance requires before a reading becomes an action, which is what platforms combining gas, loading, temperature, moisture and bushing data against a fleet baseline are bought to supply, and to licence revenue that recurs for as long as the estate operates.
- Services account for 20.0%, valued at USD 480.0 million, growing at a CAGR of 12.8% in installation on energised sites, laboratory comparison during the evaluation period, and alert triage and diagnosis sold as a subscription.
- The offering mix shifts across the forecast because the interpretation layer scales with the number of monitored units while hardware scales with installations, so the software and services share rises on an estate that is growing rather than on higher prices per unit of software supplied.
- Hardware remains the larger share throughout the forecast because every monitored unit requires its own sensing and acquisition equipment regardless of how the data is interpreted.
- Hardware, with a 52.4% share in 2026 valued at USD 1,257.6 million.
- Software, at a CAGR of 15.4%, valued at USD 662.4 million in 2026, against 10.6% for hardware.
By Monitoring Type
- Transformer Monitoring Market Analysis by Monitoring Type
- The dissolved gas analysis segment is expected to account for the largest share of 31.4% of the market, valued at USD 753.6 million.
- The large share of this segment is mainly due to published interpretation guidance that gives a diagnosis from gas concentrations, which makes the measurement actionable in a way that few other parameters are, and to fault detection covering thermal and electrical mechanisms in one measurement.
- Oil quality and moisture monitoring accounts for 18.6%, valued at USD 446.4 million, growing at a CAGR of 11.4%, with moisture in paper the property that limits loading and life.
- However, the partial discharge segment, valued at USD 388.8 million in 2026 and accounting for a share of 16.2%, is projected to register the highest CAGR of 14.6% during the forecast period.
- The rapid growth of this segment is attributed to detection of insulation defects that gas analysis identifies late or not at all, and to sensor and acquisition costs that have fallen to the point where the measurement is justified on more than only the largest units.
- Bushing and insulation monitoring accounts for 12.4%, valued at USD 297.6 million, thermal and winding temperature monitoring for 11.8%, valued at USD 283.2 million, and load tap changer and auxiliary monitoring for 9.6%, valued at USD 230.4 million, the last addressing the component that accounts for a disproportionate share of transformer faults relative to its cost.
- Parameter selection follows the failure modes an owner has experienced on its own fleet rather than a standard specification, which is why the monitoring type mix differs between utilities holding similar assets in similar networks and comparable loading.
- Dissolved gas analysis, with a 31.4% share in 2026 valued at USD 753.6 million.
- Partial discharge monitoring, at a CAGR of 14.6%, valued at USD 388.8 million in 2026.
By Installation Type
- Transformer Monitoring Market Analysis by Installation Type
- The retrofit segment is expected to account for the largest share of 58.6% of the market, valued at USD 1,406.4 million, and is also projected to register the highest CAGR of 13.0% during the forecast period.
- The large share and rapid growth of this segment are mainly due to the transformers that justify monitoring being already in service, to units retained beyond their design life requiring condition evidence in order to defer replacement, and to an installed fleet far larger than the annual order book.
- Factory-fitted monitoring, valued at USD 993.6 million in 2026 and accounting for a share of 41.4%, grows at a CAGR of 11.4% as transformer manufacturers include monitoring in their standard scope and as developers specify it with the equipment at design stage.
- The two routes reach different buyers, with retrofit decided by an asset owner across a mixed fleet and factory-fitted decided by the equipment maker or the project developer before handover, so a supplier strong in one route does not automatically reach the other.
- Retrofit also carries a service content that factory-fitted work does not, because installation on an energised transformer or within a short outage requires qualified field crews rather than factory assembly, which is why service content is higher in the retrofit route.
By End User
- Transformer Monitoring Market Analysis by End User
- The utilities and transmission system operators segment is expected to account for the largest share of 62.4% of the market, valued at USD 1,497.6 million, growing at a CAGR of 12.0%.
- The large share of this segment is mainly due to ownership of the critical transmission units whose failure carries the largest consequence, to regulatory asset health reporting that treats condition data as evidence, and to fleet sizes large enough for comparison between units to produce a diagnosis.
- Industrial users account for 18.6%, valued at USD 446.4 million, growing at a CAGR of 11.4% in process plant, mining, steel and petrochemical substations where a transformer outage stops production.
- Commercial and infrastructure users account for 6.8%, valued at USD 163.2 million, in data centres, rail and airports.
- However, the renewable generation segment, valued at USD 292.8 million in 2026 and accounting for a share of 12.2%, is projected to register the highest CAGR of 15.0% during the forecast period.
- The rapid growth of this segment is attributed to offshore and remote installations where sampling is impractical and the cost of monitoring is set against a vessel mobilisation, and to specification at design stage by developers rather than at procurement by operators.
- End user mix also determines which monitoring types are bought, since utilities buy dissolved gas analysis on critical units while industrial and commercial owners buy thermal and oil quality monitoring on a larger count of smaller units, which gives the two groups different offering mixes as well as different monitoring types.
Geographic analysis
Europe
Largest shareIn 2026, Europe is expected to account for the largest share of 30.6% of the global transformer monitoring market, valued at USD 734.4 million, growing at a CAGR of 11.4% during the forecast period. The large share of this region is mainly due to regulatory frameworks that assess network owners on asset health and treat condition data as reporting evidence, to an old transformer population being extended rather than replaced, and to offshore wind connections where sampling is impractical. Germany, the United Kingdom, France, Italy and the Nordic countries lead, with the United Kingdom and the Nordic countries showing the highest penetration on transmission units and the longest record of parallel sampling and online data on which reduced sampling frequency has been justified.
Asia-Pacific
Fastest growthAsia-Pacific accounts for 29.4% of the market in 2026, valued at USD 705.6 million, and is projected to register the highest CAGR of 13.8% during the forecast period. Growth is led by China, where monitoring is specified on new ultra high voltage and renewable connection assets as built, by India, where network reinforcement and a rising count of critical units is driving retrofit programmes, and by Japan, South Korea and Australia, where ageing fleets and long replacement lead times favour condition-based extension. Local manufacture of both transformers and monitoring equipment also lowers the installed cost relative to other regions.
North America
North America accounts for 27.2% of the market in 2026, valued at USD 652.8 million, at a CAGR of 11.8%. Demand in the United States is driven by an ageing transmission fleet, by transformer lead times that make an unplanned failure impossible to remedy within an outage season, and by the holding of strategic spares that are themselves monitored. Canada contributes a smaller base weighted toward hydroelectric transmission and remote network assets where access for sampling is seasonal and a missed window postpones a test by months.
Middle East & Africa
The Middle East & Africa accounts for 7.6% of the market in 2026, valued at USD 182.4 million, at a CAGR of 13.0%, led by Saudi Arabia, the United Arab Emirates and South Africa where new transmission capacity is specified with monitoring from the outset and where high ambient temperatures accelerate degradation.
Latin America
Latin America accounts for 5.2%, valued at USD 124.8 million, at a CAGR of 11.0%, with Brazil, Chile and Mexico carrying most of the activity on long transmission corridors and renewable connection assets where distance makes a sampling visit costly.
Competitive landscape
Transformer manufacturers offering monitoring with their own equipment, instrument specialists selling across makes, and test and diagnostics companies reaching the utility through a laboratory and services relationship divide this market between them. The manufacturer holds the factory-fitted scope because the specification is settled when the transformer is ordered, while the specialist holds retrofit because a mixed fleet requires products that work on any make and a service organisation able to install on an energised site.
Competition at the technical evaluation turns on correlation with laboratory results rather than on sensor specification, because no published framework qualifies an online monitor against the method the interpretation guidance assumes. Suppliers present data from their own installed base over a defined comparison period, and a supplier without that record cannot pass the evaluation whatever the instrument claims. Early installed base is therefore a commercial asset rather than only a revenue record.
A supplier whose platform carries a fleet baseline and a ranked list of units requiring attention is difficult to displace on the price of a sensor, and it sees fleet condition before the owner issues a tender, so the analytics layer has become the position that holds hardware share. Suppliers without a platform compete closer to component terms, lose the services attached to the deployment, and face re-tender at every hardware cycle.
Expertise rather than manufacturing capacity limits how fast suppliers can grow, since the engineering judgment the interpretation guidance requires is being sold as a service and the people able to provide it are few. Suppliers with laboratory and diagnostics organisations built over decades consequently hold an advantage that a well-funded entrant cannot purchase quickly, and acquisitions in this market have been directed at diagnostics organisations rather than at sensor technology.
Some of the key players operating in the transformer monitoring market are Hitachi Energy Ltd, Siemens Energy AG, GE Vernova Inc., Schneider Electric SE, Eaton Corporation plc, ABB Ltd, Mitsubishi Electric Corporation, Toshiba Corporation, Hyundai Electric & Energy Systems Co., Ltd., ESCO Technologies Inc., Qualitrol Company LLC, Camlin Limited, Vaisala Oyj, OMICRON electronics GmbH, Megger Group Limited, and Schweitzer Engineering Laboratories, Inc., among others.
- —
IEC 60422:2024 was published on 18 July 2024 as version 5.0 of the oil supervision and maintenance guidance and states that condition monitoring such as dissolved gas or furanic compound analysis is outside its scope, while IEC 60599:2022, published on 25 May 2022 as version 4.0, remains the governing guidance on interpreting dissolved and free gases analysis.
- Hitachi Energy Ltd
- Siemens Energy AG
- GE Vernova Inc.
- Schneider Electric SE
- Eaton Corporation plc
- ABB Ltd
- Mitsubishi Electric Corporation
- Toshiba Corporation
- Hyundai Electric & Energy Systems Co., Ltd.
- ESCO Technologies Inc.
- Qualitrol Company LLC
- Camlin Limited
- Vaisala Oyj
- OMICRON electronics GmbH
- Megger Group Limited
- Schweitzer Engineering Laboratories, Inc.
Expert perspectives
Monitoring in this market is bought against the cost of an outage rather than against the cost of the inspection it might replace, and the reason sits in the standards. Oil supervision guidance excludes condition monitoring from its scope and applies where sampling is practicable, while interpretation guidance diagnoses from gas concentrations and requires engineering judgment before action, so an online monitor neither displaces the sampling programme nor produces a decision on its own. Spending is therefore approved where the consequence of failure is quantified and declined where it is not.
Value concentrates in the layer that supplies the judgment rather than the measurement. Platforms that rank a fleet against a baseline and services that triage and diagnose alerts are what convert a reading into a work order, and both recur for as long as the estate operates, which is why software grows at 15.4% and services at 12.8% against 10.6% for hardware. A supplier holding the analytics layer also defends hardware share it would lose on price alone.
Correlation data rather than sensor specification decides the technical evaluation, because nothing published qualifies an online monitor against the laboratory method. An installed base generating comparison data is consequently the asset that admits a supplier to a tender, and an entrant without one sells into the easier applications or through a transformer manufacturer. Expertise is the other scarce asset, since the judgment being sold as a service cannot be hired at the pace demand is growing.
The market reaches USD 7.68 billion by 2036 from USD 2.40 billion in 2026, and deployments grow more slowly than value because the scope per installation widens from one parameter to several with analytics attached, so the rising average selling price reflects scope and not price increases. Retrofit holds 58.6% of the market and the higher growth rate, which means the installed fleet rather than the order book sets the pace. Fleet-wide adoption stalls wherever an owner would have to reduce sampling to fund monitoring, since the governing guidance supports no such reduction. An accepted equivalence between a continuous reading and a laboratory sample is the largest swing factor in the forecast, and it would release a saving that currently cannot be claimed.
Growth in this market rests on a transformer population that has to be kept in service whatever happens to replacement capital, and it is paced by correlation evidence, approval routes and the supply of engineering judgment. Suppliers holding an installed base, an analytics platform and a diagnostics organisation will take a disproportionate share of the increase.
Customer perspectives
Head of Asset Strategy - transmission system operator, Europe
We are keeping units in service a decade past where we expected to, and we cannot do that on an assumption. The monitor is cheap against the transformer it lets us defer, and that is the budget it comes out of, not maintenance.
Monitoring funded against deferred replacement capital rather than against maintenance effort is why retrofit on in-service transformers holds the largest share of this market at 58.6% and the higher growth rate at 13.0%, and why the installed fleet rather than the order book sets the pace of demand through the forecast period in this market as a whole.
Offshore Asset Manager - renewable energy operator, North Sea
Sending anyone out to take an oil sample means a vessel and a weather window, so the standard approach does not work for us. We specified the monitoring with the transformer because by handover it is too late.
Sites where oil sampling is not practicable under normal operating conditions are where monitoring is specified at design stage, and the comparison against a vessel mobilisation rather than a laboratory fee is why renewable generation grows at 15.0% as the fastest end user group.
Substation Maintenance Manager - large industrial utility, North America
The monitor did not let us stop sampling, so for the first years we paid for both. What changed our view was our own parallel data, and we only trusted it because it was ours.
Online monitoring remains additive to the sampling programme because the supervision guidance excludes condition monitoring from its scope and offers no equivalence between a continuous reading and a laboratory sample, so each owner builds its own parallel evidence before reducing sampling, and the pace of fleet-wide adoption is set by that process rather than by the capability of the technology on offer.
Frequently asked questions
The market was valued at USD 2.14 billion in 2025 and USD 1.92 billion in 2024, and is estimated at USD 2.40 billion in 2026.
Cite this report
Meticulous Research. (2026). Transformer Monitoring Market - Global Opportunity Analysis and Industry Forecast (2026-2036) (Report No. MREP - 1042468). Meticulous Market Research Pvt. Ltd. https://www.meticulousresearch.com/product/transformer-monitoring-market-7151